

Abstract
As new metabolic pathways of cocaine were recently identified, a high performance liquid chromatography tandem mass spectrometry (LC-MS/MS) method was developed to simultaneously determine cocaine and nine cocaine-related metabolites in whole blood samples. One-step solid phase extraction was used to extract all of the ten compounds and corresponding internal standards from blood samples. All compounds and internal standards extracted were separated on an Atlantis T3 (100Å, 3 µm, 2.1 mm × 150 mm I.D) column and detected in positive ion and high sensitivity mode with multiple reaction monitoring. This method was validated for its sensitivity, linearity, specificity, accuracy, precision, recovery, and stability. All of the ten compounds were quantifiable ranging from the lower limit of quantification (LLOQs) of ~10 nM (1.9–3.2 ng/ml) to ~1000 nM (190–320 ng/ml) without any interfering substance. Accuracy and precision were determined, and both of them were within the acceptance criteria of the United States (US) Food and Drug Administration (FDA) and European Medicines Agency (EMA) guidelines. The recovery was above 66.7% for all compounds. Stability tests demonstrated the stability of compounds under different storage conditions in whole blood samples. The method was successfully applied to a pharmacokinetic study with co-administration of cocaine and alcohol in rats.
Keywords: Cocaine, alcohol, drug metabolism, SPE, LC-MS/MS
1. Introduction
Cocaine is one of the most reinforcing and hepatotoxic drugs, accounting for majority of illicit drug-related emergency room (ER) visits in the United States [1]. In humans, approximately 40% of cocaine is hydrolyzed to biologically inactive metabolite ecgonine methyl ester (EME) by plasma enzyme butyrylcholinesterase (BChE) and liver carboxyesterase-2 (CE-2), but more cocaine is biotransformed to benzoylecgonine (BE) via hydrolysis catalyzed by CE-1, and to norcocaine via oxidization catalyzed by liver microsomal cytochrome P450 (CYP) 3A4 [2, 3]. This metabolic profile of cocaine is highly affected by alcohol co-consumption which commonly happens among cocaine users, as shown in Figure 1. Especially, alcohol decreases the hydrolysis of cocaine to BE by inhibiting the catalytic activity of CE-1 [4, 5]. Meanwhile, ethanol reacts with cocaine via catalysis by CE-1 to produce cocaethylene, which is further oxidized to norcocaethylene by CYP 3A4 [2, 3]. With alcohol co-administration, ~34% (oral), ~24% (intravenous), or ~18% (smoked) of cocaine is converted to cocaethylene through transesterification [6].
Figure 1.
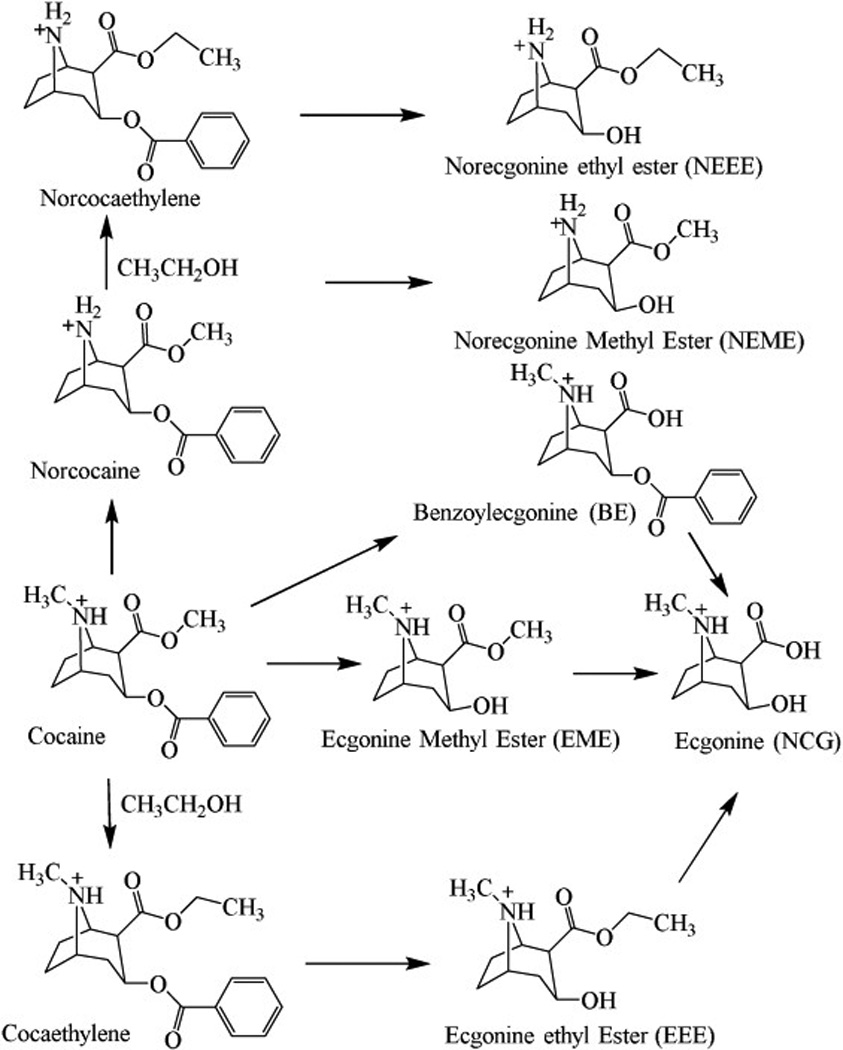
Cocaine metabolites produced through hydrolysis, oxidation, and reaction of cocaine with alcohol (CH3CH2OH).
Among the cocaine metabolites described above, BE, norcocaine, cocaethylene, and norcocaethylene are all physiologically/biologically active. These active metabolites have strong physiological effects such as vasoconstrictive effects, causing the hemodynamic changes, and producing lethality [7–11]. Recently, the metabolic pathways of those toxic compounds were identified during the process of developing therapeutic treatment for cocaine abuse. Briefly, BChE can catalyze the hydrolysis of BE to ecgonine (ECG), norcocaine to norecgonine methyl ester (NEME), cocaethylene to ecgonine ethyl ester (EEE), and norcocaethylene to norecgonine ethyl ester (NEEE) [3, 12–14]
Disastrous medical and social consequences of cocaine make it a high priority to develop an anti-cocaine medication for treatment-seeking users [15, 16]. There have been extensive efforts in development of therapeutic agents for cocaine abuse [3, 17–27]. Although target-based, traditional pharmacodynamic approaches using a small-molecule compound to treat cocaine abuse have not yielded a truly effective drug [18]. Alternative approaches using biologics (vaccines, monoclonal antibodies, and cocaine-metabolizing enzymes) might be promising. Preclinical and clinical studies indicate that biologic approaches are effective in both blocking cocaine toxicity and reducing drug craving [3, 17, 19–24, 28]. Biologics block cocaine’s access to the central nervous system (CNS) or other acting sites by either binding with cocaine or hydrolyzing it [21, 25, 26], possibly resulting in a significant change of metabolic profile of cocaine. There are extensive ongoing studies in developing highly effective medicines and, meanwhile, investigating their effects on the metabolic profiles of cocaine in the presence/absence of other substances (e.g. alcohol) co-administered. Therefore, it is highly desirable to develop a thoroughly validated bio-analytical method to simultaneously determine the blood concentrations of cocaine and related compounds.
A HPLC method with a UV detector was established in our previous studies to characterize pharmacokinetic profiles of cocaine and cocaine-related compounds in rats [12, 13, 19]. However, the UV method cannot be used to determine EME, ECG, NEME, EEE, and NEEE due to the lack of a conjugated system in these compounds. Several GC-MS and LC-MS/MS methods have been reported for simultaneous determination of cocaine and its metabolites including BE, norcocaine, cocaethylene, EME, and ECG [29–34]. These methods provided great separation, sensitivity, and selectivity. However, none of them was developed to determine NEME, EEE, or NEEE in whole blood. We hereby present a LC-MS/MS method combined with one-step solid phase extraction, allowing simultaneous determination of cocaine and all of the nine cocaine-related compounds. The method was applied to the analysis of whole blood samples for pharmacokinetic study in rats with co-administration of cocaine and alcohol.
2. Materials and Methods
2.1. Materials
Cocaine, EME, BE, ECG, norcocaine, cocaethylene, EEE, and norcocaethylene were provided by the National Institute of Drug Abuse (NIDA) Drug Supply Program (Bethesda, MD). NEME and NEEE were synthesized in our own lab for this study with the purity of >99%. The isotopic corresponding internal standards (IS) including cocaine-D3, EME-D3, BE-D3, ECG-D3, and cocaethylene-D3 were ordered from Cerilliant (Round Rock, TX). Ethanol, paraoxon, heparin, HPLC-grade methanol, and acetonitrile were purchased from Thermo Fisher Scientific (Waltham, MA). Formic acid was from Sigma-Aldrich (St. Louis, MO). Drug-free blank rat whole blood was sampled from male Sprague–Darley rats that were ordered from Harlan (Indianapolis, IN). Mixed cation exchange model solid phase extraction cartridges (Oasis MCX 1 cc Vac Cartridge, 10 mg) were obtained from Waters (Milford, MA).
2.2. Liquid chromatographic and mass spectrometric conditions
A Shimadzu HPLC system (Shimadzu, Kyoto, Japan), consisting of a DGU-20A/3R degasser, LC-20AD binary pumps, CBM-20A controller, and SIL-20A/HT auto sampler, was used in this study. The chromatographic analysis was carried out using an Atlantis T3 (100Å, 3 µm, 2.1 mm × 150 mm I.D) column (Waters, Milford, MA) which is a reversed-phase C18 column. The mobile phase A consisted of 0.1% formic acid and mobile phase B consisted of mobile phase A: acetonitrile (10:90, v/v). The flow rate was set at 0.2 ml/min. A 5 µl injection of each sample was loaded on to the column, separated and eluted using the following gradient: 0% B at 0 min, hold 0% B for 5 min, then B increased to 20% at 6 min, 40% B at 16 min, and 90% B at 18 min, hold 90% B for 4 min, 0% B at 23 min, and re-equilibrate at 0% B for 5 min. The total run time was 28 min. The column temperature was maintained at room temperature (~21°C). The auto sampler temperature was maintained at 15°C, and the auto sampler injection needle was washed with 200 µl mobile phase A: methanol (50:50, v/v) after each sample injection to reduce the carryover.
The mass spectrometer, AB SCIEX tripleTOF™ 5600 (AB SCIEX, Redwood City, CA), was run in positive ion and high sensitivity mode under the following conditions and settings: positive ions were generated in the source using nitrogen as the source gases. Ion source gas 1 (GS1) and 2 (GS2) were set at 25 and 35 respectively, and curtain gas (CUR) was set at 40. Source gas temperature was set at 500°C. Ion spray voltage floating (ISVF) was 3000 V. Compound-specific ionization parameters, ion transition, declustering potential (DP), collision energy (CE), collision energy spread (CES), ion release delay (IRD), and ion release width (IRW) were optimized and summarized in Table 1. Analyst® TF 1.7 software (AB SCIEX, Redwood City, CA) was used for instrument control and data acquisition. MultiQuant™ 3.0 software (AB SCIEX, Redwood City, CA) was used for quantitative analysis.
Table 1.
Optimized compound-specific source parameters for electrospray ionization
| Drugs | Ion transition | DP (V) | CE (eV) | CES (V) | IRD | IRW |
|---|---|---|---|---|---|---|
| Cocaine | 304.1→182.1 | 100 | 30 | 3.0 | 45 | 17 |
| EME | 200.1→182.1 | 80 | 31 | 3.0 | 45 | 17 |
| BE | 290.1→168.1 | 60 | 28 | 3.0 | 45 | 17 |
| ECG | 186.1→168.1 | 40 | 27 | 3.0 | 45 | 17 |
| Norcocaine | 290.1→168.1 | 50 | 25 | 3.0 | 45 | 17 |
| NEME | 186.1→136.1 | 90 | 36 | 3.0 | 45 | 17 |
| Cocaethylene | 318.2→196.1 | 50 | 29 | 3.0 | 45 | 17 |
| EEE | 214.1→196.1 | 40 | 28 | 3.0 | 45 | 17 |
| Norcocaethylene | 304.2→182.1 | 80 | 24 | 3.0 | 45 | 17 |
| NEEE | 200.1→182.1 | 60 | 22 | 3.0 | 45 | 17 |
| Cocaine-D3 | 307.2→185.1 | 50 | 30 | 3.0 | 45 | 17 |
| EME-D3 | 203.1→185.1 | 60 | 30 | 3.0 | 45 | 17 |
| BE-D3 | 293.2→171.1 | 60 | 30 | 3.0 | 45 | 17 |
| ECG-D3 | 189.1→171.1 | 30 | 25 | 3.0 | 45 | 17 |
| Cocaethylene-D3 | 321.2→199.2 | 50 | 28 | 3.0 | 45 | 17 |
2.3. Treatment of blood samples for mass spectrometry
The sample extraction method used in this study was established in our previous studies [14, 35]. Briefly, internal standard (IS) solution (0.1 µM for each IS) with a volume equal to that of the whole blood was added to each blood sample. The mixture was vortexed and then centrifuged for 15 min at 13,000 rpm; and the supernatant was collected and mixed with 500 µl 4% formic acid. Before being loaded onto solid-phase extraction column, Oasis MCX 1 cc Vac Cartridge, conditioned by 1 ml methanol followed by 1 ml water, the sample was centrifuged at 13,000 rpm for 15 min. Loaded cartridge was washed twice with 1 ml methanol, and the contents were eluted twice with 500 µl methanol/water solution (95:5, v/v, with 7.5% ammonium hydroxide). Eluate was evaporated to dryness at 25°C using a vacuum concentrator, reconstituted in 74 µl 0.1% formic acid, and centrifuged at 13,000 rpm for 15 min. Supernatant was transferred to a vial and stored refrigerated until analysis by LC-MS/MS.
2.4. Preparation of stock, calibration standards and quality control samples
Combined stock solution was prepared by mixing solutions of cocaine and its metabolites with those of the corresponding deuterium-labeled IS. The final concentration is 10 µM for each analyte, and 0.1 µM for each IS. Combined standard solutions were prepared by diluting the combined stock solution using the IS solution (0.1 µM for each IS) to various concentrations for each analyte and 0.1 µM for each corresponding IS. Calibration standards were prepared by adding 74 µl different concentrations of combined standard solutions into 174 µl blood mixture (74 µl whole blood + 100 µl paraoxon solution) from untreated Sprague-Dawley rats. Quality control samples were prepared in the same manner. The same method as described above was used to extract cocaine, nine cocaine-related compounds, and all ISs.
2.5. Method validation
Linearity and sensitivity
The validation was performed according to the United States (US) Food and Drug Administration (FDA) and European Medicines Agency (EMA) guidelines [36, 37]. Calibration curve was established by calculating the ratio of the peak area for analyte to that for the internal standard and plotting the ratio as a function of the ratio of the analyte concentration to the internal standard. The limit of detection (LOD) was considered the lowest concentration of analyte where the signal-noise ratio was greater than 3. The lower limit of quantification (LLQC) was defined as the lowest concentration of analyte with accuracy < 20% of the coefficient of variation (CV) and a precision within 20% of the nominal concentration.
Selectivity and carryover
Six sources of blank rat blood were individually analyzed and evaluated to determine if any interfering components were more than 20% of the LLQC for the analytes and 5% for the internal standards. Carryover was assessed by injection of a drug-free blank sample after a high concentration sample. Carryover in the blank sample should be less than 20% of the LLQC for the analytes and 5% for the internal standards.
Extraction recovery and matrix effect
Matrix effect and extraction recovery were determined in six replicates, at LLOQ, medium, and high concentration for all analytes. Samples were prepared in three ways as described by Liu et al. [2]: (a) prepared in the absence of blank matrix, (b) prepared by adding analyte to blank matrix extract, and (c), prepared by adding analyte to blank matrix prior to solid phase extraction. The matrix effect was calculated by dividing peak area of sample b by sample a; and the extraction recovery was calculated by dividing peak area of sample c by sample b.
Precision and accuracy
Accuracy was expressed as the percentage of the determined concentration to the nominal concentration of the analyte; and precision was expressed as % CV. Intra-day accuracy and precision of this method were assessed by analyzing in a single run of six QC samples at three levels including LLOQ, medium QC, and high QC. For inter-day accuracy and precision, LLOQ, medium QC, and high QC from three runs on three different days were evaluated.
Stability
The stability of cocaine and cocaine-related compounds in whole blood was evaluated using low, medium, and high QC samples (n = 6 for each level). The analyte was considered to be stable if the mean concentration at each level was within ±15% of the nominal concentration except for the LLOQ which should be within ±20% of the nominal value. The freeze-thaw stability samples were analyzed following four freeze-thaw cycles. The short-term stability samples were stored at room temperature for 4 hours, and the long-term stability samples were stored at −70°C for 4 months.
Animal tests and sample collection
Male Sprague–Darley rats were ordered from Harlan (Indianapolis, IN), and housed initially as one or two rats per cage. All rats were allowed ad libitum access to food and water and maintained on a 12 h light/12 h dark cycle, with the lights on at 8:00 a.m. at a room temperature of 21–22°C. Experiments were performed in the same colony room in accordance with the Guide for the Care and Use of Laboratory Animals as adopted and promulgated by the National Institutes of Health. The animal protocol was approved by the IACUC (Institutional Animal Care and Use Committee) at the University of Kentucky. Rats received IP injection of 1 g/kg alcohol (n=10) or saline (n=6) followed by cocaine administration (60 mg/kg, IP) 30 min after the injection of alcohol. Blood samples (50–75 µl) were collected into a heparin-treated capillary tube at 5, 10, 15,20, 30, 45, 60, 90, 120, 180, 240, 300, 360, 420, 480, and 600 min after the cocaine administration, and mixed with 100 µl paraoxon solution (250 µM paraoxon, 10 U/ml heparin) immediately. Blood samples were stored at −80°C until sample extraction.
3. Results and discussion
3.1. Method development
The optimization of sample preparation was performed with rat whole blood. Both perchloric acid and formic acid were tested for the sample acidification. With the treatment of perchloric acid, majority of protein in blood samples was precipitated, but the extraction recovery rates of analytes were significantly lower than those with the treatment of formic acid. Thus, the formic acid was chosen to acidify the sample. Various concentrations of formic acid with different volumes were also tested to clean up the blood samples before being loaded on the SPE column. Eventually, 4% formic acid with a volume 500 µl was selected.
A great challenge for development of this LC-MS/MS method was to separate three pairs of compounds: cocaine and norcocaethylene, norcocaine and BE, and ECG and NEME. Both compounds within each pair have exactly the same m/z, and very similar physicochemical properties and ion transition. Unqualified separation within the pair makes it extremely difficult to avoid the interference from each other. To solve this problem, the liquid chromatography method was modified according to the well-established method by Dr. Imbert [38]. The aqueous phase (phase A) of 2 mM ammonium formate, pH 3.0, was replaced by 0.1% formic acid. The gradient program was also adjusted with 0% B for the first 5 min separation, and longer holding of the initial condition before the next injection. Depicted in Figure 2 are representative chromatograms of cocaine and its metabolites detected.
Figure 2.
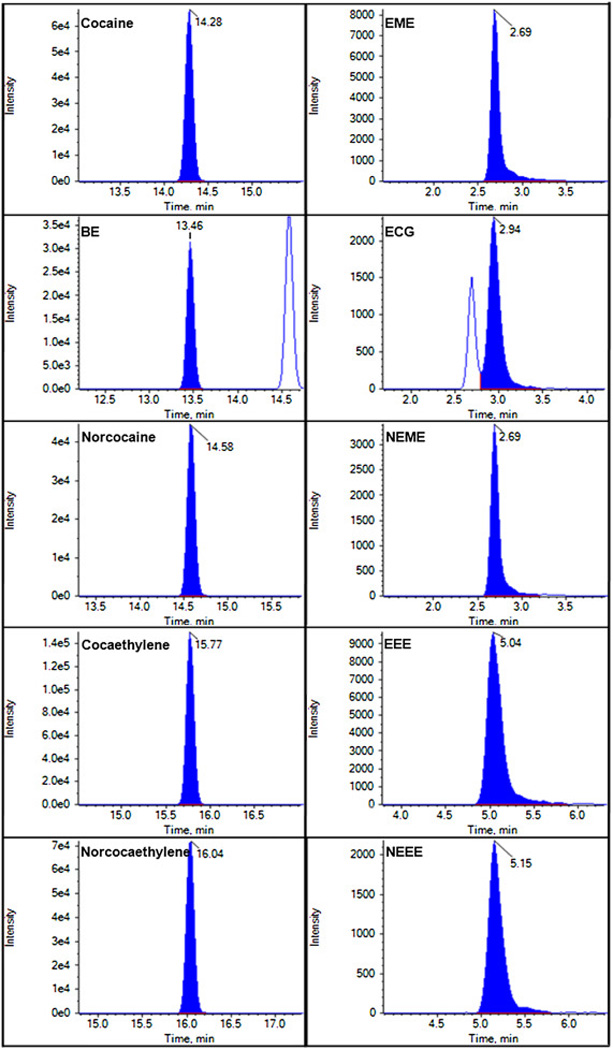
Representative chromatograms of cocaine and its metabolites.
Although the liquid chromatography method was optimized to get the good separation, the retention time of ECG (3.27 min) is still close to that of NEME (3.04 min). In order to further avoid the interference between ECG and NEME, compound-specific source parameters for electrospray ionization were optimized to generate fragment ion of ECG mainly at m/z 168.1 and fragment ion of NEME mainly at m/z 136.1.
3.2. Method validation
Selectivity and carryover
Six blank matrix samples from different sources were analyzed to access the selectivity. There was no endogenous interference observed. The auto sampler injection needle was washed with 200 µl mobile phase A: methanol (50:50, v/v) after each sample injection to reduce carryover. Only slight carryover effects (less than 20% of the LLQCs for the analytes and 5% for the internal standards) in the blank samples were observed. To further avoid the carryover, a 0.1% formic acid sample was always injected following the samples.
Linearity and sensitivity
LODs, LLOQs, and regression diagnostics of all analytes were reported in Table 2. The LODs and LLOQs for this method ranged from 0.2 to 0.9 ng/ml and 1.9 to 3.2 ng/ml, respectively, for all the substrates in whole blood samples. The calibration curve was linear over the concentration range of LLOQ to ~200/~300 ng/ml, with the correlation coefficients (r) > 0.99.
Table 2.
Linearity, regression diagostics, LODs, and LLOQs
| Compound | Linearity range (ng/ml) |
Internal standard (ng/ml) |
Slope | Intercept | r | LOD (ng/m l) |
LLO Q (ng/m l) |
|---|---|---|---|---|---|---|---|
| Cocaine | 3.0–300 | Cocaine-D3 (30) | 0.7279 | 0.0319 | 0.9973 | 0.9 | 3.0 |
| EME | 2.0–200 | EME-D3 (20) | 0.8994 | 0.0352 | 0.9984 | 0.6 | 2.0 |
| BE | 2.9–290 | BE-D3 (29) | 0.6905 | 0.0562 | 0.9969 | 0.9 | 2.9 |
| ECG | 1.9–190 | ECG-D3 (19) | 0.6526 | 0.0263 | 0.9965 | 0.6 | 1.9 |
| Norcocaine | 2.9–290 | Coc-D3(30) | 0.3274 | 0.0054 | 0.9974 | 0.3 | 2.9 |
| NEME | 1.9–190 | Coc-D3(30) | 0.0816 | 0.0044 | 0.9942 | 0.2 | 1.9 |
| Cocaethylene | 3.2–320 | Cocaethylene-D3 (32) |
0.8920 | 0.0178 | 0.9986 | 0.3 | 3.2 |
| EEE | 2.1–210 | Coc-D3(30) | 0.5001 | 0.0030 | 0.9972 | 0.2 | 2.1 |
| Norcocaethyle ne |
3.0–300 | Coc-D3(30) | 0.4590 | 0.0061 | 0.9974 | 0.3 | 3.0 |
| NEEE | 2.0–200 | Coc-D3(30) | 0.1131 | 0.0026 | 0.9966 | 0.2 | 2.0 |
Extraction recovery and matrix effect
Extraction recovery and matrix effect values at low, medium, and high concentrations are reported in Table 3. Strongest ion suppression was observed for EME at low, medium, and high concentrations, with matrix effects of 23.2%, 31.2%, and 34.6%, respectively; similarly high matrix effects were also found previously for some cocaine metabolites including EME [39] and ECG [34]. On the other hand, the matrix effect for EME was similarly strong at all of the EME concentrations such that both the sensitivity and the linearity of the calibration curve for EME are satisfactory. Interestingly, although similarly strong ion suppression for ECG in the blood matrix was reported [34], there was no such strong ion suppression for ECG observed in this study, with the matrix effects of ECG 67.6%, 70.2 %, and 71.8% at low, medium, and high concentrations, respectively. The matrix effects of other eight substrates ranged from 52.1% to 104.1% at low concentration, from 57.7% to 88.3% at medium concentration, and from 59% to 84.7% at high concentration. The one-step solid phase extraction yielded good recovery rates for all of the 10 analytes, with the extraction recovery rates ranging from 66.7% to 96.2 at low concentration, from 82.9% to 113.9% at medium concentration, and from 76.8% to 96.7 at high concentration.
Table 3.
Matrix effect (ME) and extraction recovery at low, medium, and high concentrations in rat whole blood
| Compound | Low concentration | Medium concentration | High concentration | IS | ||||
|---|---|---|---|---|---|---|---|---|
| ME (%) | ER (%) | ME (%) | ER (%) | ME (%) | ER (%) | ME (%) | ER (%) | |
| Cocaine | 62.3 ± 8.3 | 78.8 ± 19.2 | 82.2 ± 3.8 | 97.1 ± 7.4 | 81.8 ± 3.2 | 77.8 ± 8.2 | 84.2 ± 4.9 | 73.9 ± 3.0 |
| EME | 23.2 ± 3.4 | 87 ± 8.6 | 31.2 ± 1.8 | 82.9 ± 5.6 | 34.6 ± 2.3 | 87.9 ± 3.4 | 23.6 ± 1.4 | 79.4 ± 5.6 |
| BE | 104.1 ± 7.4 | 96.2 ± 6.8 | 82.8 ± 4.5 | 112.5 ± 9.3 | 65.5 ± 2.8 | 87.9 ± 3.4 | 87.8 ± 4.8 | 81.4 ± 5.2 |
| ECG | 67.6 ± 6.5 | 95.1 ± 18.9 | 70.2 ± 4.7 | 113.9 ± 3.8 | 71.8 ± 3.7 | 90.8 ± 3.5 | 91.2 ± 5.6 | 84.2 ± 7.5 |
| Norcocaine | 82.1 ± 6.1 | 73.1 ± 3.1 | 88.3 ± 4.8 | 92.2 ± 8.3 | 83.8 ± 4.4 | 83.9 ± 8.9 | 84.2 ± 4.9 | 73.9 ± 3.0 |
| NEME | 52.1 ± 5.2 | 66.7 ± 11.3 | 57.7 ± 5.2 | 98 ± 6.9 | 59 ± 4.3 | 91.5 ± 5.0 | 84.2 ± 4.9 | 73.9 ± 3.0 |
| Cocaethylene | 58.5 ± 4.8 | 73.9 ± 4.9 | 72.3 ± 2.6 | 90.3 ± 2.9 | 75.3 ± 4.1 | 76.8 ± 6.3 | 59.7 ± 4.8 | 72.9 ± 4.3 |
| EEE | 75.6 ± 7.7 | 81.3 ± 10.2 | 82.6 ± 6.7 | 103.7 ± 8.2 | 84.7 ± 4.2 | 86.4 ± 4.5 | 84.2 ± 4.9 | 73.9 ± 3.0 |
| Norcocaethylene | 79.9 ± 10.6 | 69.1 ± 4.7 | 77.7 ± 5.7 | 92.8 ± 2.8 | 75.9 ± 4.3 | 76.8 ± 8.4 | 84.2 ± 4.9 | 73.9 ± 3.0 |
| NEEE | 84.3 ± 13.2 | 86.5 ± 11.5 | 81.6 ± 10.1 | 100.3 ± 13.8 | 81.8 ± 10.9 | 96.7 ± 9.1 | 84.2 ± 4.9 | 73.9 ± 3.0 |
Low concentration: 1.9–3.2 ng/ml (0.01 µM); Medium concentration: 95–160 ng/ml (0.5 µM); High concentration: 190–320 ng/ml (1 µM)
Precision and accuracy
Intra- and inter-day precision and accuracy were evaluated by analyzing QC samples (n = 6) at the low, medium, and high concentrations. The accuracy and precision data are summarized in Table 4. The intra-day precision (%CV) was 12.5% or less, and the inter-day precision was 13.6% or less. The intra-day accuracy was within ±13.6, and the inter-day accuracy was within ±15.0. According to the US FDA and EMA guidelines [36, 37], the bias values for intra- and inter-accuracy should be within 15% of the nominal values for QC samples, except for the LLOQ which should be within 20% of nominal concentrations, and the CV values for intra- and inter-precision should not be larger than 15% for QC samples, except for the LLOQ which should not exceed 20%. Therefore, the accuracy and precision values for the intra- and inter-studies of all of the 10 compounds are acceptable.
Table 4.
The intra- and inter-day precision and accuracy of the LC-MS/MS method used to quantify cocaine and its related compound in whole blood samples
| Drug | Intra-day | Inter-day | ||||||||||
|---|---|---|---|---|---|---|---|---|---|---|---|---|
| L | M | H | L | M | H | |||||||
| CV (%) |
Bias (%) |
CV (%) |
Bias (%) |
CV (%) |
Bias (%) |
CV (%) |
Bias (%) |
CV (%) |
Bias (%) |
CV (%) |
Bias (%) |
|
| Cocaine | 10.3 | −11.1 | 7.1 | 4.5 | 4.0 | 0.3 | 10.8 | −13.3 | 2.0 | 2.2 | 0.6 | 0.9 |
| EME | 8.0 | −2.9 | 4.0 | −0.4 | 3.5 | −3.2 | 7.8 | −8.8 | 3.2 | 3.3 | 2.7 | −0.2 |
| BE | 11.1 | −13.6 | 5.9 | −0.7 | 7.1 | −4.4 | 0.7 | −14.8 | 1.1 | 0.6 | 1.9 | −3.2 |
| ECG | 12.5 | 9.7 | 10.9 | −3.7 | 5.2 | 1.2 | 6.9 | 3.5 | 2.9 | −0.5 | 4.3 | 1.7 |
| Norcocaine | 2.5 | 11.8 | 2.9 | 2.3 | 7.9 | 9.9 | 0.9 | 12.8 | 1.1 | 3.4 | 1.6 | 11.5 |
| NEME | 9.8 | 11.9 | 4.2 | −6.4 | 5.9 | 10.2 | 13.6 | 8.5 | 7.0 | −11.1 | 2.3 | 12.6 |
| Cocaethylene | 4.1 | −11.6 | 2.0 | 1.7 | 5.8 | −1.1 | 1.9 | −10.4 | 0.5 | 1.2 | 1.1 | −2.3 |
| EEE | 8.2 | 5.7 | 3.2 | 1.1 | 3.4 | 5.6 | 7.7 | −1.1 | 6.4 | −5.9 | 4.3 | 10.1 |
| Norcocaethylene | 2.2 | 13.5 | 4.7 | 3.3 | 7.4 | 1.2 | 1.2 | 15.0 | 1.2 | 1.8 | 1.4 | 2.9 |
| NEEE | 5.9 | 12.5 | 3.5 | −4.1 | 6.0 | 7.2 | 11.9 | 11.4 | 1.6 | −5.8 | 0.6 | 7.8 |
Low concentration: 1.9–3.2 ng/ml (0.01 µM); Medium concentration: 95–160 ng/ml (0.5 µM); High concentration: 190–320 ng/ml (1 µM)
Stability
The stability testing is very important to evaluate the stability of all substrates during the sample collection and handling. The stability of analytes was evaluated at three concentrations after long-term and short-term storage, and after four freeze-thaw cycles. Results of stability testing are summarized in Table 5. The mean concentration of each compound (cocaine or metabolite) at each level was always within 15% of the nominal concentration for all stability tests. These results indicate that all compounds were stable at room temperature for at least four hours and at −80°C for at least four months; and the QC samples of all compounds were not affected by the four freeze-thaw cycles.
Table 5.
Stability of analytes in whole blood samples
| Drug | Stability | Low concentration | Medium concentration | High concentration | |||
|---|---|---|---|---|---|---|---|
| CV (%) | Bias (%) | CV (%) | Bias (%) | CV (%) | Bias (%) | ||
| Cocaine | Freeze-thaw (4 cycles) | 15.0 | 2.8 | 9.8 | −0.7 | 4.5 | −4.7 |
| Bench top (4 hours) | 12.4 | 2.3 | 6.7 | 0.3 | 4.8 | −6.7 | |
| Long-term (−70°C, 4 months) | 17.7 | −0.4 | 9.9 | 3.1 | 5.7 | −3.1 | |
| EME | Freeze-thaw (4 cycles) | 19.8 | 2.1 | 9.8 | 4.2 | 5.9 | 4.0 |
| Bench top (4 hours) | 15.4 | −9.6 | 4.7 | 5.9 | 6.9 | 0.3 | |
| Long-term (−70°C, 4 months) | 6.9 | −3.1 | 8.6 | 6.3 | 4.6 | 3.5 | |
| BE | Freeze-thaw (4 cycles) | 10.7 | −0.9 | 7.2 | 5.5 | 7.9 | 3.4 |
| Bench top (4 hours) | 13.6 | −0.5 | 8.6 | 0.7 | 6.1 | 1.7 | |
| Long-term (−70°C, 4 months) | 9.3 | −1.4 | 5.1 | 2.2 | 6.3 | 3.8 | |
| ECG | Freeze-thaw (4 cycles) | 14.9 | 3.5 | 9.4 | 10.2 | 6.9 | 2.6 |
| Bench top (4 hours) | 9.5 | −1.5 | 4.8 | 7.6 | 10.4 | 3.6 | |
| Long-term (−70°C, 4 months) | 12.7 | −4.9 | 9.7 | 10.7 | 6.5 | 3.8 | |
| Norcocaine | Freeze-thaw (4 cycles) | 8.2 | −1.0 | 11.7 | −0.2 | 3.2 | −1.2 |
| Bench top (4 hours) | 8.4 | −1.1 | 4.6 | 3.5 | 7.2 | 0.6 | |
| Long-term (−70°C, 4 months) | 3.3 | −2.9 | 6.4 | 2.2 | 4.2 | −1.4 | |
| NEME | Freeze-thaw (4 cycles) | 12.4 | −12.8 | 6.6 | −5.4 | 9.4 | 0.1 |
| Bench top (4 hours) | 11.3 | −14.3 | 5.7 | −1.5 | 10.6 | −2.2 | |
| Long-term (−70°C, 4 months) | 10.0 | −13.0 | 4.0 | −1.7 | 10.8 | −8.7 | |
| Cocaethylene | Freeze-thaw (4 cycles) | 4.7 | 0.7 | 4.8 | −3.7 | 3.2 | −4.1 |
| Bench top (4 hours) | 4.2 | 1.7 | 4.5 | −2.1 | 7.6 | 0.2 | |
| Long-term (−70°C, 4 months) | 5.4 | 3.7 | 3.9 | −1.8 | 1.4 | −0.6 | |
| EEE | Freeze-thaw (4 cycles) | 7.0 | −3.2 | 9.4 | −9.3 | 7.7 | 9.4 |
| Bench top (4 hours) | 8.5 | 1.2 | 4.4 | −4.4 | 8.3 | 6.8 | |
| Long-term (−70°C, 4 months) | 6.2 | −2.2 | 8.8 | −5.2 | 13.5 | −5.2 | |
| Norcocaethylene | Freeze-thaw (4 cycles) | 5.9 | 0.1 | 7.2 | −4.4 | 5.4 | −6.4 |
| Bench top (4 hours) | 3.2 | −0.2 | 7.2 | −0.9 | 4.1 | −2.2 | |
| Long-term (−70°C, 4 months) | 5.1 | −1.0 | 7.7 | −1.3 | 3.6 | 2.8 | |
| NEEE | Freeze-thaw (4 cycles) | 4.9 | 1.2 | 13.3 | 3.3 | 4.7 | 6.5 |
| Bench top (4 hours) | 8.6 | 1.4 | 5.1 | 2.4 | 12.1 | 3.7 | |
| Long-term (−70°C, 4 months) | 10.1 | −1.3 | 8.1 | −0.2 | 9.0 | −11.9 | |
Low concentration: 1.9–3.2 ng/ml (0.01 µM); Medium concentration: 95–160 ng/ml (0.5 µM); High concentration: 190–320 ng/ml (1 µM)
3.3. Application of the method
The validated method was used to quantify the concentrations of cocaine and the nine related compounds in blood samples collected in a pharmacokinetic study with co-administration of cocaine and alcohol to rats. The time-dependent blood concentrations of cocaine and its metabolites after the IP injection of 60 mg/kg cocaine (30 min after the injection of 1 g/kg alcohol or saline) in rats are depicted in Figure 3. For both groups of rats, cocaine reached its highest concentration of ~2400 ng/ml 20 min after the injection of cocaine, and then slowly fell over the 600-min period. Compared to the group without alcohol co-administration, the group with co-administration of alcohol had higher concentrations of cocaine and lower concentrations of benzoylecgonine. These data are consistent with the notion that alcohol can inhibit CE-1, the principal enzyme catalyzing the hydrolysis of cocaine to BE [40]. Meanwhile, CE-1 catalyzes the reaction of alcohol and cocaine to produce cocaethylene, which is further oxidized to norcocaethylene by CYP 3A4 [2, 3]. Overall, part of cocaine was hydrolyzed to biologically inactive product EME, but majority of cocaine was converted to physiologically/biologically active metabolites, including BE, norcocaine, cocaethylene, and norcocaethylene in the presence of alcohol. These active metabolites were further metabolized to compounds (such as ECG and EEE) without or with little physiological effects by the endogenous enzymes, but their concentrations fell very slowly.
Figure 3.
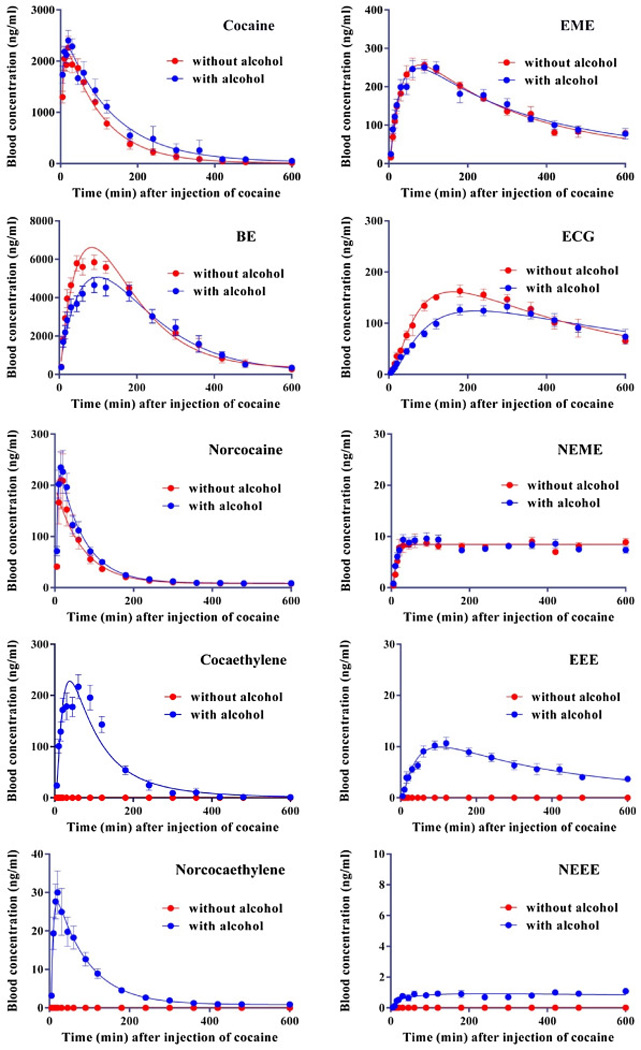
Metabolic profiles of cocaine in the presence/absence of alcohol in rats. Rats (n=10 with alcohol or n=6 without alcohol) were injected (IP) with 1 g/kg alcohol or saline 30 min before the IP injection of 60 mg/kg cocaine.
4. Conclusion
We have successfully developed a simple and rapid LC-MS/MS method combined with one-step solid phase extraction to simultaneously determine the concentrations of cocaine, EME, BE, ECG, norcocaine, NEME, cocaethylene, EEE, norcocaethylene, and NEEE in the rat blood samples. Great specificity, sensitivity, linearity, recovery, accuracy, precision, and stability of the method have been well demonstrated. With a successful application to a pharmacokinetic study in rats with co-administration of cocaine and alcohol, this method will be valuable for further studies that aim to characterize anti-cocaine therapeutic agents and their effects on metabolic profiles of cocaine in the presence/absence of alcohol.
Supplementary Material
Highlights.
► A LC-MS/MS method to simultaneously detect cocaine and 9 metabolites is developed. ► The method is highly sensitive and reliable for all of the 10 compounds detected. ► Metabolic profile of cocaine in rats with co-administration of alcohol is determined.
Acknowledgments
This work was supported by the National Institutes of Health (NIH) through an Avant-Garde Award (UH2 DA041115) and R01 grants (R01 DA035552, R01 DA032910, R01 DA013930, and R01 DA025100). The authors gratefully acknowledge helpful discussions with Dr. Markos Leggas and Ms. Jamie Horn.
Footnotes
Publisher's Disclaimer: This is a PDF file of an unedited manuscript that has been accepted for publication. As a service to our customers we are providing this early version of the manuscript. The manuscript will undergo copyediting, typesetting, and review of the resulting proof before it is published in its final citable form. Please note that during the production process errors may be discovered which could affect the content, and all legal disclaimers that apply to the journal pertain.
Supplementary Material Available: Figure S1 for calibration curves.
References
- 1.UNODC. World Drug Report 2010. United Nations Publications; 2010. [Google Scholar]
- 2.Gorelick DA. Expert Review of Clinical Pharmacology. 2008;1:277–290. doi: 10.1586/17512433.1.2.277. [DOI] [PubMed] [Google Scholar]
- 3.Zheng F, Zhan C-G. Biologics to Treat Substance Use Disorders. Heidelberg, Germany: Springer; 2016. Biologics to Treat Substance Use Disorders: Vaccines, Monoclonal Antibodies, and Enzymes; pp. 187–225. [Google Scholar]
- 4.McCance-Katz EF, Price LH, McDougle CJ, Kosten TR, Black JE, Jatlow PI. Psychopharmacology. 1993;111:39–46. doi: 10.1007/BF02257405. [DOI] [PubMed] [Google Scholar]
- 5.Henning RJ, Wilson LD, Glauser JM, Sebrosky G, Sutheimer CA. Critical Care Medicine. 1994;22:1896–1906. [PubMed] [Google Scholar]
- 6.Herbst ED, Harris DS, Everhart ET, Mendelson J, Jacob P, Jones RT. Experimental and Clinical Psychopharmacology. 2011;19:95–104. doi: 10.1037/a0022950. [DOI] [PubMed] [Google Scholar]
- 7.Gorelick DA. Drug and Alcohol Dependence. 1997;48:159–165. doi: 10.1016/s0376-8716(97)00119-1. [DOI] [PubMed] [Google Scholar]
- 8.Thompson ML, Shuster L, Shaw K. Biochemical Pharmacology. 1979;28:2389–2395. doi: 10.1016/0006-2952(79)90705-6. [DOI] [PubMed] [Google Scholar]
- 9.Crumb W, Clarkson CW. Journal of Pharmacology and Experimental Therapeutics. 1992;261:910–917. [PubMed] [Google Scholar]
- 10.Madden JA, Konkol RJ, Keller PA, Alvarez TA. Life Sciences. 1995;56:679–686. doi: 10.1016/0024-3205(94)00501-i. [DOI] [PubMed] [Google Scholar]
- 11.Katz JL, Terry P, Witkin JM. Life Sciences. 1992;50:1351–1361. doi: 10.1016/0024-3205(92)90286-x. [DOI] [PubMed] [Google Scholar]
- 12.Hou S, Zhan M, Zheng X, Zhan C-G, Zheng F. Biochemical Journal. 2014;460:447–457. doi: 10.1042/BJ20140360. [DOI] [PMC free article] [PubMed] [Google Scholar]
- 13.Zhan M, Hou S, Zhan C-G, Zheng F. Biochemical Journal. 2014;457:197–206. doi: 10.1042/BJ20131100. [DOI] [PMC free article] [PubMed] [Google Scholar]
- 14.Chen X, Zheng X, Zhan M, Zhou Z-Y, Zhan C-G, Zheng F. ACS Chemical Biology. 2016;11:2186–2194. doi: 10.1021/acschembio.6b00277. [DOI] [PMC free article] [PubMed] [Google Scholar]
- 15.Karila L, Gorelick D, Weinstein A, Noble F, Benyamina A, Coscas S, Blecha L, Lowenstein W, Martinot JL, Reynaud M. The International Journal of Neuropsychopharmacology. 2008;11:425–438. doi: 10.1017/S1461145707008097. [DOI] [PubMed] [Google Scholar]
- 16.Xi Z-X, Gardner EL. Current Drug Abuse Reviews. 2008;1:303–327. doi: 10.2174/1874473710801030303. [DOI] [PMC free article] [PubMed] [Google Scholar]
- 17.Zheng F, Yang W, Ko M-C, Liu J, Cho H, Gao D, Tong M, Tai H-H, Woods JH, Zhan C-G. Journal of the American Chemical Society. 2008;130:12148–12155. doi: 10.1021/ja803646t. [DOI] [PMC free article] [PubMed] [Google Scholar]
- 18.Skolnick P. Trends in Pharmacological Sciences. 2015;36:628–635. doi: 10.1016/j.tips.2015.07.002. [DOI] [PMC free article] [PubMed] [Google Scholar]
- 19.Xue L, Hou S, Tong M, Fang L, Chen X, Jin Z, Tai H-H, Zheng F, Zhan C-G. Biochemical Journal. 2013;453:447–454. doi: 10.1042/BJ20130549. [DOI] [PMC free article] [PubMed] [Google Scholar]
- 20.Zheng F, Xue L, Hou S, Liu J, Zhan M, Yang W, Zhan C-G. Nature communications. 2014;5 doi: 10.1038/ncomms4457. [DOI] [PMC free article] [PubMed] [Google Scholar]
- 21.Chen X, Xue L, Hou S, Jin Z, Zhang T, Zheng F, Zhan C-G. Proceedings of the National Academy of Sciences. 2016;113:422–427. doi: 10.1073/pnas.1517713113. [DOI] [PMC free article] [PubMed] [Google Scholar]
- 22.Carrera MRA, Trigo JM, Wirsching P, Roberts AJ, Janda KD. Pharmacology Biochemistry and Behavior. 2005;81:709–714. doi: 10.1016/j.pbb.2005.04.018. [DOI] [PubMed] [Google Scholar]
- 23.Cohen-Barak O, Wildeman J, van de Wetering J, Hettinga J, Schuilenga-Hut P, Gross A, Clark S, Bassan M, Gilgun-Sherki Y, Mendzelevski B. The Journal of Clinical Pharmacology. 2015;55:573–583. doi: 10.1002/jcph.450. [DOI] [PMC free article] [PubMed] [Google Scholar]
- 24.Shram MJ, Cohen-Barak O, Chakraborty B, Bassan M, Schoedel KA, Hallak H, Eyal E, Weiss S, Gilgun Y, Sellers EM. Journal of clinical psychopharmacology. 2015;35:396–405. doi: 10.1097/JCP.0000000000000347. [DOI] [PubMed] [Google Scholar]
- 25.Zheng F, Zhan C-G. Future Medicinal Chemistry. 2012;4:125–128. doi: 10.4155/fmc.11.171. [DOI] [PMC free article] [PubMed] [Google Scholar]
- 26.Skolnick P, White D, Acri JB. CNS & Neurological Disorders-Drug Targets (Formerly Current Drug Targets-CNS & Neurological Disorders) 2015;14:691–691. doi: 10.2174/187152731406150624122404. [DOI] [PubMed] [Google Scholar]
- 27.Gorelick DA, Gardner EL, Xi Z-X. Drugs. 2004;64:1547–1573. doi: 10.2165/00003495-200464140-00004. [DOI] [PubMed] [Google Scholar]
- 28.Carrera MRA, Ashley JA, Zhou B, Wirsching P, Koob GF, Janda KD. Proceedings of the National Academy of Sciences. 2000;97:6202–6206. doi: 10.1073/pnas.97.11.6202. [DOI] [PMC free article] [PubMed] [Google Scholar]
- 29.Bordin DCM, Alves MN, Cabrices OG, de Campos EG, De Martinis BS. Journal of Analytical Toxicology. 2014;38:31–38. doi: 10.1093/jat/bkt092. [DOI] [PubMed] [Google Scholar]
- 30.Peres MD, Pelição FS, Caleffi B, De Martinis BS. Journal of Analytical Toxicology. 2014;38:39–45. doi: 10.1093/jat/bkt093. [DOI] [PubMed] [Google Scholar]
- 31.Kohler I, Schappler J, Rudaz S. Analytica Chimica Acta. 2013;780:101–109. doi: 10.1016/j.aca.2013.03.065. [DOI] [PubMed] [Google Scholar]
- 32.Niessen W. Journal of Chromatography A. 2003;1000:413–436. doi: 10.1016/s0021-9673(03)00506-5. [DOI] [PubMed] [Google Scholar]
- 33.Liu Y, Zheng B, Strafford S, Orugunty R, Sullivan M, Gus J, Heidbreder C, Fudala PJ, Nasser A. Journal of Chromatography B. 2014;961:77–85. doi: 10.1016/j.jchromb.2014.04.052. [DOI] [PubMed] [Google Scholar]
- 34.Xiong L, Wang R, Liang C, Cao F, Rao Y, Wang X, Zeng L, Ni C, Ye H, Zhang Y. Analytical and Bioanalytical Chemistry. 2013;405:9805–9816. doi: 10.1007/s00216-013-7417-9. [DOI] [PubMed] [Google Scholar]
- 35.Chen X, Zheng X, Zhou Z, Zhan C-G, Zheng F. Chemico-Biological Interactions. 2016 doi: 10.1016/j.cbi.2016.05.003. [Epub ahead of print] [DOI] [PMC free article] [PubMed] [Google Scholar]
- 36.Committee for Medicinal Products for Human Use. Guideline on Bioanalytical Method Validation. London, UK: European Medicines Agency; 2011. [Google Scholar]
- 37.Food and Drug Administration Guidance for Industry: Bioanalytical Methods Validation. US Department of Health and Human Services, FDA, Center for Drug Evaluation and Research. Rockville, MD: 2001. [Google Scholar]
- 38.Imbert L, Dulaurent S, Mercerolle M, Morichon J, Lachâtre G, Gaulier J-M. Forensic Science International. 2014;234:132–138. doi: 10.1016/j.forsciint.2013.11.004. [DOI] [PubMed] [Google Scholar]
- 39.Xiong L, Wang R, Liang C, Cao F, Rao Y, Wang X, Zeng L, Ni C, Ye H, Zhang Y. Anal. Bioanal. Chem. 2013;405:9805–9816. doi: 10.1007/s00216-013-7417-9. [DOI] [PubMed] [Google Scholar]
- 40.Roberts SM, Harbison RD, James RC. Drug metabolism and disposition. 1993;21:537–541. [PubMed] [Google Scholar]
Associated Data
This section collects any data citations, data availability statements, or supplementary materials included in this article.