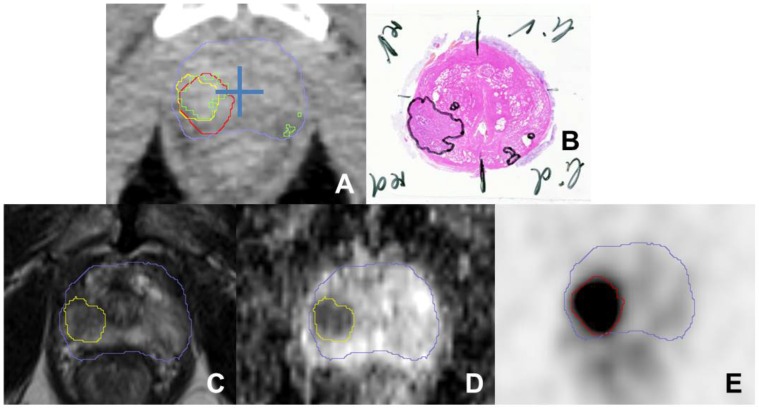
Figure 2.
A shows a transverse CT image (from PSMA PET/CT scan) with projected GTVs (green: histology, red: consensus GTV PSMA PET, yellow: MRI) for patient 4. The blue cross was placed in the middle of the prostate to separate each CT slice into four quadrants to analyse sensitivity and specificity. Haematoxylin and eosin gross section histopathology shows a large tumour focus in the right lobe and small foci in the left peripheral zone (B). Transverse T2-weighted image (C) shows a slightly hypointense signal with restricted diffusion in the apparent ADC map (D). PSMA PET image (E) shows intense focal uptake located in the right lobe. The blue contour represents the prostatic border in the corresponding CT scan.

