

Abstract
Congenital generalized lipodystrophy (CGL) and pulmonary arterial hypertension (PAH) have recently been associated with mutations in the caveolin-1 (CAV1) gene, which encodes the primary structural protein of caveolae. However, little is currently known about how these CAV1 mutations impact caveolae formation or contribute to the development of disease. Here, we identify a heterozygous F160X CAV1 mutation predicted to generate a C-terminally truncated mutant protein in a patient with both PAH and CGL using whole exome sequencing, and characterize the properties of CAV1, caveolae-associated proteins and caveolae in skin fibroblasts isolated from the patient. We show that morphologically defined caveolae are present in patient fibroblasts and that they function in mechanoprotection. However, they exhibited several notable defects, including enhanced accessibility of the C-terminus of wild-type CAV1 in caveolae, reduced colocalization of cavin-1 with CAV1 and decreased stability of both 8S and 70S oligomeric CAV1 complexes that are necessary for caveolae formation. These results were verified independently in reconstituted CAV1−/− mouse embryonic fibroblasts. These findings identify defects in caveolae that may serve as contributing factors to the development of PAH and CGL and broaden our knowledge of CAV1 mutations associated with human disease.
Keywords: caveolae, caveolin, cavin, congenital generalized lipodystrophy, detergent resistant membranes, immunofluorescence microscopy, mechanoprotection, protein complexes, pulmonary arterial hypertension
1 INTRODUCTION
Flask-shaped membrane invaginations known as caveolae are thought to function as key regulators of cholesterol and lipid metabolism as well as maintain proper function of the vascular system.1,2 Congenital generalized lipodystrophy (CGL) and pulmonary arterial hypertension (PAH), diseases of the adipose tissue and vascular endothelium, respectively have been associated with mutations in caveolin-1 (CAV1), a protein required for the formation of caveolae.3,4 CAV1 and caveolae are abundant in cell types linked to CGL and PAH, including adipocytes, endothelial cells and smooth muscle cells.1,5,6 Mutations in another caveolae-stabilizing protein, cavin-1/PTRF, have also been linked to lipodystrophy, further highlighting the importance of these structures in the maintenance of lipid homeostasis.7–13
So far, there has been one reported case of a patient with CGL with a homozygous CAV1 mutation (E38X),14 and three individuals with heterozygous mutations in CAV1 (I134 fsdelA-X137 and -88delC) with atypical partial lipodystrophy15 (Table 1 and Figure 1). Through whole exome sequencing, our group identified two novel frameshift heterozygous mutations in CAV1, c.474delA (p.P158PfsX22) and c.473delC (p.P158HfsX22), in patients lacking other known PAH-associated mutations, such as BMPR2.3 These two different CAV1 mutations have nearly the same effect on the protein by introducing a frameshift after amino acid 158 and inserting the same 21 novel amino acids after amino acid 158. However, exactly how these CAV1 mutations contribute to the development of PAH or lipodystrophy, and why different CAV1 mutations are linked to different diseases is currently unclear.
TABLE 1.
Summary of CAV1 mutations, mode of inheritance and phenotype
| CAV1 mutation | F160X | Q142X | E38X | I134 fsdelA-X137 |
−88delC | P158P fsX22 | P158H fsX22 |
|---|---|---|---|---|---|---|---|
| Mode of inheritance |
Heterozygous | Heterozygous | Homozygous | Heterozygous | Heterozygous | Heterozygous | Heterozygous |
|
| |||||||
| Lipodystrophy | Congenital generalized lipodystrophy |
Congenital generalized lipodystrophy |
Congenital generalized lipodystrophy |
Congenital partial lipodystophy |
Adult-onset partial lipodystrophy |
Absent | Absent |
|
| |||||||
| PAH | Present | Absent | Absent | Absent | Absent | Present | Present |
|
| |||||||
| Reference | This study, 4,16 | 4 | 14 | 15 | 15 | 3 | 3 |
FIGURE 1.

CAV1 gene organization and reported CAV1 mutations associated with PAH and CGL in humans. Exons are shown in blue. *Protein palmitoylation sites. CAV1, caveolin-1; CSD, caveolin scaffolding domain.
Recently, a new heterozygous CAV1 nonsense mutation, c.479_480delTT (p.F160X), was reported in a patient with both pulmonary hypertension and CGL by two groups4,16 (Table 1 and Figure 1). The 2 base-pair deletion induces a premature stop codon, and is predicted to generate a C-terminally truncated mutant protein designated F160X. In the first study reporting the mutation, morphologically defined caveolae were observed by electron microscopy in skin fibroblasts isolated from the patient, but little CAV1 was detectible by immunofluorescence microscopy.4 The second study reported reduced CAV1 protein levels by western blotting as well as decreased colocalization of CAV1 with the caveolae accessory protein cavin1 in patient fibroblasts.16 Besides these initial findings, how heterozygous expression of the F160X mutant protein impacts caveolae formation and function remains otherwise unknown.
The assembly and targeting of CAV1 to caveolae is known to be a stepwise process involving oligomerization of newly synthesized CAV1 monomers, assembly of oligomers into high molecular weight complexes and trafficking to the plasma membrane.17 In this pathway, CAV1 forms an 8S core complex consisting of homo-oligomers and hetero-oligomers with CAV2 in the endoplasmic reticulum before being transported to the Golgi complex.17 There, the 8S core complexes assemble to 70S complexes that become enriched in cholesterol.17 Finally, 70S complexes are transported to plasma membrane and induce caveolae formation17 with the help of the cavin family of proteins as well as other accessory proteins such as EHD-2 and PACSIN2.18–27 The C-terminal domain of CAV1 (amino acids 135-178) has been reported to be important for interactions between adjacent homo-oligomers of CAV1 that are necessary for forming the higher-order CAV1 oligomers that ultimately become incorporated into caveolae.28,29 Thus, the F160X mutation could potentially influence on the assembly of CAV1 oligomers as well as possibly disrupt caveolae formation per se.
Here, we report the independent identification and characterization of caveolae in the patient with both PAH and CGL linked to a heterozygous F160X mutation in CAV1. We show that caveolae are present in skin fibroblasts isolated from the patient and that putative caveolae can be reconstituted by coexpression of wild-type CAV1 and CAV1 F160X in CAV1−/− murine embryonic fibroblasts (MEFs). The ability of caveolae to confer mechanoprotection against hypo-osmotic shock was unaffected in patient cells. However, expression of the CAV1 F160X mutant was found to reduce the levels of cavin-1 associated with CAV1, significantly impair the stability of both core CAV1 oligomers and higher-order CAV1 complexes, and decrease the association of CAV1 with detergent resistant membranes (DRMs). Thus, though caveolae are present in patient cells, they are not completely normal. These findings suggest that the formation of aberrant caveolae may contribute to the development of both PAH and CGL and broaden our knowledge of disease-associated CAV1 mutations.
2 RESULTS
2.1 Clinical description
The patient is a 3-year-old girl with CGL and PAH. She was born full-term with a birth weight of 2466 g (<fifth percentile), length of 46 cm (<fifth percentile) and head circumference of 35.5 cm (65th percentile). At birth, she was found to have a triangular face, a large anterior fontanelle, and cutis marmorata telangiectatica congenita over her entire body.
She was noted to have generalized absence of subcutaneous fat from birth and was therefore diagnosed with CGL. Her fasting triglyceride level was elevated at 168 (normal 30-150) mg/dL at 27 months, but a repeat test at 30 months was normal. Her cholesterol and LDL have been normal, though her HDL has been consistently low. Her leptin at 30 months was 1.0 (normal 0.6-16.8) ng/mL and insulin at 35 months was low at 1.3 (normal 2.6-24.9) mcU/mL. Abdominal ultrasound at 27 months showed no signs of fatty infiltration of the liver.
Her weight has remained below the fifth percentile since 3 months of age, while her height and head circumference have remained at the 50th percentile. Her clinical course is notable for episodes of abdominal pain and diarrhea occurring once a month, and she has been hospitalized on two occasions, at 15 and 27 months, for dehydration caused by these episodes. A duodenal biopsy performed at 27 months showed mild villous atrophy, crypt hyperplasia, and epithelial lymphocytosis, interpreted as a Marsh IIIA lesion30 suspicious for celiac disease though a tissue transglutaminase IgA antibody done at the time was negative.
She was diagnosed with pulmonary hypertension by echocardiogram at 15 months of age. Because of her unusual systemic disease, a lung biopsy was performed at 18 months showed changes consistent with mild pulmonary hypertension, including focal thickening of the smooth muscle in preacinar pulmonary arterioles. While she had no symptoms of syncope, dyspnea or exercise intolerance, persistent abnormalities on echocardiogram led to further work up for pulmonary hypertension including cardiac catheterization. At 35 months, cardiac catheterization confirmed a diagnosis of PAH with a mean pulmonary artery pressure (mPAP) of 33 mm Hg, pulmonary capillary wedge pressure of 11 mm Hg and pulmonary vascular resistance (PVR) of 3.97 Wood units. Acute vasodilator testing was notable for an acute response to 80 ppm of NO and 100% FiO2 with mPAP reduced to 21 mm Hg and PVR to 2.07 Wood units.
Developmentally, she has met her milestones on time and has a nonfocal normal neurological examination. However, MRI of her brain at 7 months showed global cerebral atrophy.
The family history is unrevealing for cardiopulmonary disease, lipodystrophy or other related concerns. Her parents, 2 older brothers and younger sister are all in good health, and there is no family history of lipodystrophy or pulmonary hypertension. Whole exome sequencing revealed a de novo heterozygous c.479_480delTT (p. F160X) mutation in CAV1 (Table 1 and Figure 1) and no other suspected pathogenic, rare or novel variants to explain either her lipodystrophy or PAH. The family of the patient confirmed that she is the same patient described in two previous studies.4,16
2.2 CAV1 and caveolae accessory proteins are expressed at near normal levels in patient skin fibroblasts
Previous studies have shown that caveolae are present in skin fibroblasts isolated from this patient4 and that CAV1 can be detected in skin fibroblasts albeit at reduced levels by western blotting.16 In order to determine if CAV1 protein was being expressed in the patient identified here, we performed western blot analysis using two different antibodies, an N-terminally directed antibody that detects both wild-type CAV1 and the F160X mutant, and a C-terminally directed antibody that only recognizes wild-type CAV1 (Figure 2). Similar levels of total CAV1 were observed in patient cells and control fibroblasts using the N-terminal antibody, whereas slightly decreased levels of wild-type CAV1 were detected by the C-terminal antibody in the patient cells versus controls (Figures 2 and S2A-D). Because the mutant protein is predicted to lack its C-terminus, this difference implies that the mutant protein is expressed in patient cells. We also analyzed levels of CAV2 and the caveolae accessory proteins cavin-1, EHD2 and PACSIN2, and found that they were present at either similar or slightly lower levels in patient cells as well (Figure 2). Finally, levels of flotillin-1 and flotillin-2, proteins that are noncaveolae lipid raft markers, were similar in patient and control cells (Figure 2).
FIGURE 2.
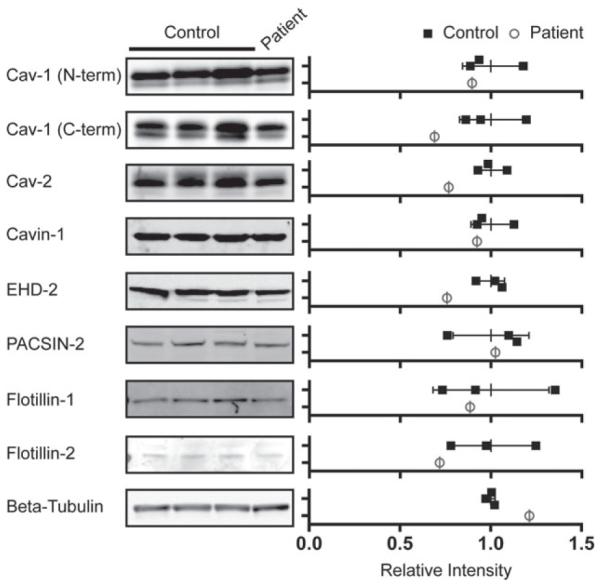
CAV1 and caveolar accessory proteins are present in patient skin fibroblasts at close to wild-type levels. (Left) Protein levels were measured in three control cell lines and the F160X patient cell line by SDS-PAGE and western blotting. Representative western blots for the indicated proteins are shown. (Right) The relative densitometries of the protein bands were quantified to estimate protein levels in control (closed squares) and patient skin fibroblasts (open circles). The data were normalized to the averaged value for the three control cell lines for each protein. Error bars are the mean ± SD of intensity for the three control lines. Data are representative of 3 independent experiments. CAV1, caveolin-1.
2.3 CAV1 forms 8S and 70S complexes but exhibits reduced detergent resistance in patient fibroblasts
CAV1 undergoes a series of oligomerization events that are required for the proper assembly of caveolae. To test whether this process occurs correctly in patient cells, we first examined the biochemical properties of 8S oligomeric complexes formed by CAV1 and CAV2 using blue native polyacrylamide gel electrophoresis (BN-PAGE).31–34 We previously reported that CAV1 and CAV2 form complexes with an apparent size of 600-800 kDa in several cell types using this method.34 CAV1 and CAV2 were detected in complexes of similar molecular weights in both control and patient skin fibroblasts (Figure 3A). To assess the assembly of higher order CAV1 oligomers in patient cells, we fractionated 8S and 70S complexes on sucrose gradients by velocity gradient centrifugation.17 Both 8S and 70S complexes were detected in control cells, with the majority of CAV1 being detected in 70S complexes (Figure 3B). CAV1 and CAV2 were also associated with both 8S and 70S complexes in patient fibroblasts. However, a larger fraction of CAV1 was found in 8S complexes compared with controls, suggesting that 70S complexes either form less efficiently or are less stable in patient cells (Figure 3B). To further assess the stability of the 8S complexes, we extracted cells using an SDS-containing lysis buffer (0.2% Triton X-100 + 0.4% SDS), which was previously shown to completely disassemble the 70S complexes to 8S oligomer units.17 Under these conditions, almost all of the CAV1 complexes were disassembled to monomers or small oligomers in patient cells, whereas the CAV1 from control cell lines remained associated with intact 8S oligomers (Figure 3C). Thus, the stability of the 8S complexes is decreased in patient cells.
FIGURE 3.

CAV1 associates with high molecular weight complexes and detergent resistant membranes in patient fibroblasts. A, BN-PAGE and western blotting was used to measure CAV1 in high molecular weight oligomers in control and patient skin fibroblasts. CAV proteins were detected with CAV1 N-terminal (red in merge) and CAV2 antibodies (green in merge). The position of the putative 8S complexes is marked with an arrow. B, CAV1 and CAV2 fractionate as 8S and 70S complexes in both control and patient skin fibroblasts. Positions of the 8S and 70S complexes on the gradient are indicated with red lines. Note the increased amounts of 8S complexes present in the patient fibroblasts. C, CAV1 oligomers dissolve into SDS-resistant 8S oligomers in control cells but form even smaller oligomers in patient cells. CAV2 was also assessed. Fractions containing 8S and 70S complexes are indicated with red lines on the gradient. D, CAV1 associates with DRMs isolated using 0.5% TX-100 in both control and patient fibroblasts. Fractions enriched in DRMs are indicated with the red lines. E, CAV1 is excluded from DRMs isolated using 1% TX-100 in patient fibroblasts but retains its detergent resistance in control fibroblasts under these conditions. All data sets shown are representative of 2 independent experiments. CAV1, caveolin-1.
It is well known that caveolae have detergent resistant properties and CAV1 is predominantly found in DRMs.35 Biochemical fractionation of DRMs on sucrose gradients by buoyant density is thus commonly used to analyze CAV1 and caveolae. CAV1 was detectible in DRM fractions (fractions 5-8) in both wild-type and patient cells extracted using 0.5% Triton X-100 (TX100) (Figure 3D). However, when the detergent concentration was increased to solubilize weakly associated DRM components, CAV1 was predominantly associated with detergent soluble fractions in patient cells. Thus, expression of CAV1 F160X reduces the DRM affinity of CAV1 (Figure 3E).
2.4 Caveolae are present in patient cells
The presence of 8S and 70S CAV1 complexes and acquisition of detergent resistance does not necessarily mean that CAV1 is normally associated with caveolae.34 We thus next tested whether CAV1 is trafficked correctly and assembles into caveolae in patient cells at the cellular level. Similar densities of caveolae were readily observed in patient and control cells by transmission electron microscopy (P = 0.28) (Figure 4A,B). Consistent with this, using immunofluorescence microscopy, CAV1 staining was observed in punctate structures characteristic of caveolae in both control and patient cells labeled with an N-terminal CAV1 antibody that detects both wild-type and mutant CAV1 (Figure 4C). CAV1 staining also strongly colocalized with caveolin-2 (Figure 4D,E) and the caveolae accessory proteins cavin-1 and EHD2 (Figure 5A-D) in both control and patient cells. However, the colocalization of CAV1 and cavin-1 was slightly albeit significantly reduced in patient cells compared with controls (Figure 5B). PACSIN2 colocalization with CAV1 was low but not significantly different between wild-type and patient cells (Figure 5E,F).
FIGURE 4.

CAV1, CAV2 and caveolae are detectible in patient skin fibroblasts. A, Caveolae are detected in control and patient fibroblasts by transmission electron microscopy. Scale bar, 500 nm. Note that these images represent regions of high caveolae density for illustration purposes and are not representative of average densities of caveolae. B, The patient’s cells contain comparable amounts of caveolae as control cells (P = 0.28, Student t test). A minimum of 25 images collected at 30 000× magnification per experiment were analyzed across three independent experiments for both the control and patient cell lines. C, Representative immunofluorescence images of control and patient fibroblasts labeled with an N-terminally directed CAV1 antibody that detects both wild-type and mutant F160X CAV1. The subcellular distribution of CAV1 in patient cells is similar to control cells. Scale bars, 10 μm. D, Representative images of control and patient cells dually labeled with a CAV1α antibody (epitope = residues 1-24) in red and CAV2 antibody (green in merged image). Scale bars, 10 μm. E, CAV1 and CAV2 exhibit similar levels of colocalization in control and patient fibroblasts as quantified using Pearson’s correlation coefficient (n = 15 ROIs from 2 independent experiments.) n. s., not significant (Student’s t test). CAV, caveolin.
FIGURE 5.

Caveolae accessory proteins are localized correctly in patient skin fibroblasts. A and B, Cavin-1 labeling (red) colocalizes with CAV1α staining (green), albeit at reduced levels in patient cells compared to controls (n = 31 ROIs from 3 independent experiments).*P = 0.012, Student’s t test. C and D, CAV1 (green) and EHD2 (red) colocalize to similar extents in control and patient fibroblasts (n = 21 ROIs from 2 independent experiments). E and F, CAV1α (red) and PACSIN-2 (green) exhibit low levels of colocalization in both control (n = 40) and patient (n = 31) fibroblasts (n = 40 or 31 ROIs from 3 independent experiments). n.s., not significant (Student’s t test). Scale bars, 10 μm. CAV1, caveolin-1; ROI, region of interest.
To further test whether CAV1 is localized normally in patient cells, we performed immunostaining with a C-terminally directed antibody. Typically, the C-terminus of CAV1 is only accessible in the Golgi complex where the protein is not fully oligomerized, and is masked within caveolae.36,37 In agreement with this, we found that this antibody labeling was predominantly restricted to the GM130-labeled Golgi complex in control fibroblasts (Figure 6A, top panel). Strikingly, in patient cells, in addition to Golgi labeling a significant amount of labeling of extra-Golgi puncta was also observed, leading to a drop in the overall level of colocalization of C-terminal CAV1 labeling with GM130 (Figure 6A[bottom panel],B). The staining pattern observed with the C-terminal antibody in patient cells highly colocalized with an N-terminally directed antibody that normally detects CAV1 at the plasma membrane, suggesting that the non-Golgi puncta labeled by this antibody in patient cells are caveolae (Figure 6C,D). As the C-terminal antibody only detects wild-type CAV1 and not the F160X mutant (Figure S2A-D), these findings imply that in patient cells the C-terminus of wild-type CAV1 is accessible at the cell surface, possibly within hybrid caveolae composed of both F160X (which lacks the C-terminal domain) and wild-type CAV1.
FIGURE 6.

The C-terminus of CAV1 is exposed outside of the Golgi complex in patient fibroblasts. A and B, In control fibroblasts, a CAV1Cterm antibody (green) predominantly stains wild-type CAV1 in the Golgi complex (red), whereas in patient cells CAV1Cterm antibody labeling is also observed in punctate structures outside of the Golgi complex. Quantification of colocalization is shown for n = 19 or 20 ROIs from 2 independent experiments. ***P < 0.0001, Student’s t test. C and D, In patient cells, punctate staining by the CAV1Cterm antibody (red) colocalizes with staining by an N-terminally directed CAV1α/βCterm antibody (green). In contrast, no colocalization of the staining patterns by these two CAV1 antibodies is observed in control cells. Quantification of colocalization is shown for n = 14 or 15 ROIs from 2 independent experiments. Scale bars, 10 μm. CAV1, caveolin-1; ROI, region of interest.
To further assess possible differences in the organization of CAV1 oligomers in patient cells, we probed western blots from the BN-PAGE experiments with antibodies against two different regions of CAV1, the oligomerization domain (mAb 2297) and the C-terminus (C-term). Both the F160X mutant and WT CAV1 contain the complete N-terminus and oligomerization domain, and thus theoretically mAb 2297 will be able to detect total CAV1. In contrast, the C-term antibody only detects WT CAV1. Despite this, in patient cells mAb 2297 did not detect the complexes as efficiently as did the C-terminal antibody (compare ratio of red and green signals in the merged images of panels left versus middle and right) (Figure S1). These findings imply that the organization of CAV1 may differ in these oligomeric complexes in the patient cells in a manner that alters accessibility of the oligomerization domain to antibody labeling.
2.5 F160X is capable of forming putative caveolae either independently or in combination with wild-type CAV1 in a reconstituted system
To directly test whether wild-type and CAV1 F160X are capable of coassembling to form caveolae, we carried out reconstitution studies in CAV1−/− MEFs. Re-expression of wild-type CAV1 into this cell line supports caveolae formation.20,38 The presence of caveolae at the cellular level can be assayed by monitoring colocalization of endogenous cavin-1 with exogenous CAV1 in punctae. This is because cavin-1 is only recruited newly formed caveolae and otherwise does not associate with the plasma membrane in the absence of CAV1.20 It has further been shown that cavin-1 only associates with membranes of invaginated caveolae and not with flattened CAV1 membrane domains using FRET and electron microscopy.20 We therefore used cavin-1/CAV1 colocalization as a reporter of caveolae formation.37,39–42
We first tested whether CAV1 F160X is capable of recruiting cavin-1 in the absence of wild-type CAV1. Consistent with this possibility, when we expressed epitope tagged CAV1 F160X in these cells, we observed the formation of punctate structures that costained for endogenous cavin-1, similar to the behavior of wild-type CAV1 (Figure 7A-C). Thus, CAV1 F160X itself has the propensity to form putative caveolae. We did note however that CAV1 F160X did not colocalize as strongly with cavin-1 as did WT CAV1 despite similar expression levels of endogenous cavin-1 protein (Figure 7D,E).
FIGURE 7.

Reconstitution of caveolae formation by CAV1 F160X in CAV1−/− MEFs. A-C, Representative images showing colocalization of endogenous cavin-1 (red) with (A) wild-type Myc-CAV1 (green), (B) wild-type HA-CAV1 (green) or (C) HA-CAV1 F160X (green) in transfected CAV1−/− MEFs. Anti-Myc or anti-HA antibodies were used to label CAV1 constructs. D, Quantification of colocalization shows that HA-CAV1 F160X (n = 163 ROIs) colocalizes less well with endogenous cavin-1 than does wild-type HA-CAV1 (n = 25 ROIs) or Myc-CAV1 (n = 157 ROIs). These results represent data acquired from 3 independent experiments. ***P < 0.001, Student’s t test. E, Western blot of transfected CAV1−/− MEFs probed with antibodies to detect endogenous cavin-1 and beta-tubulin as a control for equal loading. F and G, Representative live cell images showing colocalization of mCherry-cavin-1 (red) with (F) wild-type mEmerald-CAV1 (green) or (G) mEmerald-F160X (green) in transfected CAV1−/− MEFs. Note that mCherry-cavin-1 staining is weak in some regions where mEmerald-F160X spots are visible in this image due to the thinness of the cell at this location. H, Wild-type mEmerald-CAV1 strongly colocalizes with mCherry-cavin-1 in CAV1−/− MEFs. In contrast, mEmerald-F160X displayed much less colocalization with mCherry-cavin-1 (n = 51-81 ROIs from 3 independent experiments) (***P < 0.0001, Student’s t test). Scale bars, 10 μm. I, Cotransfected Myc-CAV1 (green) and HA-CAV1 (red) colocalize with each other and with endogenous cavin-1 (cyan) in triple labeled CAV1−/− MEFs. J, Cotransfected Myc-CAV1 (green) and HA-CAV1 F160X (red) colocalize with each other and with endogenous cavin-1 (cyan) in CAV1−/− MEFs. K, Wild-type HA-CAV1 and HA-CAV1 F160X both strongly colocalize with wildtype Myc-CAV1 in CAV1−/− MEFs (n = 114-118 ROIs from 3 independent experiments) (n.s., not significant, Student’s t test). L, In CAV1−/− MEFs coexpressing wild-type and mutant CAV1, endogenous cavin-1 colocalizes less well with HA-CAV1 F160X than with Myc-CAV1 (**P = 0.0013, Student’s t test). In contrast, endogenous cavin-1 colocalizes equally well with wild-type Myc-CAV1 and HA-CAV1 in coexpressing cells (n.s., Student’s t test). Scale bars, 10 μm. CAV1, caveolin-1; MEF, murine embryonic fibroblasts; ROI, region of interest.
Previous studies have shown that FRET can be observed between CAV1 and cavin-1 in caveolae.20,39 Thus, to further test for possible defects in the recruitment of cavin1 to CAV1 F160X, we attempted to set up a confocal FRET experiment between mEmerald-tagged CAV1 constructs and mCherry-tagged cavin1. Because the F160X mutation impacts the C-terminus of CAV1, we utilized N-terminally tagged CAV1 constructs for these studies. In control studies, we first verified that the mEmerald-CAV1 construct was not trapped in the perinuclear region of Cav1−/− MEFs, unlike some other tagged CAV1 constructs are when overexpressed in this cell type.43 Next, we coexpressed either mEmerald-CAV1 or mEmerald-CAV1 F160X with mCherry-cavin-1. As expected, mEmerald-CAV1 and mCherry-cavin-1 strongly colocalized in cell surface puncta (Figure 7F). mEmerald-CAV1 F160X was poorly expressed, but in cells where it was present it was found in punctate structures. However, these structures had a different appearance than those observed in cells expressing WT mEmerald-CAV1 (Figure 7G). Moreover, they were essentially devoid of either mCherry-cavin-1 or endogenous cavin-1 staining (Figures 7G,H and S3). Thus, an even more profound defect in cavin-1 recruitment was observed for mEmerald-CAV1 F160X than for epitope tagged CAV1 F160X. Given these dramatic findings, we did not pursue FRET experiments further.
As CAV1 F160X is coexpressed with wild-type CAV1 in heterozygous patient cells, we also performed coexpression studies in CAV1−/− MEFs. As expected, coexpressed versions of HA- and myc-tagged wild-type CAV1 strongly colocalized with each other (Figure 7I,K) and with cavin-1 (Figure 7I,L). When coexpressed, myc-CAV1 WT and HA-CAV1 F160X also colocalized both with each other (Figure 7J,K), with endogenous cavin-1 (Figure 7J,L), and with the C-terminal CAV1 antibody (Figure S2E-G). This finding supports a model in which wild-type CAV1 and CAV1 F160X coassemble to form hybrid caveolae. However, CAV1 F160X colocalized with endogenous cavin-1 to a lesser extent than did wild-type CAV1 (Figure 7L). This again suggests that cavin-1 may not be recruited as strongly to the plasma membrane when CAV1 F160X is present, similar to the results obtained in patient cells (Figure 5B).
Next, we asked whether CAV1 F160X associates with DRMs in reconstituted cells. DRM analysis of CAV1−/− MEFs extracted with 0.5% Triton X-100 confirmed the association of CAV1 F160X with DRMs both when expressed individually and when coexpressed with wild-type CAV1 (Figure 8). This is consistent with the results obtained in human skin fibroblasts extracted in 0.5% Triton X-100, where CAV1 associated with DRMs in both the mutant and control cell lines (Figure 3D). However, the DRM fractionations for the CAV1−/− MEFs were much more sensitive to the number of cells used. This made it difficult to identify detergent extraction conditions that could detect differences in the detergent resistance of wild-type and F160X CAV1 in the reconstituted MEFs. We also found that most of the endogenous CAV2 in the CAV1−/− MEFs could not be recruited to DRMs when CAV1 was expressed, even for the case of wild-type CAV1 (Figure 8). This is probably because CAV2 is trapped in Golgi complex when CAV1 is not expressed,44 and thus is unavailable to form complexes with newly synthesized exogenous CAV1.
FIGURE 8.

CAV1 F160X cofractionates with detergent resistant membranes isolated using 0.5% Triton X-100 in reconstituted CAV1−/− MEFs. DRMs were isolated from CAV1−/− MEFs transiently transfected with (A) Myc-CAV1, (B) HA-CAV1 F160X or (C) Myc-CAV1 and HA-CAV1 F160X. Fractions were analyzed by SDS-PAGE/western blotting. Fractions enriched in DRMs are indicated with the red lines. Data are representative of 2 independent experiments. CAV1, caveolin-1; MEF, murine embryonic fibroblasts.
2.6 Reconstituted F160X/CAV1 complexes display decreased stability
As the CAV1 complexes in patient cell displayed defects in the stability of 8S and 70S complexes (Figure 3B,C), we conducted corresponding tests on reconstituted cells. We found that CAV1 F160X itself can form both 8S and 70S complexes in CAV1−/− MEFs (Figure 9B). However, compared with WT CAV1, more CAV1 F160X was found in lower molecular weight complexes (Figure 9A,B). This defect was rescued by coexpressing CAV1 F160X with WT CAV1 (Figure 9C). We also tested the stability of the complexes by dissolving the 70S complexes with SDS-containing lysis buffer (0.2% Triton X-100 + 0.4% SDS) following the approach of Hayer et al17 (Figure 9D-F). Whereas wild-type CAV1 accumulated in the form of 8S complexes under these conditions (Figure 9D), CAV1 F160X was dissolved to structures smaller than 8S (Figure 9E). Interestingly, the F160X/CAV1 coexpressing cells displayed an intermediate phenotype (Figure 9F). These findings are in good agreement with the findings in patient cells and suggest that the far end of the CAV1 C-terminus is very important for the stability of CAV1 complexes.
FIGURE 9.

Reduced stability of CAV1 complexes containing CAV1 F160X in reconstituted CAV1−/− MEFs. CAV1−/− MEFs expressing (A, D) Myc-CAV1, (B, E) HA-CAV1 F160X or (C, F) HA-CAV1 F160X and Myc-CAV1 were lysed in either 0.5% Triton X-100 (A-C) or 0.2% Triton X-100 and 0.4% SDS (D-F) at room temperature. Extracts were run though 10%-40% sucrose velocity gradients and fractions were analyzed by SDS-PAGE followed by western blotting. In panels D-F, the proportion of CAV1 in each fraction was quantified by densitometry, and the values for the first 6 fractions are show in line charts below each corresponding western blot dataset. Data are representative of 2 independent experiments. CAV1, caveolin-1; MEF, murine embryonic fibroblasts.
2.7 Caveolae confer mechanoprotection against hypo-osmotic shock in patient cells
Caveolae are now widely recognized for their role as membrane buffers during times when cells are under mechanical stress and cells lacking caveolae are more vulnerable to injury under high mechanical tension.40–42 Although the abundance of caveolae was normal in patient cells (Figure 4), we wanted to determine if the presence of CAV1 F160X impacted the ability of caveolae to function as mechanical buffers in patient cells. To address this question, cells were incubated in hypotonic medium to induce osmotic swelling and recapitulate mechanical stress (Figure 10).
FIGURE 10.

Caveolae confer mechanoprotection in patient fibroblasts. A, Representative images of control and patient human skin fibroblasts before and after 10 minutes of hypo-osmotic shock. The images were deliberately saturated to enable quantification of the numbers of live (green) and dead (red) cells. Bar, 10 μm. B, Quantification of cell viability. Bars show the mean ± standard deviation from 3 independent experiments. There is no significant difference between the control and patient cell line in either iso-osmotic (P = 0.16) or hypo-osmotic (P = 0.55) conditions.
Cell viability was determined to assess the ability of cells to survive osmotic swelling. Before treatment, the vast majority of cells were viable and had a normal cellular morphology (Figure 10A). Following 10 minutes of osmotic swelling, the number of live cells decreased; however, loss of viability was similar in patient and control cells (Figure 10B). These results indicate that presence of the mutant CAV1 does not compromise the ability of caveolae to function in mechano-protection, at least under the conditions of these experiments.
3 DISCUSSION
In the current study, we identified and characterized a F160X mutation in CAV1 in a patient with both PAH and CGL. The F160X CAV1 mutation is predicted to give rise to a truncated protein missing nearly 20 amino acids of the C-terminus. Although recent studies have independently identified this mutation in this patient,4,16 the effects of the expression of this mutant protein on caveolae formation and function are not yet fully understood. Using a combination of biochemical approaches, immunofluorescence microscopy and electron microscopy, we show here that the fundamental building blocks of caveolae are in place and are capable of forming hybrid caveolae in patient skin fibroblasts.
To complement our studies in patient cells, we also assayed the ability of CAV1 F160X to form caveolae in reconstituted CAV1−/− MEFs by testing whether it can recruit cavin1 to cell surface puncta. The results of these studies suggest that the mutant protein can drive caveolae formation both on its own and when coexpressed with wild-type CAV1, further supporting our findings in the patient cells (summarized in Figure 11A). The observation that CAV1 F160X itself can form putative caveolae is in line with a recent report showing that a C-terminal truncation mutant of CAV1 (Cav1-(1-147)) is capable of generating heterologous caveolae in a model prokaryotic expression system.40 A potential caveat of using colocalization of CAV1 and cavin-1 as a readout of caveolae formation is that this method does not provide information regarding the morphology of caveolae. Thus, further work will be required to determine whether the putative caveolae formed by heterologous expression of F160X exhibit any morphological defects.
FIGURE 11.

Working model for how CAV1 F160X impacts caveolae assembly and stability. A, Like wild-type CAV1, CAV1 F160X is capable of supporting caveolae formation when expressed on its own. In heterozygous patient cells, CAV1 F160X forms hybrid caveolae with wild-type CAV1. B, The C-terminus of wild-type CAV1 is normally masked in caveolae due to interactions of adjacent C-termini of CAV1 with one another. However, the absence of the C-terminus of CAV1 F160X exposes the C-terminus of wild-type CAV1, making it accessible to detection by antibodies. C, CAV1 F160X can form both 8S and 70S complexes, but these complexes are destabilized compared to those formed by wildtype CAV1. CAV1, caveolin-1.
Despite the presence of caveolae in patient fibroblasts, several of their features were altered relative to those found in control cells. First, the degree of colocalization of cavin1 and CAV1 was reduced in both patient cells and reconstituted CAV1−/− MEFs (Figure 11A). This phenotype was especially dramatic in CAV1−/− MEFs coexpressing mEmerald CAV1 F160X and mCherry-cavin-1; under these conditions, essentially no colocalization of cavin-1 with CAV1-positive puncta was observed. Although cavin-1 is known to be an important CAV1 accessory protein that is essential for caveolae formation, the exact mechanisms by which CAV1 and cavin-1 interact are still unknown.24 Our current findings suggest that the far end of the CAV1 C-terminus participates in this interaction. We also found that the C-terminus epitope of CAV1, which is normally masked after exiting the Golgi complex,36 was readily accessible in punctate structures at the cell surface. We speculate that the absence of C-terminus of the mutant protein may allow for recognition of the C-terminus of wild-type CAV1 within caveolae, which would normally be masked as a result of interactions with other C-termini (Figure 11B). The formation and/or stability of 70S complexes also appeared to be reduced in patient cells, as evidenced by the increased fraction of 8S complexes. This may reflect a requirement for the C-terminus in homotypic interactions of CAV1 within 70S complexes.28 We further found that the 8S complexes formed by CAV1 F160X in both reconstituted CAV1−/− MEFs and patient cells were readily disassembled into smaller oligomers in the presence of SDS (Figure 11C). This suggests that the C-terminus of CAV1 is not only important for interactions between adjacent homo-oligomers of CAV1, but also important for the stability of the 8S CAV1 homo-oligomer itself. Finally, CAV1 was also less detergent resistant in patient cells than in control cells. Although the cause of this shift in detergent resistance is currently unknown, similar results were reported in studies of C-terminal deletion mutants of CAV1.28 It is possible that this is a consequence of changes in the lipid or protein composition of caveolae, or even the plasma membrane itself. Further work will be required to test these possibilities.
Caveolae are thought to function as a cellular buffering system to provide protection from stresses that perturb membrane tension in vitro.40–42 This idea was recently tested in vivo in endothelial cells of the lung and cardiac muscle in mice under treatments to increase cardiac output and shear stress, conditions often associated with PAH and cardiovascular diseases.40 Here, we tested this hypothesis directly in skin fibroblasts from a patient with PAH and CGL. We found that patient cells showed similar responses to controls under conditions that induced acute mechanical stress on the plasma membrane via a hypo-osmotic shock (Figure 10). Thus, incorporation of CAV1 F160X into the patient’s caveolae does not significantly disrupt the functional capacity of caveolae as membrane buffers. However, it remains formally possible that defects in mechanoprotection may be more apparent under other conditions or in other cell types. Whether the expression of F160X impacts other caveolae functions will require further examination in future work.
While these studies were in progress, two other groups identified a F160X mutation in CAV1 in a patient presenting with both PAH and CGL.4,16 Through informed consent, the family of this patient confirmed that the same patient was studied in all three investigations. It is thus interesting to directly compare the results of each study. In the first study,4 close to wild-type numbers of caveolae were observed in patient skin fibroblasts by electron microscopy. However, immunofluorescence staining using an N-terminally directed antibody revealed substantially decreased CAV1 labeling in patient fibroblasts, leading the authors to conclude that the caveolae may being formed in a CAV1-independent manner.4 In the second study,16 CAV1 protein levels were analyzed by western blotting and shown to be less than 50% of control values. Immunofluorescence analysis of patient skin fibroblasts using an antibody directed against an internal epitope of CAV1 (residues 34-45) detected CAV1 in puncta. Thus, all three studies reported differential staining of CAV1 in control and patient cells by immunofluorescence, using different combinations of antibodies and labeling conditions. Because the epitope accessibility on CAV1 is known to be heavily dependent on the protein conformation and oligomerization state,36,41,43 this strongly suggests that one or more of these factors are altered in patient cells. Furthermore, the decreased colocalization of cavin-1 and CAV1 in patient cells observed both in our study and in a previous report16 suggests the affinity of cavin-1 for caveolae is decreased in cells expressing the F160X CAV1 mutant, a result we went on to confirm in reconstituted CAV1−/− MEFs. Thus, several key findings have been reproduced across laboratories. Importantly however, in the current study, we have now greatly extended our knowledge about this mutation through our detailed biochemical analysis, reconstitution studies, and functional studies.
It is striking that the F160X mutation is linked to both lipodystrophy and PAH while other CAV1 mutations appear to only correlate with the development of either PAH3 or lipodystrophy.14,15 Why this is the case is not yet entirely clear. It has been shown that reduced caveolae formation disrupts endothelial cell and adipose tissue function. Based on our biochemical findings, we speculate that CAV1 F160X may contribute to both diseases by several potential mechanisms. First, changes in the stability of CAV1 oligomers and/or changes in CAV1 organization within caveolae could potentially lead to cellular defects in endothelial cells and adipocytes that promote PAH and CGL. Such changes might impact the ability of caveolae to function as membrane reservoirs, a mechanism that appears to be important in endothelial cells as well as other cell types.2,39,42,45 Although we did not observe significant defects in mechanoprotection in patient skin fibroblasts, they may occur in other cell types or in under more physiological challenges. Changes in the stability of CAV1 oligomers or the organization of CAV1 within caveolae could also potentially alter caveolae dynamics linked to fluctuations in lipid storage in adipocytes.46 Animal models displaying lipodystrophic- and PAH-like disorders have also been shown to be the result of significantly decreased levels of CAV1 expression.47–50 It is thus also possible that changes in CAV1 expression in adipocytes, endothelial cells, smooth muscle cells or other tissues not examined here may contribute to the development of lipodystrophy and PAH in this patient.
Another interesting possibility that arises from our findings is that the diminished association of cavin-1 with CAV1 in patient cells is related to the development of CGL and/or PAH. CAVIN1 has been repeatedly identified as a CGL associated gene7–13 and has recently been shown to function in the control of ribosomal RNA transcription in adipocytes.51 Cavin-1 is also involved in the mechanical stress response of caveolae.42 This suggests that a common CAV1-Cavin1-dependent pathway, perhaps one regulated by the assembly and disassembly of caveolae, may be disrupted in patients with CGL. Additional predisposing mutations may also contribute to the pathophysiology of one or both diseases. For example, mutations in AGPAT2 and LPIN1 were hypothesized to contribute to the development of CGL in a patient with an F160X mutation.16 Whether these variants are truly pathogenic or contributory remains to be determined.
In conclusion, our work adds to the breadth of knowledge of known human phenotypes associated with CAV1 mutations and suggests that the development of lipodystrophy and PAH in the context of a F160X mutation is not the result of the loss of production of CAV1 and caveolae per se but instead may be linked to decreased stability of CAV1 oligomers and/or weakened interactions between cavin-1 and CAV1 in caveolae. Future investigation is needed to understand the varied presentation of disease and differential impact on multiple organ systems of in patients with CAV1 mutations.
4 MATERIALS AND METHODS
Informed consent was provided for all the studies presented, and the study was approved by the Institutional Review Board of Columbia University. The patient’s family verified that this patient is the same one identified in two previous studies.4,16
4.1 Whole exome sequencing analysis
Whole exome sequencing data generation, data analysis, variant filtering and Sanger sequencing confirmation were performed as previously described.3
4.2 Materials and reagents
Complete, ethylenediaminetetraacetic acid (EDTA)-free protease inhibitor cocktail tablets were purchased from Roche. RIPA cell lysis buffer, and phosphatase inhibitor cocktail 2 and 3 were purchased from Sigma-Aldrich. ProLong Gold Antifade Mountant and Lipofectamine 2000 transfection reagent were purchased from Life Technologies. DRAQ5 far-red nuclear stain was purchased from Cell Signaling Technology.
4.3 Antibodies
Caveolin-1 (pAB #610060, 2234 #610494 and 2297 #610406), caveolin-2 (#610684) and GM130 (#610822) antibodies were purchased from BD Biosciences (Table 2). Caveolin-1 C-term [E249] (ab32577), PTRF/Cavin1 (ab48824) and EHD2 (ab23935) antibodies were purchased from Abcam. The PACSIN2 (AP088b) antibody used was purchased from Abgent. Alexa-fluor dye-conjugated secondary antibodies were purchased from Life Technologies. A c-Myc (A-14) antibody was purchased from Santa Cruz Biotechnology. HA-Tag (6E2) and Myc-Tag (9B11) antibodies used were purchased from Cell Signaling Technology.
TABLE 2.
Caveolin-1 antibodies used in this study1
4.4 Cell culture
Skin biopsy specimens were obtained via a sterile 3-mm-punch skin biopsy technique from the patient and primary skin fibroblasts isolated as described previously.3 Healthy control primary skin fibroblasts derived from skin biopsies were previously described.3 Cells were cultured using standard methods in Dulbecco’s Modified Eagle Medium (DMEM) (4.5g/L glucose, l-glutamine and sodium pyruvate) supplemented with 20% heat-inactivated fetal bovine serum (FBS), 1% penicillin-streptomycin and 1% l-glutamine from Invitrogen. CAV1−/− MEFs cells were obtained from ATCC and cultured in DMEM (with 4.5 g/L glucose, l-glutamine and sodium pyruvate) supplemented with 10% FBS. All the cultures were maintained at 37° C in an atmosphere of 5% CO2 in air with 95% relative humidity. Lipofectamine 2000 was used for all transfections according to the manufacturer’s protocol.
4.5 Plasmids
Caveolin-1-mEmerald N10 (Addgene No. 54026) and mEmerald-Caveolin-1 C-10 (Addgene No. 54025) were gifts from Dr Mike Davidson and used to generate constructs for the current study as detailed below. A pCMV-HA-N (No. 82017) empty vector plasmid DNA was used to generate HA-tagged constructs (ThermoFisher Scientific). Restriction enzymes were purchased from New England Biolabs.
Myc-CAV1 was generated by GenScript USA Inc. Briefly, in order to generate an N-terminally Myc-tagged CAV1, an oligo encoding the Myc-tag sequence (5′-GAACAGAAACTGATTAGCGAAGAAGATCTG-3′ ) was inserted upstream of wild-type human CAV1 coding region in a CAV1-mEmerald N-10 construct that had been mutated to terminate reading for the mEmerald fusion protein (5′-GCAGAAAGAAA-TATAGCTCCGGAGGGG-3′ ). Site-directed mutagenesis (5′ - CACCGCCACCATGGAACAGAAAC-3′) was then performed to insert an initiator methionine before the Myc-Tag sequence.
To generate a HA-CAV1 construct, Caveolin-1-mEmerald N10 was digested with BglII and EcoRI restriction enzymes to excise the CAV1 encoding fragment that was ligated to the pCMV-HA-N vector (Thermo Scientific) that had been linearized with BamHI and EcoRI restriction enzymes. Site-directed mutagenesis was used to insert a nucleotide in the linker region between the HA-tag and CAV1 coding sequence in HA-CAV1WT in order to put CAV1 in frame for proper translation (5′-GCTAGCCACCGCCACC3-′ ).
To generate an HA-CAV1 F160X construct, the patient frame-shift mutation (c.479-480ΔTT/p.F160X) was first introduced into wild-type mEmerald-Caveolin-1 C-10 construct by site-directed mutagenesis (5′ -GACCCACTCTGAAGCTGTTG-3′). The CAV1 F160X-coding fragment of mEmerald-CAV1 F160X product was then cut out of the mEmerald C-10 vector backbone with BglII and EcoRI and subcloned into the pCMV-HA-N destination vector that had been digested and linearized with BamHI and EcoRI. Site-directed muta-genesis was used to insert a nucleotide in the linker region between the HA-tag and CAV1 coding sequence in HA-CAV1 F160X in order to put CAV1 in frame for proper translation (5′-CTCGAGG-GATTCTGGCAGC-3′).
To generate a mCherry-cavin-1 construct, cavin-1 was amplified from human skin fibroblast cells and inserted into pmCherry-C1 through XhoI and BamHI (XhoI_F: 5′ -TAGGATCTCGAGCTATGGAG-GACCCCACGCTC-3′; BamHI_R: 5′-ATATATGGATCCT-CAGTCGCTGTCGCTCTTG-3′ ) using a SLIC cloning protocol.54
4.6 Immunofluorescence microscopy
Cells were plated on No. 1.5 glass coverslips, and allowed to adhere for 24-48 hours. Coverslips were fixed in 4% paraformaldehyde (PFA) for 15 minutes at room temperature, washed and blocked for an hour in 1% BSA, 5% glycerol, 0.1% glycine, 0.04% sodium azide, 0.01% saponin and 5% normal sera (IF buffer). Cav1 N-term polyclonal (1:300), anti-Cav1 clone 2234 (1:50), Cav2 monoclonal (1:50), C-term rabbit monoclonal (1:50), Cav2 rabbit monoclonal (1:50), Cavin1/PTRF polyclonal (1:100), EHD2 goat polyclonal (1:250), GM130 (1:100) and β-tubulin monoclonal (1:100) primary antibodies were diluted in IF blocking buffer, and incubated from 1 to 24 hours and washed. For incubations longer than 1 hour, coverslips were placed in a humid chamber and incubated at 4° C. Alexa Fluor-conjugated secondary antibodies (1:500; Thermo-Fisher Scientific) were diluted in IF blocking buffer containing 1:1000 DRAQ5 far-red nuclear stain (Cell Signaling Technology) if the far-red channel was not used to image an immunostained protein, and incubated for 1 hour at room temperature while protected from light. Following secondary incubation, coverslips were washed and mounted with Prolong Gold Antifade mounting agent. Slides were imaged on a Zeiss LSM510 inverted confocal laser-scanning microscope. Images were acquired using a 100× 1.4 N/A Plan Apochromat DIC oil objective. Argon, HeNe1, and HeNe2 lasers were used to excite Alexa-fluor 488, 546 and 633/647, respectively.
4.7 Colocalization analysis
Colocalization analysis was performed using Macbiophotonics ImageJ and "Intensity Correlation Analysis" plugin using a semi-automated procedure. Analysis was performed on 4× zooms collected at 22.5 μm × 22.50 μm. A region of interest (ROI) containing the cell was manually defined on each image and only the ROI was used for colocalization analysis. For each set of comparisons, at least 30 images were used for measurement from at least 3 independent experiments, unless stated otherwise in the figure legends. Pearson’s correlation coefficients are reported as the mean ± standard deviation for all the ROIs. A Student’s t test was used to calculate P-values.
4.8 Transmission electron microscopy
Cells were grown to confluency in 10-cm culture plates, washed in 0.1 M Cacodylate buffer, fixed in 2.5% gluteraldehyde diluted in 0.1 M Cacodylate buffer and stored at 4° C. Thereafter, fixed cells were scraped, pelleted, postfixed in osmium tetroxide, stained with uranyl acetate en bloc to enhance membrane contrast and epon embedded. Blocks were thin-sectioned and counter-stained with lead citrate. Images were acquired on a Philips/Tecnai FEI T-12 transmission electron microscope operated at 80 kV at 30 000× magnification. Control and patient fibroblasts were imaged in at least 3 independent experiments.
4.9 Western blotting
Whole cell lysates were generated from control and patient primary human skin fibroblasts cultured to confluence in 15 cm tissue culture dishes (Corning) or transfected CAV1−/− MEFs. Once confluent or 24 hours posttransfection, cultures were chilled on ice for 5 minutes and washed three times in phosphate-buffered saline (PBS) from Corning. Cells were lysed with 0.5 mL of 50 mM Tris-HCl, pH 8.0, 150 mM, 1.0% Igepal Ca-630 (NP-40), 0.5% sodium deoxycholate, 0.1% SDS plus phosphatase inhibitors from (Sigma-Aldrich) and protease inhibitors (Roche). Following a 5-min incubation on ice, the lysed cells were scraped and transferred to new tubes. To clear the lysates, the samples were flash frozen in liquid nitrogen and allowed to thaw at room temperature. Thawed lysates were spun at 13 000 rpm at 4° C for 10 minutes to pellet the debris. The protein concentration of supernatant was quantified with BCA protein assay (Thermo Scientific Pierce). Equal amounts of protein from each sample were mixed with reducing reagent and loading buffer (Life Technologies) and boiled for 10 min.
SDS-PAGE was conducted using the Novex NuPAGE SDS-PAGE Gel System (Life Technologies). NuPAGE 4% to 12% and 4% to 20% Bis-Tris gels (Life Technologies) were used for the protein separation. SeeBlue Prestained Protein was used to evaluate the molecular weight. The Bio-Rad Mini-PROTEAN System and 12% tris-glycine gels were used for transfected CAV1−/−MEFs. A Mini Trans-Blot Electrophoretic Transfer Cell (Bio-Rad) was used for the electrophoretic transfer. The PVDF membranes (Millipore) were destained with methanol. Secondary antibodies and blocking buffer were obtained from LI-COR and imaging was performed using the LI-COR Odyssey system. Densitometry analysis was conducted using ImageJ software (http://fiji.sc/Fiji).
4.10 Blue native-PAGE
BN-PAGE was performed as recently described.34 Briefly, BN-PAGE was conducted by using the NativePAGE Bis-Tris Gel System (Life Technologies). Cell lysis buffer (NativePAGE 1× sample buffer, complete protease inhibitor cocktail from Roche and 1% digitonin) was made according to the NativePAGE Sample Prep Kit’s manual book. Fibroblast cells were lysed at 4° C for 30 min. Then, a 30-min centrifugation at 16 100g (centrifuge 5415D, Eppendorf ) was performed at 4° C. The pellet was discarded and the supernatant was used for further analysis. Protein concentrations were determined by using a BCA Assay Kit from Thermo Scientific. NativePAGE gels (Life Technologies) of 4% to 16% were used for the protein separation. Equal amounts of protein were loaded on the same gel as determined by BCA (10 μg for each lane). NativeMark unstained protein standards (Life Technologies) were used to evaluate the molecular weight.
4.11 Velocity gradient centrifugation isolation of 8S and 70S complexes
Velocity gradient centrifugation was performed as recently described.34 Briefly, about 1 × 10⁶ fibroblasts or 4 × 10⁶ CAV1−/− MEFs were lysed at room temperature for 20 min in 330 μL of 0.5% Triton-X-100 in Tris NaCl EDTA buffer (TNE) (100 mM NaCl, 20 mM Tris-HCl, pH 7.5 and 5 mM EDTA) buffer, supplemented with ‘Complete’ protease inhibitors cocktail (Roche). Postnuclear supernatants (PNSs) were prepared by a 5-min centrifugation at 1100g. Three hundred microliters of the PNSs was loaded onto linear 10% to 40% sucrose gradients containing 0.5% Triton-X-100, 20 mM Tris-HCl, pH 7.5, 100 mM NaCl, 5 mM EDTA and protease inhibitors cocktail. After centrifugation in an SW55 rotor (Optima™ LE-80K Ultracentrifuge; Beckman) for 5 hours at 48 000 rpm (279 232.1g) at 4° C, fourteen 360-μL fractions were collected from the top to the bottom and analyzed by SDS-PAGE/western blot with an equal loading volume. Western blots were imaged and quantified as indicated above.
4.12 Preparation of DRM fractions
Preparation of DRM fractions was performed as recently described.34 Briefly, about 1 × 10⁶ fibroblast cells or 1.6 × 10⁷ CAV1−/− MEFs were suspended in 300 μL of cold 0.5% (or 1%) Triton-X-100 in TNE (100 mM NaCl, 20 mM Tris-HCl, pH7.5 and 5 mM EDTA buffer), supplemented with ‘Complete’ protease inhibitors cocktail (Roche). Homogenization was performed in a cold room using precooled equipment by passing the cell solution 10 times through a 1-mL syringe with a 27 gauge stainless steel needle (BD Biosciences). The homogenate was adjusted to about 40% sucrose by the addition of 700 μL of 60% sucrose prepared in TNE and placed at the bottom of an ultracentrifuge tube. A 5% to 35% linear sucrose gradient was formed above the homogenate and centrifuged at 40 100 rpm (194 882g) and 4° C for 16 hours in a SW55 rotor (Optima LE-80K Ultracentrifuge; Beckman). Fourteen 360 μL fractions were collected from the top and analyzed by SDS-PAGE/western blotting with an equal loading volume. Western blots were imaged and quantified as indicated above.
4.13 Osmotic swelling and cell viability experiments
Cells were plated in MatTek dishes at 60% confluence 2 days prior to the experiment. The growth medium was removed and replaced with 2 mL of 0.1× hypotonic serum-free DMEM medium (10-fold dilution in water) and incubated at 37° C for 10 min. The hypotonic medium was carefully removed and then cell viability was assessed using LIVE/DEAD Viability/Cytotoxicity kit (Molecular Probes; Invitrogen Detection Technologies) as directed by the manufacturer protocol. Twelve fields of cells were analyzed at 10× magnification for each cell line. Confocal images were acquired using the previously mentioned inverted Zeiss LSM 510 confocal microscope (Plan-NEOFLUAR 10×/0.3 objective). Calcein AM-positive live cells (green) and ethidium homodimer-1-positive dead cells (red) were counted using ImageJ software. A Student’s t test was used to analyze the data with GraphPad Prism 7.0 software; values reported are the mean ± the standard deviation of three replicate experiments.
Supplementary Material
ACKNOWLEDGEMENTS
We thank the patient and her family for their generous contribution. We thank Kimberly Drake for expert technical assistance and Angie Deng for help with cell culture and transfections. This study was supported by NIH R01 HL111259 and NIH R01 GM106720 to AKK. Experiments were performed in part through the use of the VUMC Cell Imaging Shared Resource (supported by NIH grants CA68485, DK20593, DK58404, DK59637 and EY008126). The funding sources had no role in the study design, collection, analysis or interpretation of data, writing the report or the decision to submit the paper for publication.
Funding information
NIH, Grant/Award number: R01 HL111259, NIH R01 GM106720, CA68485, DK20593, DK58404, DK59637 and EY008126.
Footnotes
The Editorial Process File is available in the online version of this article.
SUPPORTING INFORMATION
Additional Supporting Information may be found online in the supporting information tab for this article.
REFERENCES
- 1.Pilch PF, Liu L. Fat caves: caveolae, lipid trafficking and lipid metabolism in adipocytes. Trends Endocrinol. Metab. 2011;22:318–324. doi: 10.1016/j.tem.2011.04.001. [DOI] [PMC free article] [PubMed] [Google Scholar]
- 2.Parton RG, del Pozo MA. Caveolae as plasma membrane sensors, protectors and organizers. Nat. Rev. Mol. Cell Biol. 2013;14:98–112. doi: 10.1038/nrm3512. [DOI] [PubMed] [Google Scholar]
- 3.Austin ED, Ma L, LeDuc C, et al. Whole exome sequencing to identify a novel gene (caveolin-1) associated with human pulmonary arterial hypertension. Circ. Cardiovasc. Genet. 2012;5:336–343. doi: 10.1161/CIRCGENETICS.111.961888. [DOI] [PMC free article] [PubMed] [Google Scholar]
- 4.Garg A, Kircher M, Del Campo M, Amato RS, Agarwal AK. Whole exome sequencing identifies de novo heterozygous CAV1 mutations associated with a novel neonatal onset lipodystrophy syndrome. Am. J. Med. Genet. A. 2015;167:1796–1806. doi: 10.1002/ajmg.a.37115. [DOI] [PMC free article] [PubMed] [Google Scholar]
- 5.Cohen AW, Razani B, Schubert W, et al. Role of caveolin-1 in the modulation of lipolysis and lipid droplet formation. Diabetes. 2004;53:1261–1270. doi: 10.2337/diabetes.53.5.1261. [DOI] [PubMed] [Google Scholar]
- 6.Ariotti N, Parton RG. SnapShot: caveolae, caveolins, and cavins. Cell. 2013;154(704-704):e701. doi: 10.1016/j.cell.2013.07.009. [DOI] [PubMed] [Google Scholar]
- 7.Ardissone A, Bragato C, Caffi L, et al. Novel PTRF mutation in a child with mild myopathy and very mild congenital lipodystrophy. BMC Med. Genet. 2013;14:89. doi: 10.1186/1471-2350-14-89. [DOI] [PMC free article] [PubMed] [Google Scholar]
- 8.Dwianingsih EK, Takeshima Y, Itoh K, et al. A Japanese child with asymptomatic elevation of serum creatine kinase shows PTRF-CAVIN mutation matching with congenital generalized lipodystrophy type 4. Mol. Genet. Metab. 2010;101:233–237. doi: 10.1016/j.ymgme.2010.06.016. [DOI] [PubMed] [Google Scholar]
- 9.Hayashi YK, Matsuda C, Ogawa M, et al. Human PTRF mutations cause secondary deficiency of caveolins resulting in muscular dystrophy with generalized lipodystrophy. J. Clin. Invest. 2009;119:2623–2633. doi: 10.1172/JCI38660. [DOI] [PMC free article] [PubMed] [Google Scholar]
- 10.Rajab A, Straub V, McCann LJ, et al. Fatal cardiac arrhythmia and long-QT syndrome in a new form of congenital generalized lipodystrophy with muscle rippling (CGL4) due to PTRF-CAVIN mutations. PLoS Genet. 2010;6:e1000874. doi: 10.1371/journal.pgen.1000874. [DOI] [PMC free article] [PubMed] [Google Scholar]
- 11.Shastry S, Delgado MR, Dirik E, Turkmen M, Agarwal AK, Garg A. Congenital generalized lipodystrophy, type 4 (CGL4) associated with myopathy due to novel PTRF mutations. Am. J. Med. Genet. A. 2010;152A:2245–2253. doi: 10.1002/ajmg.a.33578. [DOI] [PMC free article] [PubMed] [Google Scholar]
- 12.Jelani M, Ahmed S, Almramhi MM, et al. Novel nonsense mutation in the PTRF gene underlies congenital generalized lipodystrophy in a consanguineous Saudi family. Eur. J. Med. Genet. 2015;58:216–221. doi: 10.1016/j.ejmg.2015.02.002. [DOI] [PubMed] [Google Scholar]
- 13.Murakami N, Hayashi YK, Oto Y, et al. Congenital generalized lipodystrophy type 4 with muscular dystrophy: clinical and pathological manifestations in early childhood. Neuromuscul. Disord. 2013;23:441–444. doi: 10.1016/j.nmd.2013.02.005. [DOI] [PubMed] [Google Scholar]
- 14.Kim CA, Delepine M, Boutet E, et al. Association of a homozygous nonsense caveolin-1 mutation with Berardinelli-Seip congenital lipodystrophy. J. Clin. Endocrinol. Metab. 2008;93:1129–1134. doi: 10.1210/jc.2007-1328. [DOI] [PubMed] [Google Scholar]
- 15.Cao H, Alston L, Ruschman J, Hegele RA. Heterozygous CAV1 frame-shift mutations (MIM 601047) in patients with atypical partial lipodystrophy and hypertriglyceridemia. Lipids Health Dis. 2008;7:3. doi: 10.1186/1476-511X-7-3. [DOI] [PMC free article] [PubMed] [Google Scholar]
- 16.Schrauwen I, Szelinger S, Siniard AL, et al. A frame-shift mutation in CAV1 is associated with a severe neonatal progeroid and lipodystrophy syndrome. PLoS One. 2015;10:e0131797. doi: 10.1371/journal.pone.0131797. [DOI] [PMC free article] [PubMed] [Google Scholar]
- 17.Hayer A, Stoeber M, Bissig C, Helenius A. Biogenesis of caveolae: stepwise assembly of large caveolin and cavin complexes. Traffic. 2010;11:361–382. doi: 10.1111/j.1600-0854.2009.01023.x. [DOI] [PubMed] [Google Scholar]
- 18.Moren B, Shah C, Howes MT, et al. EHD2 regulates caveolar dynamics via ATP-driven targeting and oligomerization. Mol. Biol. Cell. 2012;23:1316–1329. doi: 10.1091/mbc.E11-09-0787. [DOI] [PMC free article] [PubMed] [Google Scholar]
- 19.Stoeber M, Stoeck IK, Hanni C, Bleck CK, Balistreri G, Helenius A. Oligomers of the ATPase EHD2 confine caveolae to the plasma membrane through association with actin. EMBO J. 2012;31:2350–2364. doi: 10.1038/emboj.2012.98. [DOI] [PMC free article] [PubMed] [Google Scholar]
- 20.Hill MM, Bastiani M, Luetterforst R, et al. PTRF-Cavin, a conserved cytoplasmic protein required for caveola formation and function. Cell. 2008;132:113–124. doi: 10.1016/j.cell.2007.11.042. [DOI] [PMC free article] [PubMed] [Google Scholar]
- 21.Scherer PE, Okamoto T, Chun M, Nishimoto I, Lodish HF, Lisanti MP. Identification, sequence, and expression of caveolin-2 defines a caveolin gene family. Proc. Natl. Acad. Sci. U.S.A. 1996;93:131–135. doi: 10.1073/pnas.93.1.131. [DOI] [PMC free article] [PubMed] [Google Scholar]
- 22.Hansen CG, Howard G, Nichols BJ. Pacsin 2 is recruited to caveolae and functions in caveolar biogenesis. J. Cell Sci. 2011;124:2777–2785. doi: 10.1242/jcs.084319. [DOI] [PubMed] [Google Scholar]
- 23.Senju Y, Itoh Y, Takano K, Hamada S, Suetsugu S. Essential role of PACSIN2/syndapin-II in caveolae membrane sculpting. J. Cell Sci. 2011;124:2032–2040. doi: 10.1242/jcs.086264. [DOI] [PubMed] [Google Scholar]
- 24.Kovtun O, Tillu VA, Ariotti N, Parton RG, Collins BM. Cavin family proteins and the assembly of caveolae. J. Cell Sci. 2015;128:1269–1278. doi: 10.1242/jcs.167866. [DOI] [PMC free article] [PubMed] [Google Scholar]
- 25.Ludwig A, Howard G, Mendoza-Topaz C, et al. Molecular composition and ultrastructure of the caveolar coat complex. PLoS Biol. 2013;11:e1001640. doi: 10.1371/journal.pbio.1001640. [DOI] [PMC free article] [PubMed] [Google Scholar]
- 26.Gambin Y, Ariotti N, McMahon KA, et al. Single-molecule analysis reveals self assembly and nanoscale segregation of two distinct cavin subcomplexes on caveolae. eLife. 2014;3:e01434. doi: 10.7554/eLife.01434. [DOI] [PMC free article] [PubMed] [Google Scholar]
- 27.Mohan J, Moren B, Larsson E, Holst M, Lundmark R. Cavin3 interacts with cavin1 and caveolin1 to increase surface dynamics of caveolae. J. Cell Sci. 2015;128:979–991. doi: 10.1242/jcs.161463. [DOI] [PubMed] [Google Scholar]
- 28.Song KS, Tang ZL, Li SW, Lisanti MP. Mutational analysis of the prop-erties of caveolin-1: a novel role for the C-terminal domain in mediating homo-typic caveolin-caveolin interactions. J. Biol. Chem. 1997;272:4398–4403. doi: 10.1074/jbc.272.7.4398. [DOI] [PubMed] [Google Scholar]
- 29.Schlegel A, Lisanti MP. A molecular dissection of caveolin-1 membrane attachment and oligomerization: two separate regions of the caveolin-1 C-terminal domain mediate membrane binding and oligomer/oligomer interactions in vivo. J. Biol. Chem. 2000;275:21605–21617. doi: 10.1074/jbc.M002558200. [DOI] [PubMed] [Google Scholar]
- 30.Oberhuber G. Histopathology of celiac disease. Biomed. Pharmacother. 2000;54:368–372. doi: 10.1016/S0753-3322(01)80003-2. [DOI] [PubMed] [Google Scholar]
- 31.Fennessey CM, Sheng J, Rubin DH, McClain MS. Oligomerization of Clostridium perfringens epsilon toxin is dependent upon caveolins 1 and 2. PLoS One. 2012;7:e46866. doi: 10.1371/journal.pone.0046866. [DOI] [PMC free article] [PubMed] [Google Scholar]
- 32.Ren X, Ostermeyer AG, Ramcharan LT, Zeng Y, Lublin DM, Brown DA. Conformational defects slow Golgi exit, block oligomerization, and reduce raft affinity of caveolin-1 mutant proteins. Mol. Biol. Cell. 2004;15:4556–4567. doi: 10.1091/mbc.E04-06-0480. [DOI] [PMC free article] [PubMed] [Google Scholar]
- 33.Lajoie P, Partridge EA, Guay G, et al. Plasma membrane domain organization regulates EGFR signaling in tumor cells. J. Cell Biol. 2007;179:341–356. doi: 10.1083/jcb.200611106. [DOI] [PMC free article] [PubMed] [Google Scholar]
- 34.Han B, Tiwari A, Kenworthy AK. Tagging strategies strongly affect the fate of overexpressed caveolin-1. Traffic. 2015;16:417–438. doi: 10.1111/tra.12254. [DOI] [PMC free article] [PubMed] [Google Scholar]
- 35.Parton RG, Simons K. The multiple faces of caveolae. Nat. Rev. Mol. Cell Biol. 2007;8:185–194. doi: 10.1038/nrm2122. [DOI] [PubMed] [Google Scholar]
- 36.Pol A, Martin S, Fernandez MA, et al. Cholesterol and fatty acids regulate dynamic caveolin trafficking through the Golgi complex and between the cell surface and lipid bodies. Mol. Biol. Cell. 2005;16:2091–2105. doi: 10.1091/mbc.E04-08-0737. [DOI] [PMC free article] [PubMed] [Google Scholar]
- 37.Parton RG, Hanzal-Bayer M, Hancock JF. Biogenesis of caveolae: a structural model for caveolin-induced domain formation. J. Cell Sci. 2006;119:787–796. doi: 10.1242/jcs.02853. [DOI] [PubMed] [Google Scholar]
- 38.Kirkham M, Nixon SJ, Howes MT, et al. Evolutionary analysis and molecular dissection of caveola biogenesis. J. Cell Sci. 2008;121:2075–2086. doi: 10.1242/jcs.024588. [DOI] [PubMed] [Google Scholar]
- 39.Sinha B, Koster D, Ruez R, et al. Cells respond to mechanical stress by rapid disassembly of caveolae. Cell. 2011;144:402–413. doi: 10.1016/j.cell.2010.12.031. [DOI] [PMC free article] [PubMed] [Google Scholar]
- 40.Ariotti N, Rae J, Leneva N, et al. Molecular characterization of caveolin-induced membrane curvature. J. Biol. Chem. 2015;290:24875–24890. doi: 10.1074/jbc.M115.644336. [DOI] [PMC free article] [PubMed] [Google Scholar]
- 41.Bush WS, Ihrke G, Robinson JM, Kenworthy AK. Antibody-specific detection of caveolin-1 in subapical compartments of MDCK cells. Histochem. Cell Biol. 2006;126:27–34. doi: 10.1007/s00418-006-0144-y. [DOI] [PubMed] [Google Scholar]
- 42.Cheng JP, Mendoza-Topaz C, Howard G, et al. Caveolae protect endothelial cells from membrane rupture during increased cardiac output. J. Cell Biol. 2015;211:53–61. doi: 10.1083/jcb.201504042. [DOI] [PMC free article] [PubMed] [Google Scholar]
- 43.Hanson CA, Drake KR, Baird MA, et al. Overexpression of caveolin-1 is sufficient to phenocopy the behavior of a disease-associated mutant. Traffic. 2013;14:663–677. doi: 10.1111/tra.12066. [DOI] [PMC free article] [PubMed] [Google Scholar]
- 44.Mora R, Bonilha VL, Marmorstein A, et al. Caveolin-2 localizes to the golgi complex but redistributes to plasma membrane, caveolae, and rafts when co-expressed with caveolin-1. J. Biol. Chem. 1999;274:25708–25717. doi: 10.1074/jbc.274.36.25708. [DOI] [PubMed] [Google Scholar]
- 45.Gervasio OL, Phillips WD, Cole L, Allen DG. Caveolae respond to cell stretch and contribute to stretch-induced signaling. J. Cell Sci. 2011;124:3581–3590. doi: 10.1242/jcs.084376. [DOI] [PubMed] [Google Scholar]
- 46.Briand N, Prado C, Mabilleau G, et al. Caveolin-1 expression and cavins stability regulate caveolae dynamics in adipocyte lipid store fluctuation. Diabetes. 2014;63:4032–4044. doi: 10.2337/db13-1961. [DOI] [PMC free article] [PubMed] [Google Scholar]
- 47.Zhao YY, Liu Y, Stan RV, et al. Defects in caveolin-1 cause dilated cardiomyopathy and pulmonary hypertension in knockout mice. Proc. Natl. Acad. Sci. U.S.A. 2002;99:11375–11380. doi: 10.1073/pnas.172360799. [DOI] [PMC free article] [PubMed] [Google Scholar]
- 48.Razani B, Engelman JA, Wang XB, et al. Caveolin-1 null mice are viable but show evidence of hyperproliferative and vascular abnormalities. J. Biol. Chem. 2001;276:38121–38138. doi: 10.1074/jbc.M105408200. [DOI] [PubMed] [Google Scholar]
- 49.Drab M, Verkade P, Elger M, et al. Loss of caveolae, vascular dysfunction, and pulmonary defects in caveolin-1 gene-disrupted mice. Science. 2001;293:2449–2452. doi: 10.1126/science.1062688. [DOI] [PubMed] [Google Scholar]
- 50.Razani B, Combs TP, Wang XB, et al. Caveolin-1-deficient mice are lean, resistant to diet-induced obesity, and show hypertriglyceridemia with adipocyte abnormalities. J. Biol. Chem. 2002;277:8635–8647. doi: 10.1074/jbc.M110970200. [DOI] [PubMed] [Google Scholar]
- 51.Liu L, Pilch PF. PTRF/Cavin-1 promotes efficient ribosomal RNA transcription in response to metabolic challenges. eLife. 2016;5:1–20. doi: 10.7554/eLife.17508. [DOI] [PMC free article] [PubMed] [Google Scholar]
- 52.Park H, Go YM, Darji R, et al. Caveolin-1 regulates shear stress-dependent activation of extracellular signal-regulated kinase. Am. J. Physiol. Heart Circ. Physiol. 2000;278:H1285–H1293. doi: 10.1152/ajpheart.2000.278.4.H1285. [DOI] [PubMed] [Google Scholar]
- 53.Scherer PE, Tang Z, Chun M, Sargiacomo M, Lodish HF, Lisanti MP. Caveolin isoforms differ in their N-terminal protein sequence and subcellular distribution: identification and epitope mapping of an isoform-specific monoclonal antibody probe. J. Biol. Chem. 1995;270:16395–16401. doi: 10.1074/jbc.270.27.16395. [DOI] [PubMed] [Google Scholar]
- 54.Li MZ, Elledge SJ. Harnessing homologous recombination in vitro to generate recombinant DNA via SLIC. Nat. Methods. 2007;4:251–256. doi: 10.1038/nmeth1010. [DOI] [PubMed] [Google Scholar]
Associated Data
This section collects any data citations, data availability statements, or supplementary materials included in this article.