

Abstract
Epigallocatechin gallate (EGCG) is a green tea antioxidant with adverse effects on rat liver mitochondria and hepatocytes at high doses. Here, we assessed whether low doses of EGCG would protect these systems from damage induced by tert-butyl hydroperoxide (tBHP). Rat liver mitochondria or permeabilized rat hepatocytes were pretreated with EGCG and then exposed to tBHP. Oxygen consumption, mitochondrial membrane potential (MMP), and mitochondrial retention capacity for calcium were measured. First, 50 μM EGCG or 0.25 mM tBHP alone increased State 4 Complex I-driven respiration, thus demonstrating uncoupling effects; tBHP also inhibited State 3 ADP-stimulated respiration. Then, the coexposure to 0.25 mM tBHP and 50 μM EGCG induced a trend of further decline in the respiratory control ratio beyond that observed upon tBHP exposure alone. EGCG had no effect on MMP and no effect, in concentrations up to 50 μM, on mitochondrial calcium retention capacity. tBHP led to a decline in both MMP and mitochondrial retention capacity for calcium; these effects were not changed by pretreatment with EGCG. In addition, EGCG dose-dependently enhanced hydrogen peroxide formation in a cell- and mitochondria-free medium. Conclusion. Moderate nontoxic doses of EGCG were not able to protect rat liver mitochondria and hepatocytes from tBHP-induced mitochondrial dysfunction.
1. Introduction
Epigallocatechin gallate (EGCG) is an important polyphenolic compound of green tea [1, 2]. It was repeatedly reported that EGCG acts as a cytoprotective agent [3–5]. EGCG can exert its antioxidant properties by several different mechanisms. First, EGCG can be oxidized on some of its phenolic groups, thereby generating a quinone [6]. Second, EGCG is able to activate the stress-responding transcription factor Nrf2 [2, 7]. Third, EGCG can have uncoupling effects, [8] and mild uncoupling is able to attenuate production of mitochondrial reactive oxygen species (ROS) [9, 10].
In contrast, high doses of EGCG were found to be hepatotoxic [8, 11–13]. Similarly, EGCG displayed toxicity on mitochondria in permeabilized hepatocytes [8] and on mitochondria in a hepatoma cell line [14]. Long-term treatment of mice with tea-based beverage was reported to downregulate the expression of mitochondrial respiratory complexes [15]. A protective effect on mitochondria from different organs was reported in other studies [16–18]. The resulting effect of EGCG depends not only on the dose but also on the type of stress exposure [19]. For example, EGCG is able to directly scavenge superoxide [20] but can promote production of hydrogen peroxide [21, 22].
Thus, we decided to test whether low concentrations of EGCG would alter mitochondrial dysfunction caused by tert-butyl hydroperoxide (tBHP). tBHP is an oxidative agent which affects cellular glutathione in a similar manner as hydrogen peroxide but is not degraded by catalase [23]. tBHP is able to inhibit Complex I-driven respiration in mitochondria, as well as some oxoacid dehydrogenases [24–26]. Interestingly, tBHP does not have a major effect on succinate dehydrogenase [24], which is instead susceptible to the action of superoxide [27].
Other authors found that EGCG ameliorated tBHP-induced oxidative damage in liver homogenates [1] and in hepatoma cell lines [28, 29]. In addition, tea extract but not EGCG alone was able to ameliorate tBHP-induced cell death in primary rat hepatocytes [30]. The effects of EGCG and tBHP on liver mitochondrial function have not yet been tested and will be the focus of the present study in two experimental models: permeabilized rat hepatocytes and isolated rat liver mitochondria. As will be shown by measurements of respiration, mitochondrial membrane potential, and calcium retention capacity, low concentrations of EGCG did not affect mitochondrial parameters but did not alter tBHP-induced mitochondrial dysfunction either. Furthermore, high concentrations of EGCG were even found to enhance the toxicity of tBHP.
2. Materials and Methods
2.1. Chemicals
Unless otherwise stated, all chemicals including EGCG and tBHP were of analytical grade and purchased from Sigma-Aldrich (Madison, WI, USA). Collagenase NB4 was obtained from SERVA Electrophoresis (Germany).
2.2. Animals
Male Wistar rats (220–320 g body weight) were purchased from Velaz (Lysa nad Labem, Czech Republic). All the animals received humane care, water, and a standard laboratory diet ad libitum. All the procedures were performed under general anesthesia. The study protocols were approved by the Animal Welfare Body of the Faculty of Medicine in Hradec Kralove (approving protocol number MSMT-44579/2014-3).
2.3. Preparation of Permeabilized Hepatocytes
The hepatocytes were isolated by two-step collagenase perfusion as described previously [8]. Briefly, the portal vein was cannulated and the liver was perfused with a calcium-free solution and then with a solution containing collagenase. The excised digested liver was then mechanically disrupted. The resulting suspension was centrifuged three times at 28 ×g to separate hepatocytes from other cell types. The viability of the cells was verified using a Trypan Blue exclusion test. Viability of >90% was required for further analyses.
The cells were diluted to a final density of 125,000 cells per mL [31]. Cells were permeabilized in an oxygraph chamber by digitonin addition (10 μg/mL).
2.4. Mitochondrial Isolation
Mitochondria were isolated as described previously [32, 33]. Briefly, the liver was cut into small pieces and homogenized using an Ultra Turrax T8 homogenizer (IKA Laboratortechnik, Staufen, Germany) in homogenization medium containing 220 mM D-mannitol, 70 mM sucrose, 2 mM HEPES, 0.2 mM EGTA, pH 7.2, and 0.05% (w/v) fat-free bovine serum albumin. The 10% homogenate was centrifuged at 830 ×g for 4 min at 4°C. The resulting supernatant was purified by filtration through gauze. After further repeated centrifugation at 10,000 g for 15 min, the sediment was collected and resuspended in a medium without EGTA. The isolated mitochondria were then stored at 4°C until analyses for a maximum duration of 5 hours. The mitochondrial content was normalized to protein concentration, which was determined using the Bradford method with bovine serum albumin as a standard [34].
2.5. Respirometry
Oxygen consumption was measured in permeabilized hepatocytes and in isolated mitochondria by high resolution respirometry using a High Resolution Oxygraph 2K (OROBOROS INSTRUMENTS, Innsbruck, Austria) according to manufacturer's instructions. First, the suspensions of permeabilized hepatocytes (125,000 cells per mL) or isolated mitochondria (0.15 mg protein per mL) were exposed to various concentrations of EGCG (medium only, 2, 10, and 50 μM) for 5 minutes and then to 0.25 mM tBHP for another 5 min. Next, 10 mM glutamate and 2.5 mM malate (G+M) were added as substrates for Complex I to measure leak respiration (State 4). Then, 1.5 mM adenosine diphosphate (ADP) was added to evaluate the capacity of oxidative phosphorylation (State 3). Afterwards, 20 μM cytochrome c was used to test the outer mitochondrial membrane integrity [35]. Then, 1 μM rotenone (Rot) was added to inhibit Complex I, and 10 mM succinate (Suc) was provided as a substrate for Complex II. The respiratory control ratio was calculated as a ratio of State 3 (oxygen consumption in the presence of G+M+ADP) to State 4 (leak oxygen consumption with G+M only) [36]. The respiration data are expressed as percent of controls (respiration after addition of G+M) to normalize for any interindividual differences in the mitochondrial preparations. The data were analyzed by the Oroboros DatLab 6.1 (OROBOROS INSTRUMENTS, Innsbruck, Austria) software.
2.6. Mitochondrial Membrane Potential
The measurement of mitochondrial membrane potential (MMP) was performed as described previously [37], with the exception that safranine O was used in the present study. Safranine O is a charged dye that stacks in mitochondria with high MMP, thereby decreasing its levels in the medium. Conversely, low MMP leads to an efflux of safranine O from mitochondria and its increased concentration in the medium [38]. First, the cuvette was filled with 1 mL of medium containing 80 mM KCl, 10 mM Tris-HCl, 3 mM MgCl2, 4 mM K3PO4, 1 mM EDTA, pH 7.2, 10 μM safranine O, and, in indicated cases, also EGCG. Then, hepatocytes or mitochondria (0.1 mg protein per mL) were added. As substrates, we used glutamate (10 mM) and malate (2.5 mM). Afterwards, tBHP was added. As a last step, 10 μM protonophore FCCP was added to dissipate MMP. We used an AMINCO-Bowman Series 2 Luminescence Spectrometer (Thermo Fisher Scientific, Waltham, MA, USA) for the measurement of fluorescence with an excitation wavelength of 495 nm and an emission wavelength of 586 nm.
2.7. Calcium Retention Capacity
Mitochondrial retention capacity for calcium was evaluated using the fluorescent probe Calcium Green (Thermo Fisher Scientific) on an AMINCO-Bowman Series 2 spectrometer with the following parameters: excitation wavelength 506 nm and emission wavelength 592 nm. Briefly, swelling medium (125 mM saccharose, 65 mM KCl, 10 mM HEPES, and pH 7.2 [39]), 1 μM Calcium Green, 10 mM succinate, and mitochondria (0.4 mg protein per mL) were added to a cuvette. Afterwards, calcium chloride (CaCl2) was titrated; its concentration was increased by 1.25 μM with every addition. In indicated cases, EGCG was added 5 minutes prior to the addition of tBHP. The probe reversibly binds to calcium ions. When mitochondria accumulate calcium, the fluorescent signal in the medium decreases [40, 41]. When the retention capacity is exceeded, mitochondria release the accumulated calcium and the fluorescence rises dramatically.
2.8. Hydrogen Peroxide Production
The rate of hydrogen peroxide production by EGCG was measured in the absence of any biological sample at 37°C by an O2k-Fluorometer (OROBOROS INSTRUMENTS, Innsbruck, Austria) [42]. The light intensity of the LEDs was set to a polarization voltage of 500 mV in the presence of 10 μM Amplex Red (Life Technologies) and horseradish peroxidase (HRP; 1 IU/mL). Briefly, hydrogen peroxide reacts with Amplex Red in the presence of HRP creating the fluorescent product resorufin. The rate of hydrogen peroxide production was calculated as a first derivation of the resorufin levels over time. The calibrations were performed by H2O2 titrations in steps of 0.1 μM at the beginning and throughout the whole measurement after each EGCG addition to eliminate possible interference of EGCG with Amplex Red assay, which was described before [43]. Due to the antioxidant properties of EGCG, we were not able to calibrate the signal at concentrations of EGCG higher than 20 μM; therefore, the sensitivity of our H2O2 measurements was limited by this EGCG concentration.
2.9. Statistical Analysis
The respiration data are based on six or more biological replicates (i.e., with at least six individual animals), and calcium retention capacity measurements are based on three biological replicates; mitochondrial membrane potential represents data from a single preparation. Software GraphPad Prism 6.01 (GraphPad Software, La Jolla, CA, USA) was used for the calculations. First, normality was tested by means of the Kolmogorov-Smirnov test. One-way ANOVA or its nonparametric variant the Kruskal-Wallis test was used to analyze differences among groups, and Tukey's posttest and Dunn's posttest were used for multiple comparisons. p < 0.05 was considered significant.
3. Results
3.1. Mitochondrial Respiration: Effect of tBHP and EGCG
Representative curves of mitochondrial respiration in isolated mitochondria are provided in Figure 1. State 4 respiration increases only slightly after the addition of substrates for Complex I because the availability of adenosine diphosphate (ADP) is very low. Respiration increases rapidly after the addition of ADP (State 3). Rotenone was then added to suppress glutamate- and malate-stimulated respiration via inhibition of mitochondrial Complex I. Finally, the addition of succinate provides electrons for mitochondrial Complex II, therefore bypassing the blocked Complex I and resulting in State 3 succinate-stimulated respiration. The exposure to 0.25 mM tBHP led to blunting of the observed increase in State 3 respiration of Complex I (p < 0.001, Figure 2(c)), but Complex II respiration was not significantly changed.
Figure 1.
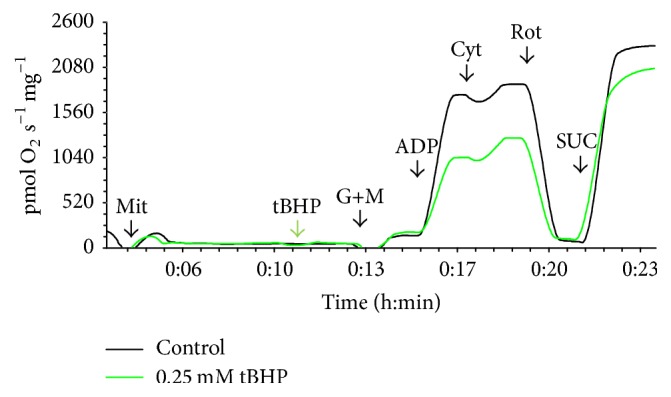
Representative curves of the oxygen consumption ratio in control isolated mitochondria (black curve) and mitochondria exposed to 0.25 mM tBHP (green curve). Additions are marked at the X-axis: Mit = mitochondria (0.15 mg protein per mL), tBHP = 0.25 mM tBHP, G+M = 10 mM glutamate and 2.5 mM malate, ADP = 1.5 mM adenosine diphosphate, Cyt = 20 μM cytochrome c, ROT = 1 μM rotenone, and SUC = 10 mM succinate.
Figure 2.

Respiration with glutamate and malate after exposure to EGCG and/or tBHP. (a) Leak respiration in isolated mitochondria; (b) leak respiration in permeabilized hepatocytes; (c) ADP-stimulated respiration in isolated mitochondria; (d) ADP-stimulated respiration in permeabilized hepatocytes. The concentrations of EGCG are expressed in μmol/L, and those of tBHP are in mmol/L. ∗ versus control, + versus corresponding EGCG alone, # versus tBHP alone; p < 0.05, <0.01, or <0.001 for one, two or three symbols, respectively; n = 6–10.
After exposure to various concentrations of EGCG and/or tBHP, similar effects were observed in isolated mitochondria and in permeabilized hepatocytes: the State 4 leak respiration in the presence of substrates for Complex I but without ADP was increased by the addition of 0.25 mM tBHP in both isolated mitochondria (p < 0.01) and in permeabilized hepatocytes (p < 0.05). Treatment with EGCG at a concentration of 50 μM led to a higher level of State 4 leak respiration in isolated mitochondria (p < 0.001 versus controls) and enhanced the tBHP-induced increase (p < 0.001 versus tBHP alone); these differences did not reach statistical significance in permeabilized hepatocytes (Figure 2).
The respiratory control ratio, calculated as the ratio of State 3 (glutamate + malate + ADP) to State 4 (glutamate + malate) respiration [44], was significantly lower in mitochondria treated with tBHP than in controls (p < 0.001 for both isolated mitochondria and permeabilized hepatocytes). The addition of EGCG at a concentration of 50 μM led to a lower respiratory control ratio than in controls (p < 0.001 in isolated mitochondria, p < 0.05 in hepatocytes). In addition, 50 μM EGCG potentiated the decrease in the respiratory control ratio caused by 0.25 mM tBHP in isolated mitochondria (Table 1). These findings point to a suppression of spare respiratory capacity by the combination of both compounds.
Table 1.
Respiratory control ratio.
| Treatment | Control | EGCG2 | EGCG10 | EGCG50 | tBHP0.25 | EGCG2 + t-BHP0.25 | EGCG10 + tBHP0.25 | EGCG50 + tBHP0.25 |
|---|---|---|---|---|---|---|---|---|
| Mit | 11.6 ± 1.3 | 10.5 ± 1.1 | 10.0 ± 0.9 | 7.0 ± 1.1∗∗∗ | 6.3 ± 0.9∗∗∗ | 5.8 ± 0.7∗∗∗,+++ | 5.9 ± 0.2∗∗∗,+++ | 4.4 ± 0.3∗∗∗,+++,# |
| Hep | 5.5 ± 1.1 | 5.1 ± 1.0 | 5.2 ± 0.8 | 4.2 ± 0.6∗ | 3.3 ± 0.5∗∗∗ | 3.2 ± 0.6∗∗∗,+++ | 3.3 ± 0.6∗∗∗,+++ | 2.7 ± 0.5∗∗∗,+ |
1Data are expressed as the mean ± standard deviation. Mit = mitochondria and Hep = permeabilized hepatocytes. Concentration of tBHP is shown in mmol/L and that of EGCG in μmol/L; ∗ versus control, + versus corresponding EGCG, and # versus tBHP alone; p < 0.05, <0.01, or <0.001 for one, two, or three symbols, respectively; n = 6–10.
3.2. Mitochondrial Membrane Potential
The concentration of tBHP used for the suppression of mitochondrial respiration, 0.25 mM, did not confer any changes in mitochondrial membrane potential (MMP). Higher doses of tBHP, up to 2 mM, were necessary to see a drop in MMP. Mitochondria preincubated with 10 μM EGCG and then treated with tBHP at concentrations of 0.25 to 2 mM displayed the same changes in MMP as mitochondria treated with tBHP alone (Figure 3).
Figure 3.
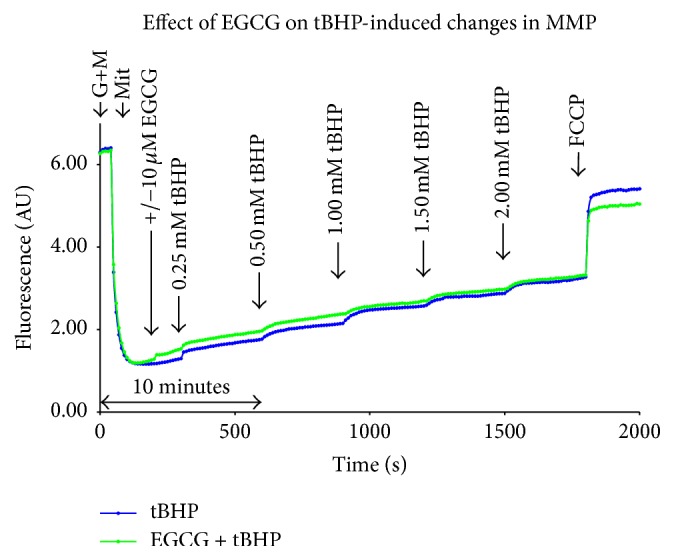
Representative curves of MMP measurement using safranine O after treatment with EGCG and/or tBHP. The results from titration of tBHP with and without EGCG pretreatment are shown. AU = Arbitrary Units, G+M = glutamate (10 mM) and malate (2.5 mM), and Mit = mitochondria (0.1 mg protein per mL).
3.3. Mitochondrial Calcium Retention Capacity
EGCG alone had no effect on mitochondrial calcium retention capacity in concentrations of 50 μM and lower. Exposure to 100 μM EGCG decreased retention capacity of mitochondria to 71.4% of controls (Figure 4(a)). Treatment with tBHP led to a decline in mitochondrial retention capacity for calcium, illustrated by an early increase in fluorescence following the addition of CaCl2. These results were not significantly changed by pretreatment with EGCG (Figure 4(b)).
Figure 4.

Representative curves of mitochondrial calcium retention capacity using Calcium Green after treatment with EGCG and/or tBHP. CaCl2 was added to increase its final concentration by 1.25 μM upon every addition. (a) The effect of EGCG alone; (b) pretreatment with 10 μM EGCG before the addition of 0.25 mM tBHP. AU = Arbitrary Units, SUC = 10 mM succinate, and Mit = mitochondria (0.4 mg protein per mL).
3.4. Oxygen Consumption and Hydrogen Peroxide Production with EGCG
To investigate whether EGCG also forms hydrogen peroxide in our respiratory medium, we performed background measurements in the absence of any biological sample. We found a linear relationship between H2O2 production and EGCG concentration (Figure 5(a)). By employing unique simultaneous measurements of high resolution respirometry and fluorometry, we also detected a linear increase in oxygen consumption caused by EGCG itself (Figure 5(b)). Increased oxygen consumption was also found in the absence of Amplex Red and HRP (Figure 5(c)), suggesting that the results were not solely caused by redox-active chemicals present in the medium during H2O2 measurement (Amplex Red and/or HRP).
Figure 5.

Background hydrogen peroxide production and oxygen consumption by EGCG. (a) H2O2 production detected by Amplex Red (n = 5–7); (b) oxygen consumption during H2O2 measurement (n = 7); (c) oxygen consumption in plain K-medium (n = 3–8). The background measurements in a and b were performed using two different fluorometry and oxygen sensors; measurements in (c) were performed using six different oxygen sensors. HRP: horseradish peroxidase.
4. Discussion
The exposure of both isolated mitochondria and permeabilized hepatocytes to 0.25 mM tBHP led to an inhibition of Complex I-stimulated respiration. This is in accord with our previous findings [25, 31] and provides further validation of this model.
Pretreatment with low dose of EGCG (10 μM) did not modify the subsequent tBHP-induced mitochondrial dysfunction. The additive decline in the respiratory control ratio in both systems with 50 μM EGCG and 0.25 mM tBHP can be interpreted as a decrease in maximal phosphorylation capacity and an additional uncoupling of oxidative phosphorylation beyond those caused by tBHP alone.
An uncoupling effect is not necessarily deleterious—mild uncoupling is able to lower the mitochondrial electrochemical gradient, attenuate ROS production, and limit further oxidative damage [9, 10]. Uncoupling dissipates the proton motive force and decreases the ROS formation at Complex I during reverse electron transport [45]. This may explain the lack of protection by EGCG in the present study because the oxidative stress was induced by an exogenous oxidant rather than by the leak of electrons from the mitochondrial respiratory chain.
The minimal effect of tBHP on succinate-stimulated respiration is in accord with our previous study [25, 26]. This is also supported by previous findings that the activity of succinate dehydrogenase is disrupted by superoxide [27] but not by tBHP [24]. No effect of EGCG on succinate-dependent respiration is in accord with Weng et al. [46] who reported no inhibition by EGCG up to 60 μM in normal isolated rat liver mitochondria. Their observation of major inhibition of all mitochondrial complexes in swelling mitochondria was not tested in our settings.
It was previously described that EGCG is able to induce H2O2 generation [22]. In the present study, we demonstrated oxygen consumption and hydrogen peroxide production in a mitochondria- and cell-free system. This is in accord with other authors who reported enhanced formation of hydrogen peroxide in the presence of EGCG [21]. Therefore, an additive toxic effect of tBHP and EGCG could be explained by an additive load of peroxides. By increasing hydrogen peroxide levels, EGCG was also shown to decrease cellular reduced glutathione [11].
Both methods used, isolated mitochondria and permeabilized hepatocytes, have their limitations. Permeabilized cells may have restricted diffusion of oxygen [47], whereas isolated mitochondria may be sensitized to permeability transition and ROS emission [48]. In the present study, both systems revealed similar effects of EGCG and tBHP on mitochondrial respiration. Similar results in permeabilized hepatocytes and in isolated mitochondria also suggest that the tested interval was too short to detect any changes in the stress-responsive Nrf2 pathway. This is in accord with a previous study [7] where the authors observed maximal upregulation of Nrf2-dependent genes after 6 hours of exposure to EGCG.
In conclusion, moderate nontoxic doses of EGCG were not able to protect rat liver mitochondria from tBHP-induced mitochondrial dysfunction. An additive effect of EGCG and tBHP toxicity was observed when the highest concentration of 50 μM EGCG was tested.
Acknowledgments
Language of this manuscript was corrected by the American Journal Experts, certificate verification key 6807-7484-F245-91E8-7593.
Competing Interests
The authors declare that there are no competing interests regarding the publication of this paper.
Funding
This study was supported by Grant PRVOUK P37/02.
References
- 1.Yoshino K., Hara Y., Sano M., Tomita I. Antioxidative effects of black tea theaflavins and thearubigin on lipid peroxidation of liver homogenates induced by tert-butyl hydroperoxide. Biological and Pharmaceutical Bulletin. 1994;17(1):146–149. doi: 10.1248/bpb.17.146. [DOI] [PubMed] [Google Scholar]
- 2.Na H.-K., Surh Y.-J. Modulation of Nrf2-mediated antioxidant and detoxifying enzyme induction by the green tea polyphenol EGCG. Food and Chemical Toxicology. 2008;46(4):1271–1278. doi: 10.1016/j.fct.2007.10.006. [DOI] [PubMed] [Google Scholar]
- 3.Wang Y., Mei Y., Feng D., Xu L. (−)-Epigallocatechin-3-gallate protects mice from concanavalin A-induced hepatitis through suppressing immune-mediated liver injury. Clinical and Experimental Immunology. 2006;145(3):485–492. doi: 10.1111/j.1365-2249.2006.03137.x. [DOI] [PMC free article] [PubMed] [Google Scholar]
- 4.Sahin K., Tuzcu M., Gencoglu H., et al. Epigallocatechin-3-gallate activates Nrf2/HO-1 signaling pathway in cisplatin-induced nephrotoxicity in rats. Life Sciences. 2010;87(7-8):240–245. doi: 10.1016/j.lfs.2010.06.014. [DOI] [PubMed] [Google Scholar]
- 5.Tipoe G. L., Leung T. M., Liong E. C., Lau T. Y. H., Fung M. L., Nanji A. A. Epigallocatechin-3-gallate (EGCG) reduces liver inflammation, oxidative stress and fibrosis in carbon tetrachloride (CCl4)-induced liver injury in mice. Toxicology. 2010;273(1–3):45–52. doi: 10.1016/j.tox.2010.04.014. [DOI] [PubMed] [Google Scholar]
- 6.Lambert J. D., Elias R. J. The antioxidant and pro-oxidant activities of green tea polyphenols: a role in cancer prevention. Archives of Biochemistry and Biophysics. 2010;501(1):65–72. doi: 10.1016/j.abb.2010.06.013. [DOI] [PMC free article] [PubMed] [Google Scholar]
- 7.Romeo L., Intrieri M., D'Agata V., et al. The major green tea polyphenol, (-)-epigallocatechin-3-gallate, induces heme oxygenase in rat neurons and acts as an effective neuroprotective agent against oxidative stress. The Journal of the American College of Nutrition. 2009;28(supplement 4):492S–499S. doi: 10.1080/07315724.2009.10718116. [DOI] [PubMed] [Google Scholar]
- 8.Kucera O., Mezera V., Moravcova A., et al. In vitro toxicity of epigallocatechin gallate in rat liver mitochondria and hepatocytes. Oxidative Medicine and Cellular Longevity. 2015;2015:10. doi: 10.1155/2015/476180.476180 [DOI] [PMC free article] [PubMed] [Google Scholar]
- 9.Brand M. D., Affourtit C., Esteves T. C., et al. Mitochondrial superoxide: production, biological effects, and activation of uncoupling proteins. Free Radical Biology and Medicine. 2004;37(6):755–767. doi: 10.1016/j.freeradbiomed.2004.05.034. [DOI] [PubMed] [Google Scholar]
- 10.Mookerjee S. A., Divakaruni A. S., Jastroch M., Brand M. D. Mitochondrial uncoupling and lifespan. Mechanisms of Ageing and Development. 2010;131(7-8):463–472. doi: 10.1016/j.mad.2010.03.010. [DOI] [PMC free article] [PubMed] [Google Scholar]
- 11.Galati G., Lin A., Sultan A. M., O'Brien P. J. Cellular and in vivo hepatotoxicity caused by green tea phenolic acids and catechins. Free Radical Biology and Medicine. 2006;40(4):570–580. doi: 10.1016/j.freeradbiomed.2005.09.014. [DOI] [PubMed] [Google Scholar]
- 12.Schmidt M., Schmitz H.-J., Baumgart A., et al. Toxicity of green tea extracts and their constituents in rat hepatocytes in primary culture. Food and Chemical Toxicology. 2005;43(2):307–314. doi: 10.1016/j.fct.2004.11.001. [DOI] [PubMed] [Google Scholar]
- 13.Mezera V., Kucera O., Moravcova A., Peterova E., Cervinkova Z. The effect of epigallocatechin gallate on hepatocytes isolated from normal and partially hepatectomized rats. Canadian Journal of Physiology and Pharmacology. 2014;92(6):512–517. doi: 10.1139/cjpp-2014-0069. [DOI] [PubMed] [Google Scholar]
- 14.Li W., Nie S., Yu Q., Xie M. Y. (-)-epigallocatechin-3-gallate induces apoptosis of human hepatoma cells by mitochondrial pathways related to reactive oxygen species. Journal of Agricultural and Food Chemistry. 2009;57(15):6685–6691. doi: 10.1021/jf901396f. [DOI] [PubMed] [Google Scholar]
- 15.Serrano J. C. E., Gonzalo-Benito H., Jové M., et al. Dietary intake of green tea polyphenols regulates insulin sensitivity with an increase in AMP-activated protein kinase α content and changes in mitochondrial respiratory complexes. Molecular Nutrition and Food Research. 2013;57(3):459–470. doi: 10.1002/mnfr.201200513. [DOI] [PubMed] [Google Scholar]
- 16.Meng Q., Velalar C. N., Ruan R. Regulating the age-related oxidative damage, mitochondrial integrity, and antioxidative enzyme activity in Fischer 344 rats by supplementation of the antioxidant epigallocatechin-3-gallate. Rejuvenation Research. 2008;11(3):649–660. doi: 10.1089/rej.2007.0645. [DOI] [PubMed] [Google Scholar]
- 17.Liu J., Tang Y., Feng Z., Liu J., Liu J., Long J. (−)-Epigallocatechin-3-gallate attenuated myocardial mitochondrial dysfunction and autophagy in diabetic Goto-Kakizaki rats. Free Radical Research. 2014;48(8):898–906. doi: 10.3109/10715762.2014.920955. [DOI] [PubMed] [Google Scholar]
- 18.Miltonprabu S., Thangapandiyan S. Epigallocatechin gallate potentially attenuates Fluoride induced oxidative stress mediated cardiotoxicity and dyslipidemia in rats. Journal of Trace Elements in Medicine and Biology. 2015;29:321–335. doi: 10.1016/j.jtemb.2014.08.015. [DOI] [PubMed] [Google Scholar]
- 19.Crispo J. A. G., Ansell D. R., Piche M., et al. Protective effects of polyphenolic compounds on oxidative stress-induced cytotoxicity in PC12 cells. Canadian Journal of Physiology and Pharmacology. 2010;88(4):429–438. doi: 10.1139/Y09-137. [DOI] [PubMed] [Google Scholar]
- 20.Nakagawa T., Yokozawa T. Direct scavenging of nitric oxide and superoxide by green tea. Food and Chemical Toxicology. 2002;40(12):1745–1750. doi: 10.1016/S0278-6915(02)00169-2. [DOI] [PubMed] [Google Scholar]
- 21.Nakagawa H., Hasumi K., Woo J.-T., Nagai K., Wachi M. Generation of hydrogen peroxide primarily contributes to the induction of Fe(II)-dependent apoptosis in Jurkat cells by (−)-epigallocatechin gallate. Carcinogenesis. 2004;25(9):1567–1574. doi: 10.1093/carcin/bgh168. [DOI] [PubMed] [Google Scholar]
- 22.Long L. H., Clement M. V., Halliwell B. Artifacts in cell culture: Rapid generation of hydrogen peroxide on addition of (−)-epigallocatechin, (−)-epigallocatechin gallate, (+)-catechin, and quercetin to commonly used cell culture media. Biochemical and Biophysical Research Communications. 2000;273(1):50–53. doi: 10.1006/bbrc.2000.2895. [DOI] [PubMed] [Google Scholar]
- 23.Chance B., Sies H., Boveris A. Hydroperoxide metabolism in mammalian organs. Physiological Reviews. 1979;59(3):527–605. doi: 10.1152/physrev.1979.59.3.527. [DOI] [PubMed] [Google Scholar]
- 24.Sies H., Moss K. M. A role of mitochondrial glutathione peroxidase in modulating mitochondrial oxidations in liver. European Journal of Biochemistry. 1978;84(2):377–383. doi: 10.1111/j.1432-1033.1978.tb12178.x. [DOI] [PubMed] [Google Scholar]
- 25.Endlicher R., Křiváková P., Rauchová H., Nůsková H., Červinková Z., Drahota Z. Peroxidative damage of mitochondrial respiration is substrate-dependent. Physiological Research. 2009;58(5):685–692. doi: 10.33549/physiolres.931635. [DOI] [PubMed] [Google Scholar]
- 26.Drahota Z., Křiváková P., Červinková Z., et al. Tert-butyl hydroperoxide selectively inhibits mitochondrial respiratory-chain enzymes in isolated rat hepatocytes. Physiological Research. 2005;54(1):67–72. doi: 10.33549/physiolres.930578. [DOI] [PubMed] [Google Scholar]
- 27.Melov S., Coskun P., Patel M., et al. Mitochondrial disease in superoxide dismutase 2 mutant mice. Proceedings of the National Academy of Sciences of the United States of America. 1999;96(3):846–851. doi: 10.1073/pnas.96.3.846. [DOI] [PMC free article] [PubMed] [Google Scholar]
- 28.Murakami C., Hirakawa Y., Inui H., Nakano Y., Yoshida H. Effect of tea catechins on cellular lipid peroxidation and cytotoxicity in HepG2 cells. Bioscience, Biotechnology and Biochemistry. 2002;66(7):1559–1562. doi: 10.1271/bbb.66.1559. [DOI] [PubMed] [Google Scholar]
- 29.Fernández-Iglesias A., Quesada H., Díaz S., et al. DHA sensitizes FaO cells to tert-BHP-induced oxidative effects. Protective role of EGCG. Food and Chemical Toxicology. 2013;62:750–757. doi: 10.1016/j.fct.2013.10.013. [DOI] [PubMed] [Google Scholar]
- 30.Braud L., Peyre L., de-Sousa G., Armand M., Rahmani R., Maixent J.-M. Effect of brewing duration on the antioxidant and hepatoprotective abilities of tea phenolic and alkaloid compounds in a t-BHP oxidative stress-induced rat hepatocyte model. Molecules. 2015;20(8):14985–15002. doi: 10.3390/molecules200814985. [DOI] [PMC free article] [PubMed] [Google Scholar]
- 31.Červinková Z., Křiváková P., Lábajová A., et al. Mechanisms participating in oxidative damage of isolated rat hepatocytes. Archives of Toxicology. 2009;83(4):363–372. doi: 10.1007/s00204-008-0385-8. [DOI] [PubMed] [Google Scholar]
- 32.Bustamante E., Soper J. W., Pedersen P. L. A high-yield preparative method for isolation of rat liver mitochondria. Analytical Biochemistry. 1977;80(2):401–408. doi: 10.1016/0003-2697(77)90661-3. [DOI] [PubMed] [Google Scholar]
- 33.Drahota Z., Palenickova E., Endlicher R., et al. Biguanides inhibit complex I, II and IV of rat liver mitochondria and modify their functional properties. Physiological Research. 2014;63(1):1–11. doi: 10.33549/physiolres.932600. [DOI] [PubMed] [Google Scholar]
- 34.Bradford M. M. A rapid and sensitive method for the quantitation of microgram quantities of protein utilizing the principle of protein-dye binding. Analytical Biochemistry. 1976;72(1-2):248–254. doi: 10.1016/0003-2697(76)90527-3. [DOI] [PubMed] [Google Scholar]
- 35.Kuznetsov A. V., Schneeberger S., Seiler R., et al. Mitochondrial defects and heterogeneous cytochrome c release after cardiac cold ischemia and reperfusion. American Journal of Physiology—Heart and Circulatory Physiology. 2004;286(5):H1633–H1641. doi: 10.1152/ajpheart.00701.2003. [DOI] [PubMed] [Google Scholar]
- 36.Kučera O., Endlicher R., Roušar T., et al. The effect of tert-butyl hydroperoxide-induced oxidative stress on lean and steatotic rat hepatocytes in vitro . Oxidative Medicine and Cellular Longevity. 2014;2014:12. doi: 10.1155/2014/752506.752506 [DOI] [PMC free article] [PubMed] [Google Scholar]
- 37.Staňková P., Kučera O., Lotková H., Roušar T., Endlicher R., Červinková Z. The toxic effect of thioacetamide on rat liver in vitro. Toxicology in Vitro. 2010;24(8):2097–2103. doi: 10.1016/j.tiv.2010.06.011. [DOI] [PubMed] [Google Scholar]
- 38.Åkerman K. E. O., Wikström M. K. F. Safranine as a probe of the mitochondrial membrane potential. FEBS Letters. 1976;68(2):191–197. doi: 10.1016/0014-5793(76)80434-6. [DOI] [PubMed] [Google Scholar]
- 39.Drahota Z., Endlicher R., Staňková P., Rychtrmoc D., Milerová M., Červinková Z. Characterization of calcium, phosphate and peroxide interactions in activation of mitochondrial swelling using derivative of the swelling curves. Journal of Bioenergetics and Biomembranes. 2012;44(3):309–315. doi: 10.1007/s10863-012-9443-2. [DOI] [PubMed] [Google Scholar]
- 40.Ichas F., Jouaville L. S., Mazat J.-P. Mitochondria are excitable organelles capable of generating and conveying electrical and calcium signals. Cell. 1997;89(7):1145–1153. doi: 10.1016/S0092-8674(00)80301-3. [DOI] [PubMed] [Google Scholar]
- 41.Fontaine E., Eriksson O., Ichas F., Bernardi P. Regulation of the permeability transition pore in skeletal muscle mitochondria. Modulation by electron flow through the respiratory chain complex I. The Journal of Biological Chemistry. 1998;273(20):12662–12668. doi: 10.1074/jbc.273.20.12662. [DOI] [PubMed] [Google Scholar]
- 42.Krumschnabel G., Fontana-Ayoub M., Sumbalova Z., et al. Simultaneous high-resolution measurement of mitochondrial respiration and hydrogen peroxide production. Methods in Molecular Biology. 2015;1264:245–261. doi: 10.1007/978-1-4939-2257-4_22. [DOI] [PubMed] [Google Scholar]
- 43.Serrano J., Jové M., Boada J., Bellmunt M. J., Pamplona R., Portero-Otín M. Dietary antioxidants interfere with Amplex Red-coupled-fluorescence assays. Biochemical and Biophysical Research Communications. 2009;388(2):443–449. doi: 10.1016/j.bbrc.2009.08.041. [DOI] [PubMed] [Google Scholar]
- 44.Brand M. D., Nicholls D. G. Assessing mitochondrial dysfunction in cells. Biochemical Journal. 2011;435(2):297–312. doi: 10.1042/BJ20110162. [DOI] [PMC free article] [PubMed] [Google Scholar]
- 45.Orr A. L., Ashok D., Sarantos M. R., Shi T., Hughes R. E., Brand M. D. Inhibitors of ROS production by the ubiquinone-binding site of mitochondrial complex i identified by chemical screening. Free Radical Biology and Medicine. 2013;65:1047–1059. doi: 10.1016/j.freeradbiomed.2013.08.170. [DOI] [PMC free article] [PubMed] [Google Scholar]
- 46.Weng Z., Zhou P., Salminen W. F., et al. Green tea epigallocatechin gallate binds to and inhibits respiratory complexes in swelling but not normal rat hepatic mitochondria. Biochemical and Biophysical Research Communications. 2014;443(3):1097–1104. doi: 10.1016/j.bbrc.2013.12.110. [DOI] [PubMed] [Google Scholar]
- 47.Gnaiger E. Capacity of oxidative phosphorylation in human skeletal muscle: new perspectives of mitochondrial physiology. International Journal of Biochemistry and Cell Biology. 2009;41(10):1837–1845. doi: 10.1016/j.biocel.2009.03.013. [DOI] [PubMed] [Google Scholar]
- 48.Hepple R. T. Mitochondrial involvement and impact in aging skeletal muscle. Frontiers in Aging Neuroscience. 2014;6, article no. 211 doi: 10.3389/fnagi.2014.00211. [DOI] [PMC free article] [PubMed] [Google Scholar]