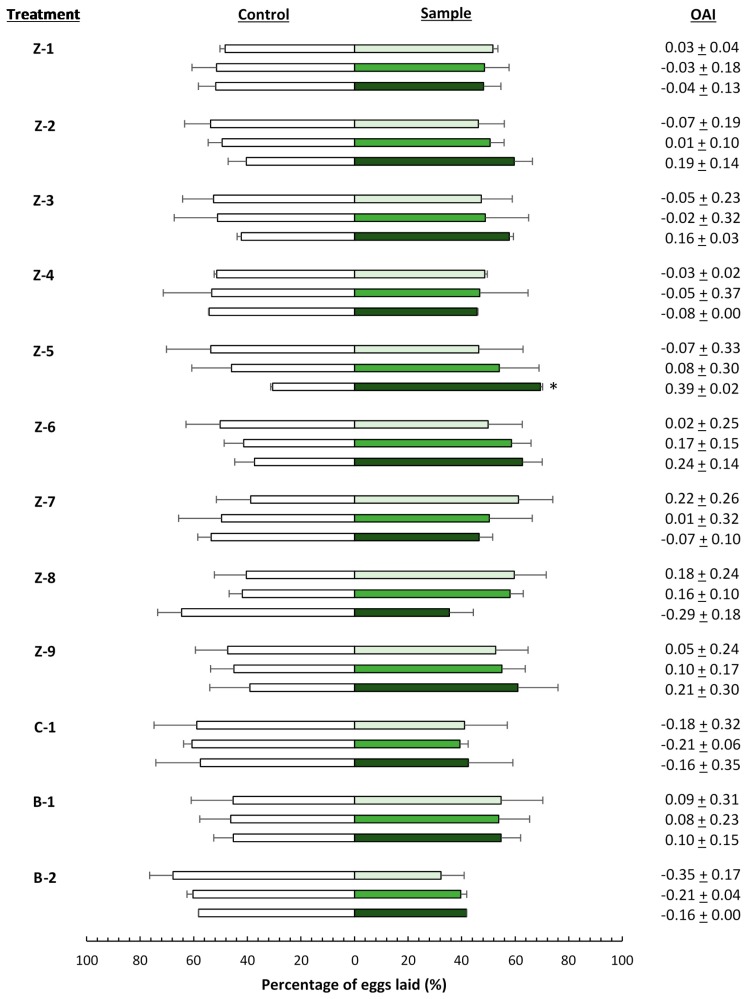
Figure 2.
Oviposition response of Tuta absoluta to plants treated with different concentrations of the insecticide materials (Table 1). White bars indicate the mean percentage of eggs laid on control leaves, green bars indicate the mean percentage of eggs laid on leaves treated with a concentration of 400 ( ), 4000 (
 ), and 20,000 (
 ) mg·L−1. Asterisks indicate significant differences (p < 0.05) in oviposition activity between treated and control leaves (n = 4). OAI: oviposition activity index.

