Abstract
The duration of action of adenosine A2A receptor (A2A) agonists is critical for their clinical efficacy, and we sought to better understand how this can be optimized. The in vitro temporal response profiles of a panel of A2A agonists were studied using cAMP assays in recombinantly (CHO) and endogenously (SH-SY5Y) expressing cells. Some agonists (e.g., 3cd; UK-432,097) but not others (e.g., 3ac; CGS-21680) demonstrated sustained wash-resistant agonism, where residual receptor activation continued after washout. The ability of an antagonist to reverse pre-established agonist responses was used as a surrogate read-out for agonist dissociation kinetics, and together with radioligand binding studies suggested a role for slow off-rate in driving sustained effects. One compound, 3ch, showed particularly marked sustained effects, with a reversal t1/2 > 6 hours and close to maximal effects that remained for at least 5 hours after washing. Based on the structure-activity relationship of these compounds, we suggest that lipophilic N6 and bulky C2 substituents can promote stable and long-lived binding events leading to sustained agonist responses, although a high compound logD is not necessary. This provides new insight into the binding interactions of these ligands and we anticipate that this information could facilitate the rational design of novel long-acting A2A agonists with improved clinical efficacy.
Introduction
The adenosine receptors are G protein-coupled receptors (GPCRs) that comprise four subtypes (A1, A2A, A2B, and A3) and mediate the physiologic effects of their endogenous agonist adenosine. The adenosine A2A receptor (A2A) is coupled to the stimulatory G protein (Gαs) and signals through cAMP pathways (Zezula and Freissmuth, 2008). A2A has a wide tissue distribution and plays many important roles such as in vasodilation, inflammation, and regulating neurotransmitter release (de Lera Ruiz et al., 2014). As a primary target of caffeine, A2A is involved in adenosine’s control of wakefulness (Chen et al., 2013).
A2A is an important drug discovery target. The A2A-selective agonist regadenoson is used clinically as a pharmacological stress agent for myocardial imaging (Chen et al., 2013). A2A agonists have anti-inflammatory properties and are thus targeted for the potential treatment of chronic obstructive pulmonary disease, asthma, allergic rhinitis, sickle cell disease, and wound healing, among others, with a number of compounds (e.g., UK-432,097; compound 3cd in Table 1) reaching clinical trials (Mantell et al., 2010; Field et al., 2013). The A2A agonist BVT.115959 has also been in trials for diabetic neuropathic pain (Gao and Jacobson, 2011). Owing to its role in brown adipose activation, A2A agonism was also recently postulated as an obesity therapy (Gnad et al., 2014). Numerous potent and selective A2A agonists have been developed, and these typically maintain an adenosine structural scaffold with various substitutions on the C2 and N6 positions of the molecule (de Lera Ruiz et al., 2014) (Table 1). Crystal structures of agonist-bound A2A have been solved, providing insight into the molecular mechanisms of receptor function (Lebon et al., 2011, 2015; Xu et al., 2011).
TABLE 1.
Summary of the compounds investigated in this study
All the ligands have an adenosine scaffold, with substitution on the ribose 4 position (R1), N6 (R2), and/or C2 (R3). Otsuka-3 is an exception, because it does not share this structural scaffold. The individual structures of each compound are shown in Supplemental Fig. 1. References for compound disclosure; 1, (Marumoto et al., 1974); 2, (Bridges et al., 1987); 3, (Åstrand et al., 2015); 4, (Sato et al., 2010). AZ proprietary compounds are marked # and their synthesis is described in Supplemental Figs. 1–6. 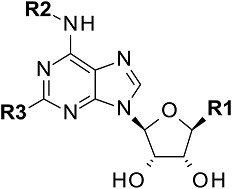
| Compound number | Synonym | Ref. | R1 | R2 | R3 |
|---|---|---|---|---|---|
| 1aa | CV1808 | 1 | H | H |  |
| 2bb | R-PIA | 2 | CH2OH | CH(R-Me)CH2Ph | H |
| 2cb | 2 | CH2OH | CH2CHPh2 | H | |
| 3ab | NECA | CONHEt | H | H | |
| 3ac | CGS-21680 | CONHEt | H | 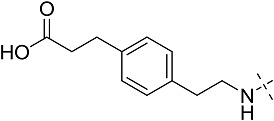 |
|
| 3ad | # | CONHEt | H | 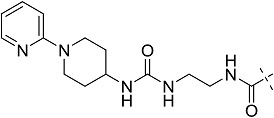 |
|
| 3cd | UK-432,097 | CONHEt | CH2CHPh2 | 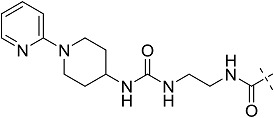 |
|
| 3ce | # | CONHEt | CH2CHPh2 |  |
|
| 3cf | # | CONHEt | CH2CHPh2 | 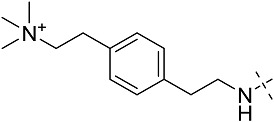 |
|
| 3ag | # | CONHEt | H |  |
|
| 3cg | 3 | CONHEt | CH2CHPh2 |  |
|
| 3dg | # | CONHEt | CH2CH(CH3)2 |  |
|
| 3eg | # | CONHEt | CH(CH2CH3)2 |  |
|
| 3ah | # | CONHEt | H |  |
|
| 3ch | 3 | CONHEt | CH2CHPh2 |  |
|
| 3dh | # | CONHEt | CH2CH(CH3)2 |  |
|
| 3eh | # | CONHEt | CH(CH2CH3)2 |  |
|
| 4 | Otsuka-3 | 4 | * |
Duration of action is a key property for targeting a desirable clinical response profile for A2A agonists. To achieve a better safety profile, short-lived activity has been optimized for ligands developed as intravenous myocardial imaging agents (Cerqueira, 2004). On the other hand, A2A agonists developed for the treatment of chronic inflammatory diseases, such as UK-432,097, have been targeted for local drug delivery to minimize side effects (Mantell et al., 2010). A long duration of target activity alongside appropriate physicochemical properties to aid tissue retention has been suggested to help achieve efficacy through topical application (Mantell et al., 2010). Therefore, for A2A drug discovery programs it is critical to increase our understanding of the temporal response profiles of drug candidates and the mechanisms through which long/short duration of action can occur. Optimizing ligand binding kinetics has been advocated as a valuable strategy for achieving appropriate duration of action and target coverage (Copeland et al., 2006; Guo et al., 2014; Hothersall et al., 2016). Specifically, slow A2A agonist dissociation kinetics have been cited as a potential mechanism to achieve a desirable clinical response for topically applied drugs (Mantell et al., 2010). This approach may be especially relevant for A2A where the receptor has been shown to signal without agonists inducing desensitization and internalization in recombinant systems as well as in physiologic settings (Abbracchio et al., 1992; Adami et al., 1995; Charalambous et al., 2008; Zezula and Freissmuth, 2008; Baines et al., 2011), so long-lived agonist responses are possible.
In this study, we have assessed the temporal response profiles of a range of A2A agonists in a recombinant (CHO cell) and endogenous (SH-SY5Y cell) expression system. In washout experiments, sustained receptor activation was observed for some, but not all, agonists tested. Our evidence points toward a predominant role for slow agonist off-rate in driving wash-resistant responses. Coupled with structure-activity relationships (SAR) for sustained effects, we can begin to define the ligand-specific binding interactions that promote stable and long-lived binding interactions and hence persistent receptor activation.
Materials and Methods
Materials.
Cell culture materials were from Life Technologies (Paisley, UK) and Sigma Aldrich (Dorset, UK). GloSensor 22F plasmid and luciferin were from Promega (Southampton, UK). Homogenous time-resolved fluorescence (HTRF) dynamic cAMP kits were from Cisbio (Codolet, France). Assay plates were from Greiner Bio One (Stonehouse, UK). Adenosine and bovine spleen adenosine deaminase (type X) were from Sigma Aldrich. Immobilized artificial membrane chromatography columns were from Regis Technologies (Morton Grove, IL). [3H]ZM-241385 (specific activity 28.4 Ci/mmol) was from American Radiolabeled Chemicals Inc. (St. Louis, MO). Rolipram, CGS-21680 (2ac), NECA (3ab), and LUF5834 were from Tocris (Bristol, UK). All other compounds were synthesized at WuXi PharmaTech (Shanghai, China) or BioDuro (Beijing, China). The syntheses of new chemical entities are described in Supplemental Figs. 1–6.
Cell Culture.
CHO-K1 cells were cultured in Ham’s F-12 medium supplemented with 10% fetal calf serum (FCS) in an atmosphere of 5% CO2 at 37°C. Parental CHO cells were grown in medium supplemented with 100 U/ml penicillin and 100 μg/ml streptomycin. CHO cells stably expressing human A2A (CHO-A2A) were grown in medium supplemented with 800 μg/ml G-418. CHO cells stably expressing human A2B (CHO-A2B) were grown in medium supplemented with 200 μg/ml hygromycin B. CHO cells stably expressing both human A2A and GloSensor 22F were grown in medium supplemented with 800 μg/ml G-418 and 200 μg/ml hygromycin B. HEK293 cells stably expressing human A2A (HEK-A2A) were grown in Dulbecco’s modified Eagle’s medium supplemented with 10% FCS, 50 μg/ml streptomycin, 50 U/ml penicillin, and 500 μg/ml G-418 in an atmosphere of 7% CO2 at 37°C. SH-SY5Y cells were grown in a 1:1 mixture of Ham’s F-12 and Dulbecco’s modified Eagle’s medium supplemented with 15% FCS, 1% nonessential amino acids, 1 mM l-alanyl-l-glutamine, 100 U/ml penicillin, and 100 μg/ml streptomycin in an atmosphere of 5% CO2 at 37°C.
Real-time cAMP Assay.
GloSensor 22F (Promega) was used to monitor real-time cAMP responses. CHO cells stably expressing both A2A and GloSensor 22F plasmid (clonal isolates) were seeded into white-bottomed tissue-culture treated 384-well plates at 15,000 cells per well and grown for approximately 24 hours. Culture medium was then replaced with assay buffer (Hank’s buffered saline solution + 20 mM HEPES + 10% FCS + 0.8 U/ml adenosine deaminase, pH 7.4) supplemented with 612 μg/ml endotoxin-free beetle luciferin, and cells were incubated at room temperature for 2 hours. Ten times concentrated test compound was then manually added and luminescence responses measured every 3.25 minutes over the indicated time period at room temperature using an Envision plate reader (Perkin Elmer, Waltham MA). In reversal experiments, a second addition of antagonist was made in the same way.
Endpoint cAMP Assay.
The endpoint cellular cAMP assay used the homogenous time-resolved fluorescence (HTRF) Dynamic competitive immunoassay kit (Cisbio), and methods were adapted from the manufacturer’s instructions. Common to all endpoint experiments, after cell treatment with compound(s), a 10 µl sample was added per well to a black-bottomed 384-well plate. Dye-labeled cAMP followed by anti-cAMP antibody (5 μl/well each, diluted in lysis buffer) were then added and the plate was incubated at room temperature for 1–16 hours. To construct a standard curve, samples of known cAMP concentration were also incubated in the same way. Fluorescence was then read at 665 and 620 nm using an Envision plate-reader, and a 665/620 ratio derived. Cellular cAMP concentration was calculated by comparing these values (normalized to background fluorescence) to the standard curve for each plate.
In washout experiments, suspensions of cells were treated with compound and the cells were then physically isolated from the original treatment vessel to remove nonspecific effects of compound interactions with plastic. In 15 ml tubes, 2,400,000 cells per tube were resuspended in 100 µl of assay buffer (Hank’s buffered saline solution + 20 mM HEPES + 0.01% bovine serum albumin + 0.8 U/ml adenosine deaminase, pH 7.4) containing test compound and incubated for 2 hours at 37°C. This volume was used to minimize the contact area of compound with plastic surfaces. After treatment, the buffer was then completely removed by centrifugation (two cycles of spinning at 300 g for 5 minutes to pellet cells and remove liquid) and cells were resuspended in 50 μl of fresh buffer and subsequently transferred to a fresh tube containing 12 ml of drug-free buffer. This was repeated to give three cycles of washing in three fresh tubes to remove the cells from any plastic surfaces that had been exposed to a significant concentration of test compound. Cells were incubated in the final tube for 1 hour at 37°C to allow putative dissociation of compounds from the receptor. Cells were then pelleted and resuspended in 2 ml buffer, transferred to 1.5 ml tubes, and then exposed to 40 μM rolipram (1:1 dilution of cells) for 45 minutes at 37°C to capture cAMP accumulation. Aliquots (10 μl) of each cell suspension were then added to HTRF assay plates, as described above.
For antagonist reversal experiments performed with the endpoint cAMP assay, cells adhered to collagen-coated 96-well plates were used. Cells were seeded at 20,000 cells/well (for CHO cells) or 40,000 cells/well (for SH-SY5Y cells) in culture media and grown for approximately 24 hours. Cells were then treated with test compound in 50 µl assay buffer (Hank’s buffered saline solution + 20 mM HEPES + 0.8 U/ml adenosine deaminase, pH 7.4) for the indicated time. Antagonist or vehicle control was then directly added to the wells for the indicated period to follow a time course of antagonist reversal. Signaling was terminated by removing the assay buffer and replacing it with ice-cold lysis buffer (100 µl PBS + 1 M potassium fluoride + 1% Triton X-100, pH 7.00) to capture the total cellular cAMP pool at that moment in time without phosphodiesterase inhibitor. This step also served to remove putative secreted cAMP from the measurements. After incubation for >30 minutes at room temperature with shaking to extract cAMP, a sample of cell lysate (10 µl) from each well was added to a corresponding well in a HTRF assay plate.
[3H]ZM-241385 Radioligand Binding Studies.
Motulsky-Mahan kinetic competition binding experiments were performed by measuring the association rate of [3H]ZM-241385 in the presence of test ligand in membranes prepared from HEK-A2A, as described previously for this receptor (Guo et al., 2012). To measure occupation of the binding site in washout experiments, 20 μg of membranes were incubated with test compound in a volume of 400 μl for 1 hour at 37°C. Membranes were then pelleted by centrifugation at 16,100 g for 2 minutes and resuspended in 2 ml fresh assay buffer and transferred to a fresh tube and incubated for 10 minutes on ice. This was repeated three times to wash the membranes in fresh buffer. Membranes were then resuspended in 400 μl assay buffer containing 3 nM [3H]ZM-241385 and incubated for 30 minutes at 37°C to label unoccupied A2A binding sites.
Immobilized Artificial Membrane Chromatography.
Immobilized artificial membrane (IAM) chromatography experiments were conducted to measure the relative phospholipophilicity (log KIAM) of each of the compounds since the monolayers of phosphatidlycholine stationary phase on a silica surface effectively mimic the lipid environment found in cell membranes (Ong et al., 1995; Pidgeon et al., 1995) and as such is a parameter used to measure the partitioning of compounds to fluid membranes. Test compounds (5 μl injections of 10 mM solutions in dimethylsulfoxide) were separated on a Regis IAM PC DD2 (100 × 4.6 mm) column preceded by an IAM PC DD2 10/300 guard column, both maintained at 50°C and eluted with 50 mM ammonium acetate (pH 7.4 adjusted with ammonium hydroxide) (solvent A) and acetonitrile (solvent B) at a flow rate of 1.0 ml/min, using a linear gradient (Agilent 1200 series binary pumps, autosampler and temperature control units, Agilent Technologies Ltd., Stockport, UK). Initial conditions started at 0% B, which was increased to 100% B over 6 minutes, where it was held for a further 0.5 minute, before returning to 0% B over the next 0.5 minute, at which it was held for a further 2 minutes before the subsequent injection. Detection was by means of ultraviolet absorption between wavelengths of 254 and 360 nm (0.1 minute peak width, 2 second response time) via an Agilent 1200 series diode array detector (Agilent Technologies Ltd.). The retention factor log KIAM was obtained by calculating log[(tR-t0)/t0], where tR was the retention time of the ultraviolet peak on the gradient and t0 the corresponding column void volume time for each acquisition (n = 3, average %CV = 0.17). The equilibrium partition coefficient log KIAM was subsequently determined by multiplying by a chromatographic hydrophobicity index for immobilized artificial membrane chromatography at pH 7.4 (CHI IAM7.4), the latter measured for a diverse set of β-adrenergic compounds and normalized to the values obtained previously (Sykes et al., 2014).
LogD7.4 Measurements.
Lipophilicity measurements were undertaken by calculating the distribution coefficients between 1-octanol and aqueous buffer at pH 7.4, with the system being validated using three quality control compounds (high, moderate, and low logD7.4) and an internal standard (verapamil) all with established logD7.4 values. Liquid transfers were performed using a Beckman robot (Beckman Biomek FX, Beckman Coulter UK, High Wycombe, UK). Four separate dilutions of all phosphate buffer and 1-octanol samples were analyzed and evaluated to arrive at the measured logD7.4 value. Compounds in 10 mM DMSO solutions were subjected to the shake flask technique whereby equal parts of a phosphate buffer (10 mM) and 1-octanol were vigorously mixed in a separation funnel three times (at least 15 minutes between each mixing) to saturate the solutions. The mixture was left overnight to separate the upper octanol phase from the lower buffer phase before liquid chromatography (Waters Acquity UPLC, Milford, MA) separation and mass spectrometry analysis on a triple quadrupole mass spectrometer (Waters Micromass TQS running MassLynx 4.1) where the components were separated using an Waters Acquity UPLC HSS T3 1.8 μm, 2.1 × 50 mm column. Calculated logD7.4 values were dependent on 1-octanol solubility as well as mass spectrometry responses and typical values vary between 0 and 4.
Results
Sustained Wash-resistant A2A Agonist Responses.
We examined the potential for ligand-specific effects on the durability of A2A cAMP signaling in CHO-A2A cells. A panel of 18 A2A agonists were chosen from previously disclosed compounds or those from the AstraZeneca compound library, as summarized in Table 1 (individual compound structures are shown in Supplemental Fig. 1). Agonist potency was determined by concentration-response analysis (sample curves shown in Supplemental Fig. 2) using the GloSensor cAMP assay, and physicochemical properties of the compounds were also analyzed (logD7.4 and artificial membrane partitioning co-efficient log KIAM), as compiled in Table 2.
TABLE 2.
Summary data for A2A agonist pharmacology, physicochemical properties, and antagonist reversal rate
pEC50 is derived from concentration-response curves using the GloSensor cAMP assay (Sample curves in Supplemental Fig. 2) measured at 20°C for 100 minutes. LogD7.4 and log KIAM are experimentally measured physicochemical properties used as indicators of, respectively, lipophilicity and membrane partitioning. Antagonist reversal t1/2 to estimated agonist off-rate was derived from normalized antagonist reversal curves (one-phase exponential decay) shown in Fig. 3. Curves were constrained to give a minimal response of “0” as incomplete reversal observed over the time-course. Accurate reversal t1/2 values were difficult to derive for THESE data, but we can say with confidence that t1/2 > 100 minutes. pEC50 values and reversal half-life estimates are an average of 3 or 4 experiments performed in triplicate.
| Compound | pEC50 | logD7.4 | log KIAM | Antagonist Reversal t1/2 (min) |
|---|---|---|---|---|
| 1aa | 7.30 ± 0.19 | 0.6 | 1.13 | 5.50 ± 0.28 |
| 2bb | 6.16 ± 0.13 | N.T. | N.T. | 8.14 ± 1.07 |
| 2cb | 5.97 ± 0.19 | 2.6 | 2.31 | 4.48 ± 0.50 |
| 3ab | 7.52 ± 0.06 | −0.3 | −0.57 | 5.80 ± 0.25 |
| 3ac | 7.18 ± 0.14 | < -0.8 | −0.09 | 8.99 ± 0.19 |
| 3ad | 5.70 ± 0.21 | 0.3 | 0.86 | 5.02 ± 0.37 |
| 3cd | 8.32 ± 0.07 | 3.6 | 2.38 | 39.99 ± 4.41 |
| 3ce | 6.74 ± 0.17 | 1.9 | 3.35 | 6.50 ± 0.85 |
| 3cf | 5.91 ± 0.04 | 0.1 | 2.74 | 9.44 ± 3.28 |
| 3ag | 7.53 ± 0.06 | < -0.1 | 0.51 | 10.56 ± 0.91 |
| 3cg | 9.04 ± 0.09 | 3.5 | 2.56 | *309 ± 124 |
| 3dg | 9.01 ± 0.13 | 1.8 | 1.86 | 38.29 ± 4.80 |
| 3eg | 9.84 ± 0.05 | 2.25 | 2.08 | 63.34 ± 3.12 |
| 3ah | 7.79 ± 0.08 | < -1 | 0.66 | 11.31 ± 1.60 |
| 3ch | 9.89 ± 0.10 | 0 | 2.87 | *417 ± 86 |
| 3dh | 9.35 ± 0.10 | < -1.1 | 2.21 | 39.15 ± 9.84 |
| 3eh | 9.48 ± 0.22 | −0.7 | 2.42 | *151 ± 32 |
| 4 | 7.93 ± 0.17 | 0 | 2.21 | 6.25 ± 0.72 |
N.T., not tested.
Sustained effects were investigated in washout experiments after chronic agonist treatment, as determined by residual cAMP responses that persist after removal of free agonist by infinite dilution. Because a propensity for GPCR ligands to nonspecifically interact with plastic assay plates can prevent complete washout from the experimental system and thus confound the interpretation of sustained effects (Palmgren et al., 2006; Wennerberg et al., 2010), we designed experiments to avoid this phenomenon. This was achieved by physically isolating agonist pretreated cells from their original treatment vessel. Suspensions of cells were first stimulated with test agonist in tubes (equipotent 20× EC90 concentrations, 2 hours, 37°C), then washed three times by centrifugation and resuspension in fresh buffer, each time being transferred to a fresh tube. After a subsequent incubation in fresh buffer to allow putative dissociation of ligand (1 hour, 37°C) residual cAMP accumulation responses with the inclusion of a phosphodiesterase inhibitor (40 µM rolipram) were measured using an endpoint HTRF assay. Parallel compound pre-treated cells were also subsequently directly exposed to a maximal concentration (20× EC90) of the A2A agonist UK-432,097 (compound 3cd) during the phosphodiesterase inclusion period to determine acute receptor responsiveness.
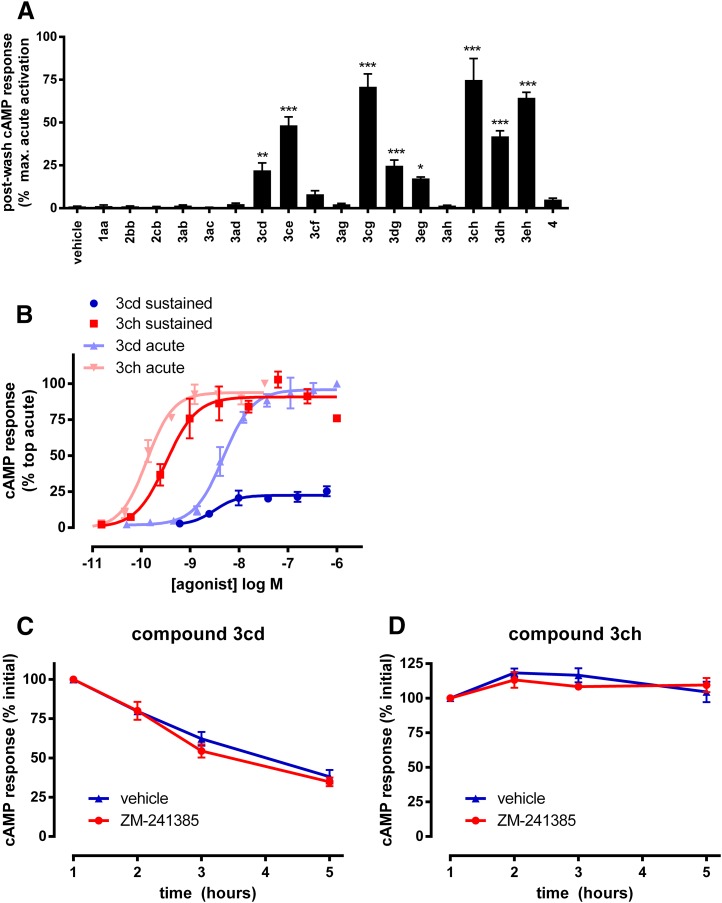
Cells pretreated with 3cd, 3ce, 3cg, 3dg, 3eg, 3ch, 3dh, and 3eh demonstrated significantly increased cAMP accumulation compared with cells pretreated with vehicle control (P < 0.05, 0.01, or 0,001; ANOVA Dunnett’s posttest; n = 3–5; Fig. 1A). In contrast, the effects of 1aa, 2bb, 2cb, 3ab, 3ac, 3ad, 3cf, 3ag, 3ah, and 4 were readily removed by washing as pre-exposure with these compounds did not elicit a residual response and cellular cAMP levels returned to baseline (Fig. 1A). Therefore, sustained wash-resistant agonism occurred for some, but not all, of the compounds tested, highlighting the potential for ligand-specific factors that can regulate duration of action. The magnitude of residual postwash responses relative to maximal receptor activation measured by direct exposure to agonist was varied, with 3cg, 3ch, and 3eh pretreated cells reaching >70%, whereas 3cd, 3dg, and 3eg pretreated cells were limited to <25% (Fig. 1A).
Fig. 1.
Sustained wash-resistant A2A agonist response measured by physically isolating agonist pre-treated cells from the original treatment vessel. (A) Cells were pre-treated with 20× EC90 concentrations of each agonist for 2 hours before washout and incubation in drug-free buffer for 1 hour (37°C) and measurement of cAMP capture by subsequent inclusion of rolipram. Sustained cAMP responses are normalized to acute responses (20× EC90 of 3cd) measured in parallel in the same population of pre-treated cells. *P < 0.05, **P < 0.01; ***P < 0.001 determined by ANOVA with Dunett’s post-test compared with vehicle control pretreated cells. (B) Concentration-responses analysis of postwash residual effects of 3cd (blue circles) and 3ch (red squares). Cells were pretreated with the indicated concentrations of agonist before residual cAMP response measured after washout. Responses are normalized to acute responses by direct application of 3cd. For direct comparison, the acute pharmacological responses of 3cd (light blue triangles) and 3ch (light red triangles) in the GloSensor cAMP assay are shown alongside. (C and D) Time course of sustained responses after pretreatment with EC90 concentrations of 3cd (C) or 3ch (D) after washout, with (red circles) or without (blue triangles) subsequent inclusion of antagonist (100 nM ZM-241385) for the indicated time. Responses are normalized to responses measured at 1 hour postwash. Data represent an average ± S.E.M. of 3–5 experiments performed in triplicate.
Further experiments investigated the wash-resistant effects of compounds 3cd and 3ch in more detail. Concentration-response analysis was performed by measuring postwash cAMP responses after pretreatment with a concentration range of each compound (2 hours, 37°C) followed by a 1-hour recovery period. These analyses (Fig. 1B) yielded an EC50 of 3.13 ± 3.99 and 0.31 ± 0.07 nM for 3cd and 3ch, respectively, which were well matched to potency values estimated with direct (no wash) stimulation of the receptor (Fig. 1B; Table 2). The postwash concentration-response curves also yielded Emax values for 3cd and 3ch, respectively, of 25.59 ± 6.32 and 93.03 ± 8.55% of responses achieved with direct maximal receptor activation, further confirming the difference between these ligands in the magnitude of sustained wash-resistant responses.
Next, the durability of postwash responses after application of a single concentration (EC90) of each agonist were compared in time course experiments over a 5-hour recovery period (at 37°C) (Fig. 1, C and D). Parallel agonist pretreated cells were also exposed to excess A2A antagonist (100 nM ZM-241385) after washout over this time to investigate ligand rebinding, because this is a potential mechanism for prolonged receptor effects (Vauquelin and Charlton, 2010). Washing alone causes "infinite dilution" of unbound ligand and thus any ligand that remains is either receptor bound or capable of rebinding (i.e., not effectively removed from the vicinity of the receptor). The same is true for washing plus antagonist, although the effect of rebinding is removed because free receptor sites are occupied and only prebound agonist can evoke a response. Responses to 3cd were gradually lost over a number of hours, although 38.01 ± 7.37% of initial responses still remained after 5 hours (Fig. 1C). Because there was little effect of antagonist, rebinding does not play a role, suggesting instead that slow dissociation kinetics are the primary cause for slow loss of response. This is consistent with the drop in Emax alongside minimal change in potency in postwash concentration-response curves because for each applied concentration there is a time-dependent decrease in response but the relative difference in effect between the applied concentrations is preserved because dissociation rate is concentration independent. In contrast, responses to 3ch were markedly stable, with little loss of receptor function observed after 5 hours and no effect of antagonist (Fig. 1D). This observation, coupled with the lack of change in potency or maximal effect in postwash concentration-response curves suggests that the sustained effect of 3ch is predominantly a consequence of preformed binding events that persist over the time course of the experiments because of a very slow off-rate.
GloSensor Reversal Assay to Estimate Agonist Dissociation Kinetics.
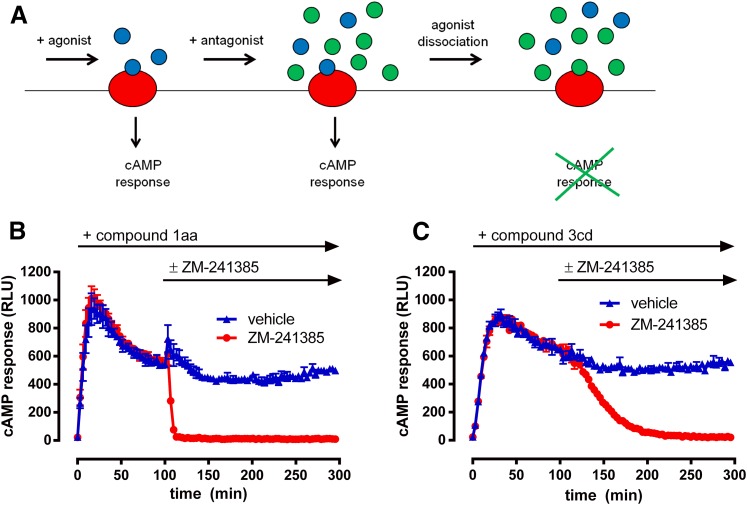
The most straightforward explanation for sustained wash-resistant agonist responses is slow ligand dissociation kinetics (Hothersall et al., 2016). We therefore assessed agonist off-rates using the real-time GloSensor cAMP assay by monitoring antagonist mediated reversal of pre-established agonist responses. Based on the notion that antagonist reversal involves competitive displacement of agonist molecules and therefore requires agonist dissociation, reversal rate is a surrogate read-out for agonist dissociation rate (explained pictorially in Fig. 2A). This offers a novel, straightforward, and relatively high-throughput methodology to investigate agonist binding kinetics in whole cells.
Fig. 2.
Explanation and demonstration of the GloSensor reversal assay used to estimate agonist dissociation rate. (A) Schematic cartoon describing the system. Cells are first incubated with agonist (blue circles) to permit assumed equilibrium binding to receptors (red circles), which generates a relatively stable cAMP response. Excess antagonist (green circles) is then directly added to the cells. Upon dissociation of the agonist from the receptor, antagonist then occupies the binding site and prevents further activation by the agonist. This causes cessation of cAMP responses, at a rate that is dependent upon agonist dissociation kinetics. (B and C) Sample GloSensor reversal traces for 1aa (B) and 3cd (C) demonstrate that reversal rate is agonist dependent. Upon incubation of agonist (EC90) and generation of relatively stable cAMP responses for 100 minutes, addition of vehicle control (blue triangles) has little effect on responses for a further 200 minutes. However, addition of antagonist at 100 minutes (red circles; 100 nM ZM-241385) causes a complete reversal of cAMP response to basal levels. 1aa reversal is faster, consistent with a more rapid off-rate compared with 3cd. Data represent an average of three experiments performed in triplicate.
Cells were incubated with equipotent concentrations of agonist (EC90), and real-time responses were measured at room temperature until a relatively stable plateau response was reached (100 minutes). Excess antagonist (100 nM ZM-241385) or vehicle was then directly added and subsequent responses continually measured. Sample traces for 1aa and 3cd are shown in Fig. 2, B and C and illustrate that, upon antagonist addition, cAMP responses decreased to baseline levels, consistent with complete displacement of agonist. Comparing the traces for these two compounds shows clear differences in reversal rate, consistent with differential dissociation kinetics.
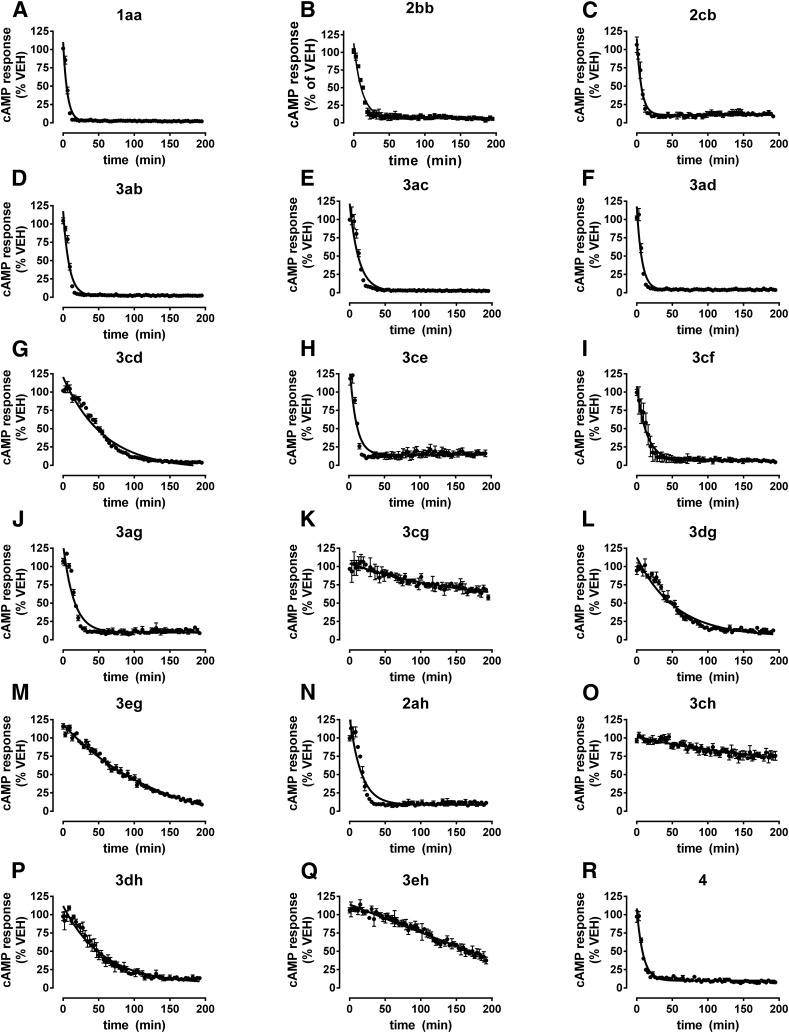
To quantify reversal rates, responses in antagonist-treated cells were normalized to vehicle control at each time point (% VEH) and nonlinear regression (one-phase exponential decay) was performed. The reversal traces (Fig. 3) and best-fit reversal t1/2 values (Table 2) for our agonist panel revealed strong ligand-specific differences. 3cg, 3ch, and 3eh had very slow apparent kinetics, with incomplete reversal over the measurement time course. Accurate reversal half-lives were therefore hard to quantify for these compounds, although we can state with confidence that they were greater than 200 minutes. 3cd, 3dg, 3eg, and 3dh were completely reversed by antagonist but still had slow reversal rates with t1/2 > 38 minutes. The remaining compounds showed rapid reversal with t1/2 values < 11.5 minutes, and the most rapidly reversed compound was 2cb (t1/2 = 4.48 ± 0.50 minutes).
Fig. 3.
Normalized GloSensor reversal traces for a sample of eighteen A2A agonists at 20°C. (A–R) Stable responses were generated to each agonist applied at an EC90 concentration (100 minutes, 20°C) before antagonist (100 nM ZM-241385) or vehicle was applied for 200 minutes (20°C). Data points represent antagonist-treated responses expressed as a percentage of vehicle control for each time point to display reversal rate traces over the postantagonist period. Best-fit lines represent nonlinear regression one-phase exponential decay from the average ± S.E.M. of three experiments performed in triplicate. For example, plots (C) and (D) represent normalized data from Figs. 2B and 4C, respectively.
Importantly, ZM-241385 was able to competitively antagonize agonist responses in this assay when cells were preincubated with the antagonist before addition of 3cd or 3ch at relevant concentrations (Supplemental Fig. 3, A and B), demonstrating that a slow or absent reversal effect is not due to an inability of ZM-241385 to antagonize the responses. Moreover, consistent results were obtained when the endpoint cAMP assay was used to measure reversal rates (Supplemental Fig. 3, C and D), suggesting that the GloSensor system is an accurate measure of cellular cAMP fluxes.
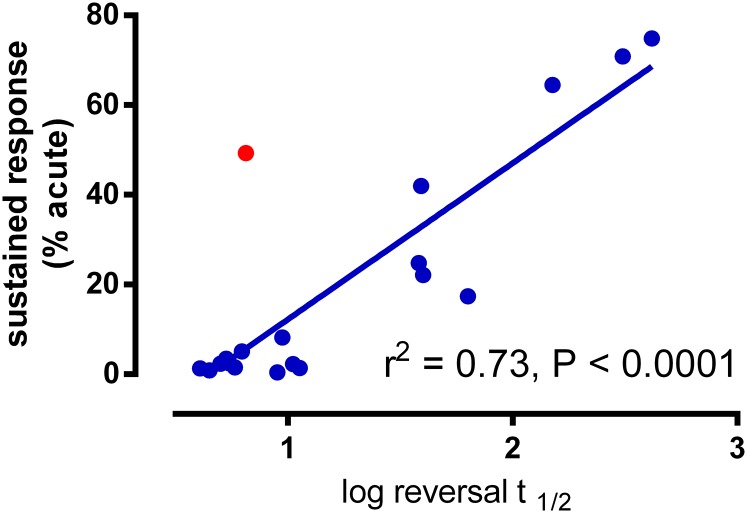
In general, agonists that displayed sustained wash-resistant effects were characterized by slow GloSensor reversal rates, which further supported our hypothesis that persistent responses can be driven by slow dissociation kinetics. There appeared to be a hyperbolic relationship between GloSensor reversal rates and the magnitude of wash-resistant responses determined with equipotent agonist concentrations. We therefore examined the relationship between the log t1/2 values and postwash responses and observed a linear relationship with a reasonable correlation (r2 = 0.73; P < 0.0001; n = 18 ligands; Fig. 4). Compound 3ce was a clear outlier in this analysis because it has a sustained effect but is rapidly reversed by the antagonist, and when removed the correlation improved greatly (r2 = 0.89). Intriguingly, the rapid reversal of 3ce was unique to experiments that used ZM-241385, because an alternative reversal agent, LUF5834, was unable to fully reverse 3ce-mediated responses, which would thus categorize 3ce as a slowly dissociating compound, as expected from washout experiments (Supplemental Fig. 4A). This anomaly in our data set may point toward a probe-dependent allosteric interplay between 3ce and ZM-241385 binding and/or function. Indeed, the remaining ligands in our panel showed good correlation between reversal rates derived using the two alternative reversal agents, with 3ce being unique in its ability to discriminate between antagonists (Supplemental Fig. 4E).
Fig. 4.
Correlation of sustained wash-resistant agonist responses and the reversal rates of agonists in the GloSensor assay. Linear regression plot of log converted reversal t1/2 values (from Table 2) against sustained responses (from Fig. 1A above). Compound 3ce is represented as a red circle, to highlight that is an outlier. Data from Table 2 is plotted on the x-axis and data from Fig. 1A is plotted on the y- axis.
Radioligand Binding to Investigate the Kinetics of A2A Agonists in Membranes from HEK-A2A Cells.
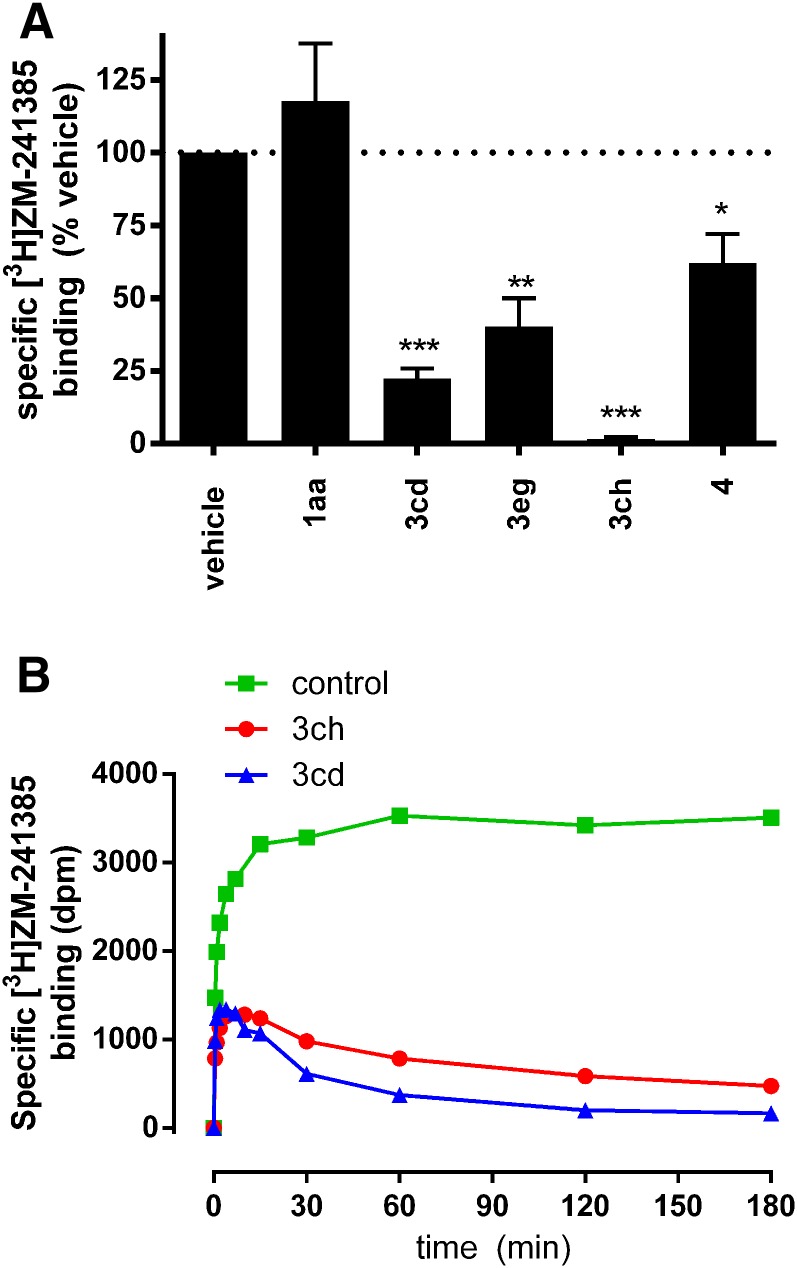
To further investigate a role for agonist off-rate in driving sustained responses, we monitored occupation of the A2A binding site after washout in radioligand binding experiments with [3H]ZM-241385 using a fresh tubes approach equivalent to our functional studies (Fig. 5A). Membranes from HEK-A2A cells pretreated with 3cd, 3eg, or 3ch (1 µM, 1 hour, 37°C) had significantly fewer available binding sites after washing than control untreated membranes (P < 0.05, 0.01, or 0.001 ANOVA with Dunnett’s posttest; n = 3), consistent with an inability to remove these ligands by washing and persistent occupation of the binding site over this time course. In contrast, 1aa, which represents an exemplar ligand without a sustained response and that is rapidly reversed by antagonist, was readily removed from the binding site by washing (P < 0.05 compared with vehicle control; ANOVA with Dunnett’s posttest; n = 3). Together these findings corroborate our cAMP reversal data and identify persistent ligand binding as an important factor for sustained effects.
Fig. 5.
[3H]ZM-241385 binding experiments. (A) Washout experiments to investigate the persistence of binding site occupation by A2A agonists. HEK-A2A membranes were incubated with 1aa, 3cd, 3eg, 3ch, or 4 (1 μM, 1 hour, 37°C) before washing. Membranes were then incubated with [3H]ZM-241385 (30 minutes, 37°C) before separation of unbound radioligand by vacuum filtration. *P < 0.05, **P < 0.01; ***P < 0.001 repeated-measure ANOVA with Dunnett’s post-test compared with untreated binding signal. (B) [3H]ZM-241385 association rate measured at room temperature under control conditions (green squares) or in the presence of 350 nM 3cd (blue triangles) or 120 nM 3ch (red circles).
We next sought to quantify A2A agonist binding kinetics using the Motulsky-Mahan competition radioligand binding with [3H]ZM-241385, as described previously for this receptor (Guo et al., 2012). Initial experiments performed at 4°C yielded residence time estimates (Supplemental Fig. 5, A and B). However, discrepancies between these values and our functional cAMP data suggested that low temperature may have caused an underestimation of residence time. Kinetic experiments were therefore performed at room temperature. Although accurate estimation of residence time is technically challenging at increased temperature, we were able to calculate a kinetic rate index (KRI), which offers a qualitative assessment of binding kinetics (Guo et al., 2013) (Fig. 5B). KRI analysis showed that 3cd and 3ch have long residence times with respective KRI values of 6.4 and 2.6, and both causing characteristic "overshoot" in [3H]ZM-241385 association curves. In summary, radioligand binding studies confirm that 3cd and 3ch have slow A2A dissociation kinetics, although the rank order of estimated off-rate is different to the functional reversal rates and may point to subtleties in the ability of these two indirect techniques to determine binding kinetics. Importantly, our data do not support a role for a change in cell background, the use of isolated membranes or a different buffer system in influencing these discrepancies (Supplemental Fig. 5, C–E).
Adenosine Receptor Specificity of Sustained Agonism.
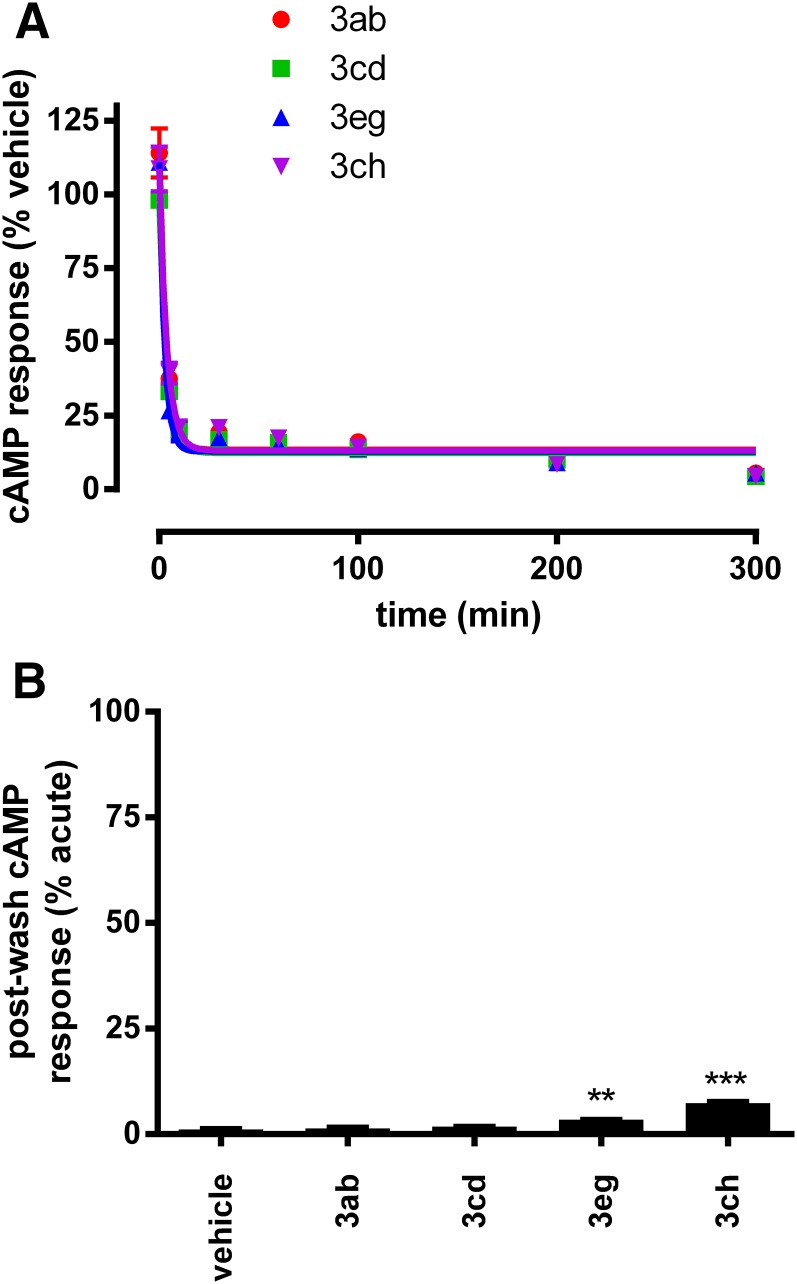
A selection of compounds were profiled at the adenosine A2B receptor using a stable CHO-A2B cell line of the same parental background, at which they demonstrated robust cAMP stimulation responses (Supplemental Fig. 6). cAMP responses to 3ab, 3cd, 3eg, and 3ch (EC90 for A2B) were rapidly reversed by antagonist (2 µM ZM-241385) with t1/2 < 3 minutes measured in the endpoint cAMP assay (Fig. 6A). Furthermore, sustained wash-resistant agonist responses were either absent (3ab and 3cd) or very weak (3eg and 3ch) at A2B (Fig. 6B). Together, these findings indicate that the slow dissociation kinetics and robust sustained agonism of these compounds are not evident at A2B, being instead A2A-specific phenomena. This suggests a predominant role for the receptor binding site rather than non-specific effects of the cellular/experimental system.
Fig. 6.
Investigating the effect of some A2A agonists at the A2B receptor. (A) Antagonist reversal of agonists at A2B using the endpoint cAMP assay. CHO-A2B cells were incubated with EC90 (at A2B) concentrations of 3ab (red), 3cd (green), 3eg (blue), or 3ch (purple) for 2 hours at room temperature before addition of antagonist (2 μM ZM-241385) or vehicle for the indicated times. Data points represent antagonist-treated cAMP responses normalized to vehicle control at each time point. Best-fit lines represent nonlinear regression one-phase exponential decay from an average ± S.E.M. of three experiments performed in triplicate. (B) Sustained agonism at in CHO-A2B cells. Sustained cAMP responses were measured in washout experiments, measuring residual cAMP responses after pretreatment of CHO-A2B cells with EC90 concentrations of 3ab, 3cd, 3eg, and 3ch. cAMP responses are normalized to acute responses (20× EC90 of NECA) measured in parallel in the same population of pretreated cells. **P < 0.01; ***P < 0.001 as determined by repeated-measure ANOVA with Dunnett’s post-test compared with responses in vehicle control pretreated cells. Data represent an average of three experiments performed in triplicate.
A2A Agonist Temporal Response Profiles in an Endogenous Expression System.
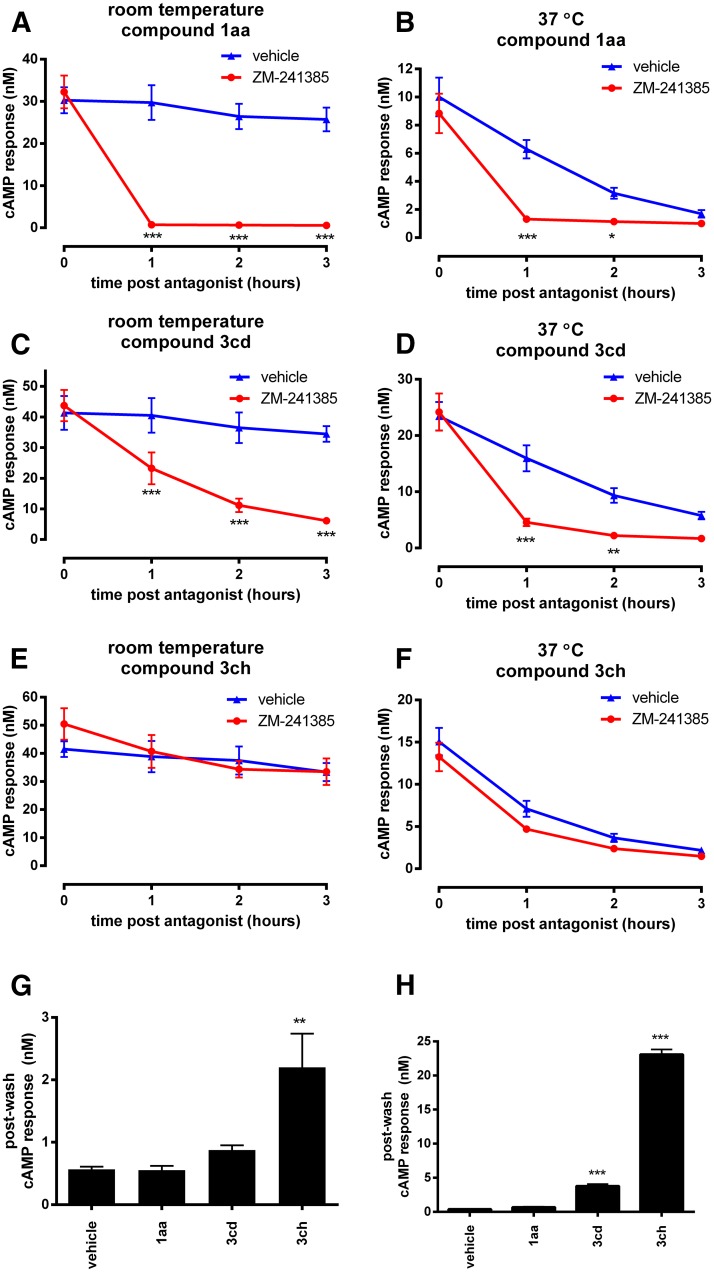
To validate the physiologic relevance of our findings, we also investigated A2A agonist responses in an endogenous receptor expression system. Human neuroblastoma SH-SY5Y cells were used as these demonstrated robust and predominantly A2A-mediated cAMP responses, based on the high potency of 1aa, 3cd, and 3ch, and their sensitivity to an A2A-selective antagonist (Supplemental Fig. 7). In time-course experiments, cells were stimulated with these agonists (at an EC90 concentration as determined in SH-SY5Y cells, 100 minutes) before direct addition of either vehicle control or antagonist (100 nM ZM-241385) and incubation for a time course over 3 hours (Fig. 7, A–F). When performed at room temperature (Fig. 7, A, C, and E), these time courses were consistent with data from our recombinant expression system; agonist responses were stable over time in control (no antagonist) treatment. Antagonist addition reversed the responses rapidly for 1aa (complete reversal within the earliest time-point), slowly for 3cd (approximate t1/2 of 1 hour), and had little effect on 3ch, highlighting differences in their off-rates that agree with GloSensor reversal data in our recombinant cell line. When performed at 37°C (Fig. 7, B, D, and F), some interesting differences with our CHO-A2A system were observed as agonist responses were less stable over time in control time courses, with gradual reduction in cAMP levels to baseline levels. Despite this, enough response window remained to observe antagonist-mediated reversal after 1 and 2 hours, where and 1aa and 3cd were significantly reversed, whereas 3ch remained unaffected. Thus, 3ch appears to have a slow off-rate at physiologic temperature in these cells. However, these findings suggest that in some cell backgrounds, cellular mechanisms that dampen receptor responses over time may limit the long duration of action of sustained compounds at 37°C. Multiple functionally and temporally distinct mechanisms have been shown to cause agonist-driven dampening of A2A responses (Chern et al., 1993, 1995; Palmer et al., 1994). We speculate that SH-SY5Y cells are more susceptible to a gradual loss of A2A responsiveness because they are better equipped than CHO cells with the cellular machinery involved in the downregulation of receptors and/or signaling proteins. Nevertheless, robust responses remain intact for a number of hours of chronic agonist stimulation in SH-SY5Y cells, and the rapid desensitization profile typical of GPCRs is not observed, offering the opportunity for prolonged agonist effects.
Fig. 7.
Temporal response profiles of A2A agonists at endogenously expressed receptors in SH-SY5Y cells using the endpoint cAMP assay. (A–F) Time course experiments determining agonist responses stability and the ability of an antagonist (100 nM ZM-241385) to reverse these. Experiments were performed at either room temperature (A, C, E) or 37°C (B, D, F). Cells were incubated with EC90 concentrations of 3cd (A, B), 3ch (C, D), or 1aa (E, F) for 100 minutes, before direct addition of antagonist (red) or vehicle (blue) in a 1:10 dilution and further incubation for the indicated times, followed by direct addition of rolipram (in a 1:1 dilution) for 45 minutes. *P < 0.05, **P < 0.01; ***P < 0.001 as determined by repeated-measure ANOVA with Bonferroni’s post-test comparing antagonist versus vehicle treated responses for the each time point. (G–H) Sustained agonist responses measured in washout experiments. Suspensions of SH-SY5Y cells were pre-treated with 20× EC90 concentrations of each agonist (2 hours) at 37°C (G) or room temperature (H) before washout and recovery in drug-free buffer for 1 hour (37°C) and measurement of cAMP capture by subsequent inclusion of rolipram at the relevant temperature. **P < 0.01; ***P < 0.001 determined by repeated-measure ANOVA with Dunnett’s post-test compared with vehicle control.
The ability of these compounds to display sustained wash-resistant agonist responses was investigated in SH-SY5Y cells with a 1 hour postwash recovery time at 37°C (Fig. 7G). Cells pretreated with 3ch had significantly elevated residual cAMP response after washout compared with control (P < 0.01; ANOVA with Dunett’s post-test; n = 3), confirming that cell/receptor-mediated sustained agonism could occur at the endogenously expressed receptor. Cells pre-exposed to 1aa or 3cd did not have increased residual cAMP responses. That postwash responses are absent in 3cd pretreated cells may point toward the weak sustained effects of this compound being compounded by loss of function by downregulation of overall receptor responsiveness. Indeed, wash-resistant responses to 3cd (and 3ch) could be observed at room temperature where downregulation is not pronounced (Fig. 7H). In summary, cell-specific factors can influence persistent agonist responses.
Discussion
In this study we investigated the in vitro temporal response profiles of a panel of A2A agonists. Because there is good evidence for the clinical relevance of the duration of action of these drugs, we sought to better understand the mechanisms behind these properties. Our data show that some agonists can continue to activate the receptor for at least a number of hours after removal of free ligand by infinite dilution, whereas others are readily removed by washing. This suggests that certain ligand-specific properties can regulate duration of action after washing and confer sustained agonism. Similar phenomena have been observed for a growing number of GPCR agonists, although it is often challenging to determine the precise mechanisms through which this occurs (Hothersall et al., 2016).
We hypothesized that either slow dissociation kinetics or rebinding of agonist molecules could drive sustained responses and sought to delineate these mechanisms by examining the ability of an antagonist to interrupt agonist responses. Rebinding can allow multiple sequential short-lived binding events, whereas slow kinetics involve singular long-lived binding events, meaning that only the former is susceptible to antagonist reversal effects as the agonist dissociates to leave free binding sites. Together, our findings are consistent with A2A agonist duration of action in cellular experiments that is governed by their dissociation kinetics from cell surface receptors. In other words, after washing, predominantly receptor-bound agonist remains, and responses are lost as a function of the rate at which agonist/receptor complexes dissociate. This is supported by the following pieces of evidence:
Sustained agonists were characterized by slow antagonist reversal rates, and there is a correlation between reversal rate and the magnitude of sustained agonism (Fig. 4).
Radioligand binding experiments suggest that sustained A2A agonists persistently occupy the binding site after washout. Moreover, sustained agonists have a long residence time, whereas a readily washed ligand has rapid kinetics.
Little/no potency is lost when comparing postwash agonist concentration responses with their direct acute receptor stimulation (Fig. 1B). This indicates that we are measuring the same ligand/receptor interactions in both cases, instead of a requirement for a pool of nonreceptor-bound ligand that is resistant to washing (i.e., rebinding).
Sustained agonist responses are largely insensitive to antagonist reversal (Fig. 1, C and D), suggesting that a single stable binding event rather than rebinding mediates postwash responses.
Sustained agonist responses are specific for A2A and are greatly reduced at A2B, whereas the slowly dissociating profile of such ligands is lost at A2B. This strongly suggests that it is the A2A binding site rather than the cellular background that is driving the effect and is thus specific to the pharmacology of ligand/A2A interactions (i.e., agonist off-rate). Rebinding-type mechanisms would be expected to be target-independent, being a product of the ligand diffusion limitations in that system.
There is precedent for slow agonist dissociation kinetics regulating a long agonist duration of action at multiple GPCRs (Haskell-Luevano et al., 1996; Ferrandon et al., 2009; Andreassen et al., 2014; Hothersall et al., 2015; Nishiyama and Hirai, 2015). Our findings are also consistent with previous observations that the irreversibly binding A2A agonist DITC-APEC can exert sustained activation in intact tissue that cannot be reversed by antagonist (Niiya et al., 1993). Clearly, persistent agonist responses will be facilitated by a low level of receptor regulatory processes that normally serve to dampen receptor responsiveness (Hothersall et al., 2016). Indeed, a lack of desensitization and internalization as was previously demonstrated for A2A (Zezula and Freissmuth, 2008), although other investigators have observed agonist-driven loss of A2A responsiveness, which points toward an important role for cellular context (Chern et al., 1993, 1995; Palmer et al., 1994). In endogenously expressing SH-SH5Y cells we do observe a slow loss of A2A function that imparts some limit on agonist effects over a number of hours. Importantly, in a number of physiologically relevant settings (Abbracchio et al., 1992; Niiya et al., 1993; Koshiba et al., 1997), including in vivo (Adami et al., 1995), A2A agonist responses have been shown to be stable over time. Thus, a good understanding of receptor regulatory processes in target tissues will be crucial to fully understand and characterize the clinical profile of GPCR agonist drugs.
There is a burgeoning understanding of SAR that underpins the binding kinetics of GPCR ligands, which is anticipated to benefit greatly drug discovery. The sustained A2A agonists identified in this study are characterized by lipophilic N6 substitutions as well as bulky C2 substituents, and wash-resistant responses are lost when these groups are removed or replaced (structures shown in Table 1 and washout data summarized in Fig. 1A). When the N6 group is removed from sustained compounds (as in 3cd to 3ad, 3cg to 3ag, or 3ch to 3ah) wash resistance is lost and reversal rate is greatly accelerated. Modifying the N6 group also influences these kinetics parameters (as evidenced by differences between 3ch, 3dh, and 3eh, as well as 3cg, 4dg, and 3eg). Equally, when the N6 group is maintained but the C2 is removed, sustained responses are absent (compound 2cb), and modifying the C2 group of N6 substituted compounds greatly influences kinetic parameters (compare the responses to 3cd, 3ce, 3cf, 3cg, and 3ch). Therefore, both N6 and C2 groups contribute to binding kinetics, and the appropriate substitution of both within the same molecule is required for persistent receptor activation.
With the benefit of a wealth of published structural biology data for A2A, we were able to predict the manner in which agonist interactions in the binding pocket might confer slow off-rate. Comparing the crystal structures of A2A bound to the substituted agonist 3cd (UK-432,097) (Xu et al., 2011) and the unsubstituted agonist 3ab (NECA) (Lebon et al., 2011), it is clear that N6/C2 substituents of the UK-432,097 molecule make unique interactions with the receptor. Accordingly, modeling studies have identified three main “subpockets” within the A2A binding site that, respectively, interact with the adenosine core, the N6, and the C2 parts of UK-432,097, with the latter two being empty with unsubstituted ligands (Deflorian et al., 2012). Furthermore, molecular dynamics simulations suggest that UK-432,097 influences receptor conformational space quite differently to adenosine (Lee and Lyman, 2012). We propose a model whereby concurrent strong interactions within both the hydrophobic N6 pocket and C2 pocket hold the adenosine core of the agonist tightly in the A2A binding site to promote stable slowly dissociating ligand/receptor complexes and hence persistent activation. It is feasible that the loss of sustained responses of C2/N6 substituted compounds at the closely related A2B receptor are due to differences in accommodation of the A2B binding pocket for these groups. Indeed, the tyrosine271 residue of A2A is important for C2-substituent binding interactions (Deflorian et al., 2012), and this is changed to asparagine in A2B, consistent with a prominent role of this group in regulating duration of binding. Modeling studies alongside receptor mutagenesis will be an exciting avenue to validate this hypothesis and help fully understand compound SAR.
The N6 substituents of the sustained compounds confer lipophilicity (high logD7.4) and/or membrane partitioning properties (high log KIAM) (Table 2). Interestingly, log KIAM and logD7.4 can change independently of each other across related compounds. For example, comparing 3ch and 3cg the quaternization of the pryridine nitrogen in the C2-substituent of the former to form a methylpyridinium salt causes a large drop in logD7.4 (from 3.5 to 0), whereas log KIAM is increased (from 2.56 to 2.87). Although we originally hypothesized that membrane partitioning (log KIAM) might be a mechanism for sustained responses, as has been suggested for other GPCR agonists (Teschemacher and Lemoine, 1999; Austin et al., 2003; Hothersall et al., 2015), this does not appear to drive the persistent activity of the compounds tested here because the evidence listed above for slow dissociation kinetics generally excludes this phenomenon. Overall compound lipophilicity (high logD7.4) is not a prerequisite for sustained agonism, but our data suggest that lipophilic N6 substituents in particular are important in conferring stable binding interactions. For example, 3ch is amphiphilic and charged but contains a highly lipophilic biphenyl N6 substituent that appears to interact favorably with the chemistry of the N6 subpocket to help promote a sustained response. This highlights that high lipophilicity logD7.4 is not required for slow dissociation and that specific local interactions have more of an influence.
In summary, we show that slow dissociation kinetics can control the duration of action of A2A agonists in a cellular setting. We suggest that key regions within the A2A binding pocket underlie this effect and that N6 and C2 substituted compounds similar to UK-432,097 (3cd) achieve stable binding by interacting with these. Whereas this stable binding effect is clearly evident in UK-432,097, it is greatly enhanced by modifying the C2 group for compounds such as 3cg and 3ch. It is tempting to speculate that this could offer a means to improve the clinical pharmacology of A2A ligands by extending duration of action. We anticipate that this SAR will prove valuable information for drug discovery at this target by informing the rational design of novel A2A agonists for optimized effect duration and improved pharmacotherapeutic profiles.
Acknowledgments
The authors thank Alastair Brown (Heptares Therapeutics and AstraZeneca) for initiating and inspiring this project and Mark Timms (AstraZeneca) for assistance in obtaining and collating logD7.4 data. The authors are grateful to the scientists at WuXi PharmaTech and BioDuro who synthesised the AstraZeneca proprietary compounds used in this study.
Abbreviations
- A2A
adenosine A2A receptor
- A2B
adenosine A2B receptor
- FCS
fetal calf serum
- GPCR
G protein-coupled receptor
- HTRF
homogenous time-resolved fluorescence
- IAM
immobilized artificial membrane
- KIAM
immobilized artificial membrane partitioning coefficient
- KRI
kinetic rate index
- SAR
structure-activity relationship
Authorship Contributions
Participated in research design: Hothersall, Guo, Sarda, Chen, Waring, IJzerman, Hill, Dale, and Rawlins.
Conducted experiments: Hothersall, Guo, Sarda, and Keur.
Contributed to reagents or analytic tools: Hothersall, Guo, Sarda, Chen, and Waring.
Performed data analysis: Hothersall, Guo, Sarda, and Chen.
Wrote or contributed to the writing of the manuscript: Hothersall, Guo, Sarda, Sheppard, Chen, Waring, IJzerman, and Rawlins.
Footnotes
This work was funded by AstraZeneca as part of the Innovative Medicines Initiative Joint Undertaking under K4DD, grant agreement no. 115366, resources of which are composed of financial contribution from the European Union’s Seventh Framework Programme [FP7/2007-2013] and EFPIA companies’ in kind contribution.
 This article has supplemental material available at molpharm.aspetjournals.org.
References
- Abbracchio MP, Fogliatto G, Paoletti AM, Rovati GE, Cattabeni F. (1992) Prolonged in vitro exposure of rat brain slices to adenosine analogues: selective desensitization of adenosine A1 but not A2 receptors. Eur J Pharmacol 227:317–324. [DOI] [PubMed] [Google Scholar]
- Adami M, Bertorelli R, Ferri N, Foddi MC, Ongini E. (1995) Effects of repeated administration of selective adenosine A1 and A2A receptor agonists on pentylenetetrazole-induced convulsions in the rat. Eur J Pharmacol 294:383–389. [DOI] [PubMed] [Google Scholar]
- Andreassen KV, Hjuler ST, Furness SG, Sexton PM, Christopoulos A, Nosjean O, Karsdal MA, Henriksen K. (2014) Prolonged calcitonin receptor signaling by salmon, but not human calcitonin, reveals ligand bias. PLoS One 9:e92042. [DOI] [PMC free article] [PubMed] [Google Scholar]
- Åstrand ABM, Lamm Bergström E, Zhang H, Börjesson L, Söderdahl T, Wingren C, Jansson A-H, Smailagic A, Johansson C, Bladh H, et al. (2015) The discovery of a selective and potent A2a agonist with extended lung retention. Pharmacol Res Perspect 3:e00134. [DOI] [PMC free article] [PubMed] [Google Scholar]
- Austin RP, Barton P, Bonnert RV, Brown RC, Cage PA, Cheshire DR, Davis AM, Dougall IG, Ince F, Pairaudeau G, et al. (2003) QSAR and the rational design of long-acting dual D2-receptor/beta 2-adrenoceptor agonists. J Med Chem 46:3210–3220. [DOI] [PubMed] [Google Scholar]
- Baines AE, Corrêa SA, Irving AJ, Frenguelli BG. (2011) Differential trafficking of adenosine receptors in hippocampal neurons monitored using GFP- and super-ecliptic pHluorin-tagged receptors. Neuropharmacology 61:1–11. [DOI] [PubMed] [Google Scholar]
- Bridges AJ, Moos WH, Szotek DL, Trivedi BK, Bristol JA, Heffner TG, Bruns RF, Downs DA. (1987) N6-(2,2-diphenylethyl)adenosine, a novel adenosine receptor agonist with antipsychotic-like activity. J Med Chem 30:1709–1711. [DOI] [PubMed] [Google Scholar]
- Cerqueira MD. (2004) The future of pharmacologic stress: selective A2A adenosine receptor agonists. Am J Cardiol 94: 33D–42D. [DOI] [PubMed] [Google Scholar]
- Charalambous C, Gsandtner I, Keuerleber S, Milan-Lobo L, Kudlacek O, Freissmuth M, Zezula J. (2008) Restricted collision coupling of the A2A receptor revisited: evidence for physical separation of two signaling cascades. J Biol Chem 283:9276–9288. [DOI] [PubMed] [Google Scholar]
- Chen JF, Eltzschig HK, Fredholm BB. (2013) Adenosine receptors as drug targets--what are the challenges? Nat Rev Drug Discov 12:265–286. [DOI] [PMC free article] [PubMed] [Google Scholar]
- Chern Y, Chiou JY, Lai HL, Tsai MH. (1995) Regulation of adenylyl cyclase type VI activity during desensitization of the A2a adenosine receptor-mediated cyclic AMP response: role for protein phosphatase 2A. Mol Pharmacol 48:1–8. [PubMed] [Google Scholar]
- Chern Y, Lai HL, Fong JC, Liang Y. (1993) Multiple mechanisms for desensitization of A2a adenosine receptor-mediated cAMP elevation in rat pheochromocytoma PC12 cells. Mol Pharmacol 44:950–958. [PubMed] [Google Scholar]
- Copeland RA, Pompliano DL, Meek TD. (2006) Drug-target residence time and its implications for lead optimization. Nat Rev Drug Discov 5:730–739. [DOI] [PubMed] [Google Scholar]
- de Lera Ruiz M, Lim YH, Zheng J. (2014) Adenosine A2A receptor as a drug discovery target. J Med Chem 57:3623–3650. [DOI] [PubMed] [Google Scholar]
- Deflorian F, Kumar TS, Phan K, Gao ZG, Xu F, Wu H, Katritch V, Stevens RC, Jacobson KA. (2012) Evaluation of molecular modeling of agonist binding in light of the crystallographic structure of an agonist-bound A₂A adenosine receptor. J Med Chem 55:538–552. [DOI] [PMC free article] [PubMed] [Google Scholar]
- Ferrandon S, Feinstein TN, Castro M, Wang B, Bouley R, Potts JT, Gardella TJ, Vilardaga JP. (2009) Sustained cyclic AMP production by parathyroid hormone receptor endocytosis. Nat Chem Biol 5:734–742. [DOI] [PMC free article] [PubMed] [Google Scholar]
- Field JJ, Lin G, Okam MM, Majerus E, Keefer J, Onyekwere O, Ross A, Campigotto F, Neuberg D, Linden J, et al. (2013) Sickle cell vaso-occlusion causes activation of iNKT cells that is decreased by the adenosine A2A receptor agonist regadenoson. Blood 121:3329–3334. [DOI] [PMC free article] [PubMed] [Google Scholar]
- Gao ZG, Jacobson KA. (2011) Emerging adenosine receptor agonists: an update. Expert Opin Emerg Drugs 16:597–602. [DOI] [PMC free article] [PubMed] [Google Scholar]
- Gnad T, Scheibler S, von Kügelgen I, Scheele C, Kilić A, Glöde A, Hoffmann LS, Reverte-Salisa L, Horn P, Mutlu S, et al. (2014) Adenosine activates brown adipose tissue and recruits beige adipocytes via A2A receptors. Nature 516:395–399. [DOI] [PubMed] [Google Scholar]
- Guo D, Hillger JM, IJzerman AP, Heitman LH. (2014) Drug-target residence time--a case for G protein-coupled receptors. Med Res Rev 34:856–892. [DOI] [PubMed] [Google Scholar]
- Guo D, Mulder-Krieger T, IJzerman AP, Heitman LH. (2012) Functional efficacy of adenosine A₂A receptor agonists is positively correlated to their receptor residence time. Br J Pharmacol 166:1846–1859. [DOI] [PMC free article] [PubMed] [Google Scholar]
- Guo D, van Dorp EJ, Mulder-Krieger T, van Veldhoven JP, Brussee J, Ijzerman AP, Heitman LH. (2013) Dual-point competition association assay: a fast and high-throughput kinetic screening method for assessing ligand-receptor binding kinetics. J Biomol Screen 18:309–320. [DOI] [PubMed] [Google Scholar]
- Haskell-Luevano C, Miwa H, Dickinson C, Hadley ME, Hruby VJ, Yamada T, Gantz I. (1996) Characterizations of the unusual dissociation properties of melanotropin peptides from the melanocortin receptor, hMC1R. J Med Chem 39:432–435. [DOI] [PubMed] [Google Scholar]
- Hothersall JD, Bussey CE, Brown AJ, Scott JS, Dale I, Rawlins P. (2015) Sustained wash-resistant receptor activation responses of GPR119 agonists. Eur J Pharmacol 762:430–442. [DOI] [PubMed] [Google Scholar]
- Hothersall JD, Brown AJ, Dale I, Rawlins P. (2016) Can residence time offer a useful strategy to target agonist drugs for sustained GPCR responses? Drug Discov Today 21:90–96. [DOI] [PubMed] [Google Scholar]
- Koshiba M, Kojima H, Huang S, Apasov S, Sitkovsky MV. (1997) Memory of extracellular adenosine A2A purinergic receptor-mediated signaling in murine T cells. J Biol Chem 272:25881–25889. [DOI] [PubMed] [Google Scholar]
- Lebon G, Edwards PC, Leslie AG, Tate CG. (2015) Molecular Determinants of CGS21680 Binding to the Human Adenosine A2A Receptor. Mol Pharmacol 87:907–915. [DOI] [PMC free article] [PubMed] [Google Scholar]
- Lebon G, Warne T, Edwards PC, Bennett K, Langmead CJ, Leslie AG, Tate CG. (2011) Agonist-bound adenosine A2A receptor structures reveal common features of GPCR activation. Nature 474:521–525. [DOI] [PMC free article] [PubMed] [Google Scholar]
- Lee JY, Lyman E. (2012) Agonist dynamics and conformational selection during microsecond simulations of the A(2A) adenosine receptor. Biophys J 102:2114–2120. [DOI] [PMC free article] [PubMed] [Google Scholar]
- Mantell S, Jones R, Trevethick M. (2010) Design and application of locally delivered agonists of the adenosine A(2A) receptor. Expert Rev Clin Pharmacol 3:55–72. [DOI] [PubMed] [Google Scholar]
- Marumoto R, Yoshioka Y, Honjo M, and Kawazoe K (1974), inventors, Takeda Chemical Industries Limited, assignee. 2,6-diaminonebularinderivate 2,6-diaminonebularinderivate. Patent DE2359536 A1. 1973 Nov 29. [Google Scholar]
- Niiya K, Jacobson KA, Silvia SK, Olsson RA. (1993) Covalent binding of a selective agonist irreversibly activates guinea pig coronary artery A2 adenosine receptors. Naunyn Schmiedebergs Arch Pharmacol 347:521–526. [DOI] [PMC free article] [PubMed] [Google Scholar]
- Nishiyama K, Hirai K. (2015) In vitro comparison of duration of action of melatonin agonists on melatonin MT receptor: possible link between duration of action and dissociation rate from receptor. Eur J Pharmacol 757:42–52. [DOI] [PubMed] [Google Scholar]
- Ong S, Liu H, Qiu X, Bhat G, Pidgeon C. (1995) Membrane partition coefficients chromatographically measured using immobilized artificial membrane surfaces. Anal Chem 67:755–762. [DOI] [PubMed] [Google Scholar]
- Palmer TM, Gettys TW, Jacobson KA, Stiles GL. (1994) Desensitization of the canine A2a adenosine receptor: delineation of multiple processes. Mol Pharmacol 45:1082–1094. [PMC free article] [PubMed] [Google Scholar]
- Palmgren JJ, Monkkonen J, Korjamo T, Hassinen A, Auriola S. (2006) Drug adsorption to plastic containers and retention of drugs in cultured cells under in vitro conditions. Eur J Pharm Biopharm 64: 369–378. [DOI] [PubMed] [Google Scholar]
- Pidgeon C, Ong S, Liu H, Qiu X, Pidgeon M, Dantzig AH, Munroe J, Hornback WJ, Kasher JS, Glunz L, et al. (1995) IAM chromatography: an in vitro screen for predicting drug membrane permeability. J Med Chem 38:590–594. [DOI] [PubMed] [Google Scholar]
- Sato N, Yuki Y, Shinohara H, Takeji Y, Ito K, Michikami D, Hino K, and Yamazaki H (2010) inventors, Otsuka Pharmaceutical Co Ltd, assignee. A novel cyanopyrimidine derivative. Patent WO/2010/090299. 2010 Dec 8. [Google Scholar]
- Sykes DA, Parry C, Reilly J, Wright P, Fairhurst RA, Charlton SJ. (2014) Observed drug-receptor association rates are governed by membrane affinity: the importance of establishing “micro-pharmacokinetic/pharmacodynamic relationships” at the β2-adrenoceptor. Mol Pharmacol 85:608–617. [DOI] [PubMed] [Google Scholar]
- Teschemacher A, Lemoine H. (1999) Kinetic analysis of drug-receptor interactions of long-acting beta2 sympathomimetics in isolated receptor membranes: evidence against prolonged effects of salmeterol and formoterol on receptor-coupled adenylyl cyclase. J Pharmacol Exp Ther 288:1084–1092. [PubMed] [Google Scholar]
- Vauquelin G, Charlton SJ. (2010) Long-lasting target binding and rebinding as mechanisms to prolong in vivo drug action. Br J Pharmacol 161:488–508. [DOI] [PMC free article] [PubMed] [Google Scholar]
- Wennerberg M, Balendran A, Clapham JC, Vauquelin G. (2010) Unravelling the complex dissociation of [(3)H]-rimonabant from plated CB(1) cannabinoid receptor-expressing cells. Fundam Clin Pharmacol 24:181–187. [DOI] [PubMed] [Google Scholar]
- Xu F, Wu H, Katritch V, Han GW, Jacobson KA, Gao ZG, Cherezov V, Stevens RC. (2011) Structure of an agonist-bound human A2A adenosine receptor. Science 332:322–327. [DOI] [PMC free article] [PubMed] [Google Scholar]
- Zezula J, Freissmuth M. (2008) The A(2A)-adenosine receptor: a GPCR with unique features? Br J Pharmacol 153 (Suppl 1):S184–S190. [DOI] [PMC free article] [PubMed] [Google Scholar]


