Abstract
Background:
The detection of solitary pulmonary nodules (SPNs) that may potentially develop into a malignant lesion is essential for early clinical interventions. However, grading classification based on computed tomography (CT) imaging results remains a significant challenge. The 2-[18F]-fluoro-2-deoxy-D-glucose (18F-FDG) positron emission tomography (PET)/CT imaging produces both false-positive and false-negative findings for the diagnosis of SPNs. In this study, we compared 18F-FDG and 3-deoxy-3-[18F]-fluorothymidine (18F-FLT) in lung cancer PET/CT imaging.
Methods:
The binding ratios of the two tracers to A549 lung cancer cells were calculated. The mouse lung cancer model was established (n = 12), and micro-PET/CT analysis using the two tracers was performed. Images using the two tracers were collected from 55 lung cancer patients with SPNs. The correlation among the cell-tracer binding ratios, standardized uptake values (SUVs), and Ki-67 proliferation marker expression were investigated.
Results:
The cell-tracer binding ratio for the A549 cells using the 18F-FDG was greater than the ratio using 18F-FLT (P < 0.05). The Ki-67 expression showed a significant positive correlation with the 18F-FLT binding ratio (r = 0.824, P < 0.01). The tumor-to-nontumor uptake ratio of 18F-FDG imaging in xenografts was higher than that of 18F-FLT imaging. The diagnostic sensitivity, specificity, and the accuracy of 18F-FDG for lung cancer were 89%, 67%, and 73%, respectively. Moreover, the diagnostic sensitivity, specificity, and the accuracy of 18F-FLT for lung cancer were 71%, 79%, and 76%, respectively. There was an obvious positive correlation between the lung cancer Ki-67 expression and the mean maximum SUV of 18F-FDG and 18F-FLT (r = 0.658, P < 0.05 and r = 0.724, P < 0.01, respectively).
Conclusions:
The 18F-FDG uptake ratio is higher than that of 18F-FLT in A549 cells at the cellular level. 18F-FLT imaging might be superior for the quantitative diagnosis of lung tumor tissue and could distinguish lung cancer nodules from other SPNs.
Keywords: 2-[18F]-fluoro-2-deoxy-D-glucose, 2-[18F]-fluoro-2-deoxy-D-glucose and 3-deoxy-3-[18F]-fluorothymidine, Computed Tomography, Lung Cancer, Positron Emission Tomography, Solitary Pulmonary Nodules, Standardized Uptake Value
Introduction
The widespread use of chest computed tomography (CT) scanning technology has contributed to significantly increased detection of solitary pulmonary nodules (SPNs). The detection of potentially malignant lesions is critical for early clinical interventions and to increase the survival rate of patients as Phase I patients have a 5-year survival rate of 54–73% after the resection of lung cancer, but for patients with Phase IV, the rate is only 2%.[1] However, grading classification based on imaging results has remained a significant challenge because of incomplete CT imaging information to allow the differentiation of benign and malignant lesions on size, edge shape, or lesion density. Some studies reported that only 0–1% of SPNs with a diameter <5 mm were malignant, but 33–64% of those 11–20 mm and 64–82% over 20 mm were malignant. An irregular edge and a shape that is lobular or burr shape also suggest the possibility of malignancy. When compared with a solid nodule, the ground-glass or semi-solid nodule has a greater chance of malignancy.[2] The evaluation of pulmonary nodular size and shape and these corresponding risk factors have been widely used to evaluate SPN and to provide guidance for recommended follow-up.[3] Positron emission tomography (PET)/CT was developed to allow qualitative diagnosis of SPN, and it was reported to provide 87% sensitivity and 83% specificity for the detection of a malignant lesion.[3] However, subsequent studies warned of the potential for false-positive and false-negative findings in the diagnosis of SPNs using 2-[18F]-fluoro-2-deoxy-D-glucose (18F-FDG) PET/CT and reported that 18F-FDG PET exhibited low sensitivity to nodules with a diameter of <10 mm, resulting in false-negative findings for lung adenocarcinoma and carcinoid and mucinous adenocarcinomas and false-positive reports due to infectious diseases, tuberculosis, fungal infection, and sarcoidosis.[4,5] However, one study of 1- and 2-h 18F-FDG dual-phase imaging suggested that the technique improved the detection rate of malignant lesions of SPNs and showed that the retention index of 18F-FDG was higher in potentially malignant lesions compared to benign lesions.[6]
However, 18F-FDG is not widely available, stimulating interest in the exploration of alternative materials for use as possible tracers. As an alternative to 18F-FDG, 3-deoxy-3-[18F]-fluorothymidine (18F-FLT) can reveal the ongoing processes of DNA synthesis and cell proliferation. However, application of 18F-FLT in the diagnosis of lung cancer showed only a sensitivity of 74% to nonsmall cell lung cancer (NSCLC) compared to 94% using 18F-FDG.[7] A subsequent study also concluded that 18F-FLT was not as sensitive as 18F-FDG for the diagnosis of NSCLC with 18F-FLT showing 72% sensitivity compared to 89% for 18F-FDG; the standardized uptake value (SUV) was also much lower for 18F-FLT.[8] However, 18F-FLT has been widely used to evaluate the curative effects of lung cancer. In contrast to 18F-FDG, 18F-FLT imaging was reported to be more sensitive to the treatments of NSCLC, allowing earlier determination of curative efficiency and better evaluation of posttreatment changes in tumor size compared to CT.[9] In addition, researchers have explored the intake differences between 18F-FLT and11 C-deoxyglucose (DG) in lung cancer cell using in vitro laboratory experiments. Cytological examination indicated that lung cancer cells incorporated much more 18F-FLT than11 C-DG during the S-phase of the cell division cycle.[10]
Thus, it remains important to perform further studies evaluating the uptake and imaging of 18F-FDG and 18F-FLT from a standpoint of cytology, using both animal models and clinical patients to determine in more detail the cytological and molecular biological mechanisms of accurate and meaningful imaging. In this work, our first aim was to investigate the uptake difference and estimate the role of the Ki-67 tumor proliferation index in 18F-FLT and 18F-FDG in lung cancer cells from the cytological perspective. Second, we studied the micro-PET imaging of A549 animal xenografts with 18F-FDG and 18F-FLT. Third, we investigated the uptake differences between 18F-FLT and 18F-FDG in SPNs based on clinical trials to determine the correlation of Ki-67 and 18F-FLT and 18F-FDG imaging in pathological specimens and to compare the diagnostic efficiency of the two tracers. Finally, we attempted to differentiate solitary lung cancer nodules from other lung SPNs using PET/CT imaging with the two tracers.
Methods
2-[18F]-fluoro-2-deoxy-D-glucose and 3-deoxy-3-[18F]-fluorothymidine uptake in A549 cells
Reagents and cell culture
Reagents included high-glucose DMEM (PAA Laboratories GmbH, Hessen, Austria); 1640 culture medium (KeyGEN BioTECH Co., Ltd., Nanjing, China); 10% fetal bovine serum (FBS-O7-003, Bio International Limited, Auckland, New Zealand); 0.1% trypsin + ethylenediaminetetraacetic acid (Biological Industries, Austria); phosphate-buffered saline (PBS; PAA Laboratories GmbH); and 18F-FDG and 18F-FLT (provided by the PET Radiopharmaceutical Laboratory of the General Hospital of the People's Liberation Army).
Cell culture and probe binding assay
Lung cancer A549 cells were provided by the Institute of General Surgery of General Hospital of PLA. A549 cells were cultured under routine procedures in RPMI-1640 culture medium and the assay was performed as follows: (1) cells were seeded by 1 × 10⁵ per well into six-well plate, incubated for 24 h, and removed for observation under an inverted telescope to determine cell shape; (2) 18F-FDG 37.0 MBq was diluted into PBS and 500 µl diluent was added to small test tubes and placed into well-type γ-counting instrument (FJ-367, State-owned No. 267 Company, Beijing, China) to adjust the count to 80,000–100,000; (3) 500 µl adjusted tracers were added into the 6-well plate and placed in a 5% CO2 incubator for cell culture; the same amount of tracers were also added to an empty test tube for the blank control and transferred to the well-type γ-counting instrument for cell counting; (4) at 30, 60, 90, 120, 150, and 180 min, the 6-well plate was removed, the supernatant from each well was taken and washed by PBS three times, 0.5 ml trypsin was added and incubated for 3 min, 1 ml DMEM culture medium was added to neutralize the fluid and mixed, and then the cell suspension liquid was transferred to small test tubes and washed by PBS and transferred to the well-type γ-counting instrument for cell counting; the blank control tubes were also counted; (5) after γ-cell counting, 3 to 6 wells were removed for cell counting and the mean count was used. The repetition time was the same as the sample number, and the experiment was repeated six times.
The adjustment of cytological experimental data and indexes included both cell adjustment and radioactive attenuation adjustment. Cell adjustment was realized by cell counting that normalized the cell count to 105. Radioactive attenuation was calculated as the ratio of the experimental count against the count of blank control for the same time. The uptake rate of A549 cell tracer was calculated by the following formula:
18F-FDG uptake rate per 105 cells (%) = Radioactive count of experimental cells/total radioactive count of the blank control × 100%/cell number.
Ki-67 proliferation assay by flow cytometry detection
After incubating for 48 h, A549 cells were digested and centrifuged to remove the cell debris, and then 0.1% Triton X-100 was added for osmotic treatment. A total of 106 cells were taken, and 15 μl MIB-1-fluorescent isothiocyanate (FITC) (Ki-67 monoclonal antibody labeled by FITC) was added and incubated in dark for 30 min. The mixture was then centrifuged to remove the cell suspension for flow cytometry detection with a laser wavelength of 488 nm. The experiment was repeated for six times.
Tissue specimens were cut by eye scissors to homogenate and treated by trypsin. Next, normal saline was added and the sample was filtrated by a 200-hole nylon net for the preparation of a single cell suspension. The suspension was then centrifuged to remove cell debris and 0.1% Triton X-100 was added for penetration treating.
Micro-positron emission tomography/computed tomography imaging of lung cancer animal models using 2-[18F]-fluoro-2-deoxy-D-glucose and 3-deoxy-3-[18F]-fluorothymidine
Animal model preparation
Twelve 6-week-old, specific pathogen-free grade, nude Balb/c mice (female:male = 1:1, weighing 14–17 g) were purchased from the Laboratory Animal Center of National Institutes for Food and Drug Control (Beijing, China). The animals were kept within the animal care facility in the Peking University Health Science Center. The feeding environment was at a temperature of 20–25°C and a relative humidity range of 40–70%. The nude mice were adapted for 6 days before the experiment. The drinking water provided to the animals was ultra-pure water, meeting the quality of drinking water national standard of the People's Republic of China (GB5749-2006). The experiment conformed to the National Institutes of Health Guide for the Care and Use of Laboratory Animals. The housing and care and procedures in the study were performed in accordance with the guidelines and regulations of the Animal Care Committee of the University of the Peking University Health Science Center and approved by the Institutional Animal Care and Use Committee of the Peking University Health Science Center, China.
The mice were weighed and numbered. The mice in the experimental group were engrafted with A549 cells (5 × 10⁵ cells per mouse) through subcutaneous inoculation for an animal model of lung adenocarcinoma. The subcutaneous tumor size was measured by an electronic digital caliper. When the subcutaneous tumor diameter reached 1.0 cm, 18F-FDG and 18F-FLT micro-PET imaging (Explore VISTA micro PET/CT, GE Healthcare, Fairfield, USA) were performed.
Micro-positron emission tomography/computed tomography analysis
The tumor-bearing mice were randomly assigned into one of the two groups (n = 6 animals per group), the 18F-FDG or the 18F-FLT group. The mice were anesthetized using 1% chloral hydrate (0.45 mg/g of body weight) and positioned prone on the scanning table. 18F-FLT or 18F-FDG was injected through the tail vein at a dose of 370–555 MBq/kg in 0.25 ml of saline. The micro-PET data were acquired for 10 min at the beginning of the tracer injection and lasted about 1 h. Imaging data were derived from the reconstructed sagittal and coronal images after axial scanning in all animal models. Region of interest (ROI) was drawn on the tumor and the chest as background for three consecutive coronal slices representing the maximum tumor uptake, and the tumor-to-nontumor (lung) uptake ratio of ROI was calculated.[11]
Positron emission tomography/computed tomography imaging of patients with solitary pulmonary nodule by 2-[18F]-fluoro-2-deoxy-D-glucose and 3-deoxy-3-[18F]-fluorothymidine
Patients’ data and inclusion criteria
The inclusion criteria were according to the SPN definition published by Ost et al.:[12] single pulmonary lesion, clear border, diameter of ≤3 cm, surrounded by inflated lung tissues, no pulmonary atelectasis, no enlargement of pulmonary helium, and no pleural invasion.
Using these criteria, a total of 55 cases with SPN detected by chest CT from April 2005 to August 2011 were selected, among which there were 33 males and 22 females, 17–82 years old with an average age of 62 years. Clinical symptoms mainly included irritable cough, and some patients additionally exhibited hemosputum but not purulent sputum or fever. To correct for selection bias, all cases with SPN detected by chest CT were included in the study. The gold standard was based on pathological diagnosis. The study was approved by the Institutional Review Board of the First Affiliated Hospital of the PLA General Hospital. All patients provided written informed consent and consent for publication of individual patient data.
Positron emission tomography/computed tomography analysis
Dose of injection tracer: The dose was 555 MBq/kg for both 18F-FDG and 18F-FLT. CT was performed as follows: under normal respiration, the patient was scanned from cranial base to pubis symphysis with a tube voltage of 120 kV, tube electric current of 140 mA, collimation of 5.0 mm, slice thickness of 0.75 mm, 0.5 s/r, pitch of 1.25, and scanning time of 20–30 s. The PET was performed with the three-dimensional collection method, and each window level was scanned for 2–3 min for a total of 6–7 window levels. The CT data were used to perform attenuation correction on the PET images. The ordered subset expectation maximization algorithm was applied to reconstruct the image and obtain coronal, transverse, and sagittal images. Next, the ROI was drawn and the maximum SUV (SUVmax) was automatically computed by the processing workstation.
The diagnostic physician observed the systemic distribution of the radioactive tracer to evaluate whether the imaging was successful, and based on the lesion site and the shape and concentration of the tracer, an independent diagnosis was made by three physicians. For the semi-quantitative method, the ROI was drawn within the maximum radioactive concentration area of the transverse image and the SUVmax was detected. There is no universally accepted cutoff value of malignant lesion standard of 18F-FLT SUV, and researchers have developed and recommended different standards.[13,14] In this study, the cutoff SUVmax value of malignant lesion was ≥2.0 for 18F-FLT and ≥2.5 for 18F-FDG.
Evaluation parameters of clinical data
Sensitivity, specificity, and accuracy of both tracers in SPN were calculated.
Statistical analysis
The SPSS (IBM, Chicago, IL, USA) statistical software version 16.0 was applied to analyze the data, and the paired t-test was used to analyze the difference of the cell uptake rate between the two tracers. One-way analysis of variance was used to compare the means among multiple samples. P ≤ 0.05 was considered statistically significant.
Results
2-[18F]-fluoro-2-deoxy-D-glucose and 3-deoxy-3-[18F]-fluorothymidine uptake rate in A549 cells
After binding lung cancer A549 cells with 18F-FDG and 18F-FLT for 180 min, the uptake rate (mean ± standard deviation for six replicates) in lung cancer A549 cells for 18F-FDG was higher than that for 18F-FLT (2.41% ± 0.37% vs. 1.83% ± 0.46%, P < 0.05, cells were adjusted to 105). This cytological experimental result suggests that 18F-FDG is favorable for the detection of lung cancer.
Ki-67 expression and 2-[18F]-fluoro-2-deoxy-D-glucose and 3-deoxy-3-[18F]-fluorothymidine A549 uptake rate in A549 cells
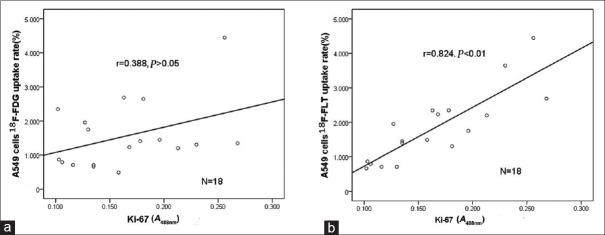
The mean proliferation index Ki-67 A488nm value of the A549 cells was 0.181 ± 0.067. The correlation between the Ki-67 A488nm value and 18F-FDG or 18F-FLT A549 cell uptake rates in A549 cells are shown in Figure 1. These results indicate that 18F-FLT more accurately reflected the proliferative activity of tumor cells.
Figure 1.
Correlation between 18F-FDG or 18F-FDG uptake rates, and Ki-67 index in A549 cells. (a) Correlation between 18F-FDG uptake rate and Ki-67 expression (n = 18). No significant correlation was observed (r = 0.388, P > 0.05). (b) Correlation between 18F-FLT uptake rate and Ki-67 expression (n = 18). A significant positive correlation was observed (r = 0. 824, P < 0.01). 18F-FDG: 2-[18F]-fluoro-2-deoxy-D-glucose; 18F-FLT: 3-deoxy-3-[18F]-fluorothymidine.
Cancer xenograft 2-[18F]-fluoro-2-deoxy-D-glucose and 3-deoxy-3-[18F]-fluorothymidine micro-positron emission tomography imaging
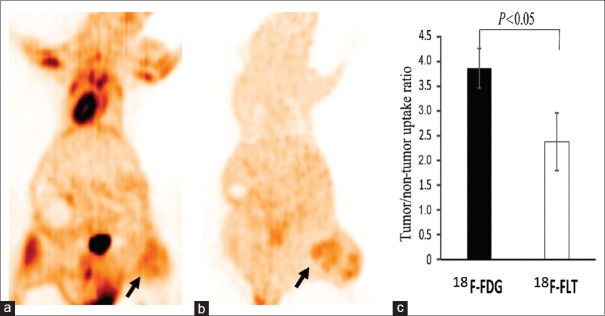
The micro-PET results of the A549 cancer xenografts (six per group) with the two tracers are shown in Figure 2. 18F-FLT PET imaging of tumors was clearer than that using 18F-FDG. In addition, imaging of tumors with 18F-FDG PET showed a slightly higher radioactivity concentration than with 18F-FLT.
Figure 2.
Lung cancer xenograft images acquired by micro-PET. (a) 18F-FDG PET imaging of lung cancer animal xenograft. (b) 18F-FLT PET imaging of lung cancer animal xenograft. An subcutaneous cancer nodule of the left lower limb shows a mild heterogeneity in 18F-FDG uptake and 18F-FLT uptake (arrows). The tumor uptake degree of 18F-FDG PET was slightly higher than that of 18F-FLT. (c) The tumor-to-nontumor uptake ratio of the region of interest in animal xenografts was compared between the two tracers, using lung tissue as background (n = 6 per group). PET: Positron emission tomography; 18F-FDG: 2-[18F]-fluoro-2-deoxy-D-glucose; 18F-FLT: 3-deoxy-3-[18F]-fluorothymidine.
Pathological results of lung cancer patients
The pathological diagnosis results were considered as the gold standard. Among the 55 examined patients, there were 17 (30.9%) patients diagnosed with lung cancer (including eight patients with squamous carcinoma, seven patients with adenocarcinoma, and two patients with bronchioloalveolar carcinoma), 15 (27.3%) patients with lung tuberculosis, 13 (23.6%) patients with pneumonia, and 10 (18.2%) patients with benign hyperplasia (three patients with granuloma, one patient with inflammatory pseudotumor, and six patients with unchanged nodule during follow-up).
2-[18F]-fluoro-2-deoxy-D-glucose and 3-deoxy-3-[18F]-fluorothymidine positron emission tomography/computed tomography imaging of lung cancer
Representative images are shown in Figure 3. For the 18F-FDG PET/CT imaging, among the 17 examined patients with lung cancer, 15 (88.2%) patients showed high 18F-FDG uptake. The mean SUV of lung cancer nodules was 6.8 ± 3.8 for the 15 patients. A SUVmax of lung cancer nodules was ≥2.5 for 13 of 15 (76.5%) patients. Our results showed that different pathological types of lung cancer exhibited different 18F-FDG uptake patterns. Two (11.8%) patients including one patient with bronchioloalveolar cancer and another patient with lung adenocarcinoma showed negative results with 18F-FDG PET/CT imaging. The mean SUV of nodules with bronchioloalveolar carcinoma and lung adenocarcinoma pathological types was lower than those of lung squamous cell carcinoma nodules.
Figure 3.
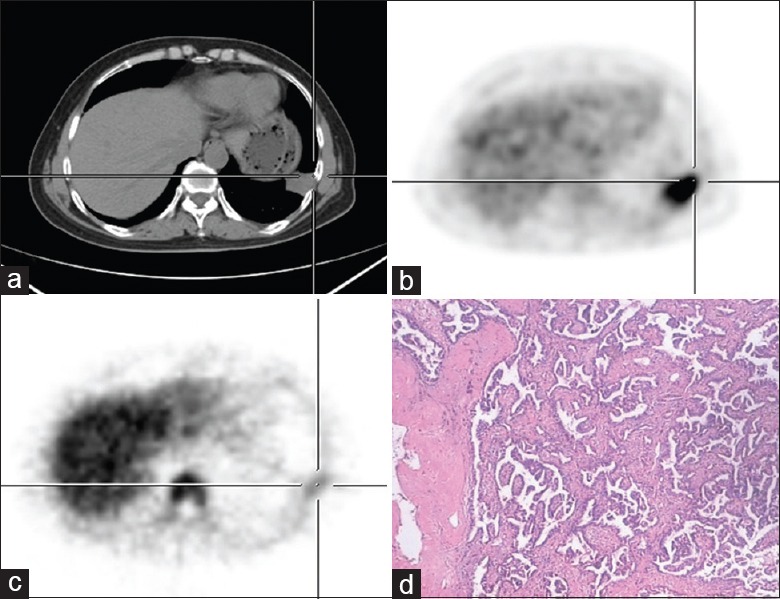
Dual-tracer PET/CT and histological images of a 56-year-old male with solitary pulmonary nodules located at the left lower lung. (a) CT shows a small nodular opacity of irregular shape on the left lower lung. (b) 18F-FDG image shows a relatively concentrated small nodular opacity with SUVmax 6.8. (c) 18F-FLT image shows that the small nodule slightly absorbed 18F-FLT with SUVmax 2.3. (d) Pathological examination shows lung adenocarcinoma (HE, original magnification ×200). PET/CT: Positron emission tomography/computed tomography; SUVmax: Maximum standardized uptake value; 18F-FDG: 2-[18F]-fluoro-2-deoxy-D-glucose; 18F-FLT: 3-deoxy-3-[18F]-fluorothymidine.
For the 18F-FLT PET/CT imaging, among the 17 examined patients with lung cancer, 12 (70.6%) patients showed moderate 18F-FLT uptake. The mean SUV of lung cancer nodules was 2.9 ± 1.2 in 12 patients. A SUVmax of lung cancer nodules was ≥2.0 in 10 of 12 (83.3%) patients. Five (29.4%) patients subjected to 18F-FLT PET/CT imaging had negative results, including two patients with bronchioloalveolar carcinoma, two patients with adenocarcinoma (tumor diameter <1.5 cm), and one patient with mucinous adenocarcinoma (for the region with few tumor cells and a large amount of mucous mass revealed by pathological examination, the CT value was lower than 15 Hounsfield units). The mean SUV of nodules of bronchioloalveolar carcinoma and lung adenocarcinoma was lower than those of lung squamous cell carcinoma nodules.
2-[18F]-fluoro-2-deoxy-D-glucose and 3-deoxy-3-[18F]-fluorothymidine positron emission tomography/computed tomography imaging of benign pulmonary tuberculosis nodules
Representative images are shown in Figure 4. Among the 15 examined patients with pulmonary tuberculosis nodules, 11 patients showed different degrees of 18F-FDG uptake. The mean SUV of tuberculosis was 6.9 ± 3.1 in 11 patients. The SUVmax of tuberculosis nodules was ≥2.5 in 9 of the 11 patients. Four patients showed negative results with 18F-FDG PET/CT imaging.
Figure 4.
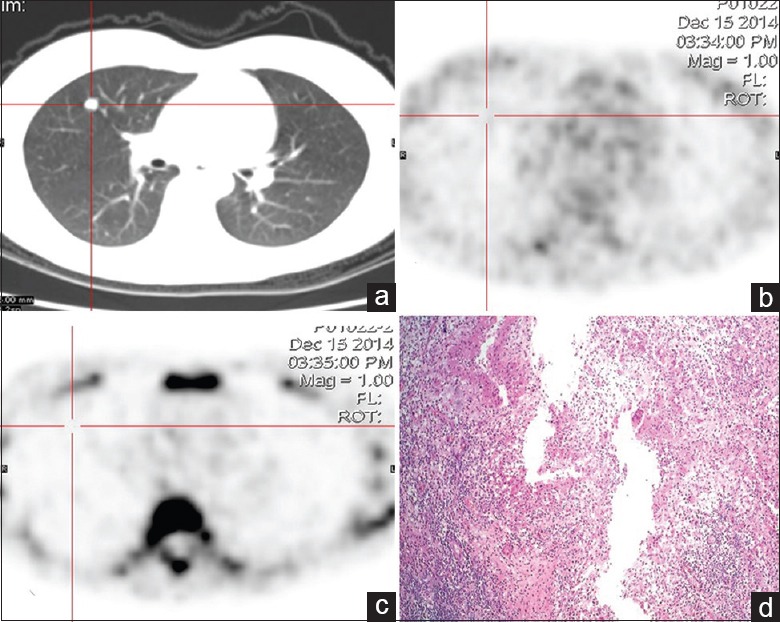
Dual-tracer PET/CT and histological images of a 43-year-old female with solitary pulmonary nodule in the right upper lung. (a) CT shows a small nodular opacity with a well-defined edge on the right upper lung. (b) 18F-FDG image shows no radioactivity uptake in the lesion. (c) 18F-FLT image also shows no radioactivity uptake in the lesion. (d) Result of pathological examination shows lung tuberculosis (HE, original magnification ×100). PET/CT: Positron emission tomography/computed tomography; 18F-FDG: 2-[18F]-fluoro-2-deoxy-D-glucose; 18F-FLT: 3-deoxy-3-[18F]-fluorothymidine.
Among the 15 examined patients with pulmonary tuberculosis nodules, ten patients showed slight 18F-FLT uptake. The mean SUV of tuberculosis was 1.6 ± 1.0 in 11 patients. The SUVmax of tuberculosis nodules was <2.0 in seven of the ten patients and the SUVmax of three patients was ≥2.0. Five patients of 18F-FLT PET/CT imaging had negative results.
2-[18F]-fluoro-2-deoxy-D-glucose and 3-deoxy-3-[18F]-fluorothymidine positron emission tomography/computed tomography imaging of lung inflammatory nodules
Representative images are shown in Figure 5. The 13 examined patients with lung inflammatory nodules exhibited different patterns of 18F-FDG and 18F-FLT uptake. Based on 18F-FDG imaging, the mean SUV of lung inflammatory nodules was 3.7 ± 2.0. The SUVmax of lung inflammatory nodules was lower than 2.5 in 6 of the 13 patients and >1.0 in 3 of the 13 patients. Three patients showed negative results by 18F-FDG PET/CT imaging. The 18F-FLT PET/CT imaging was positive in 7 of the 13 patients and negative in 6 of the 13 patients. The mean SUV of lung inflammatory nodules was 1.1 ± 0.8. The SUVmax of lung inflammatory nodules was lower than 2.0 in 5 of the 13 patients and ≥2.0 in 2 of the 13 patients.
Figure 5.
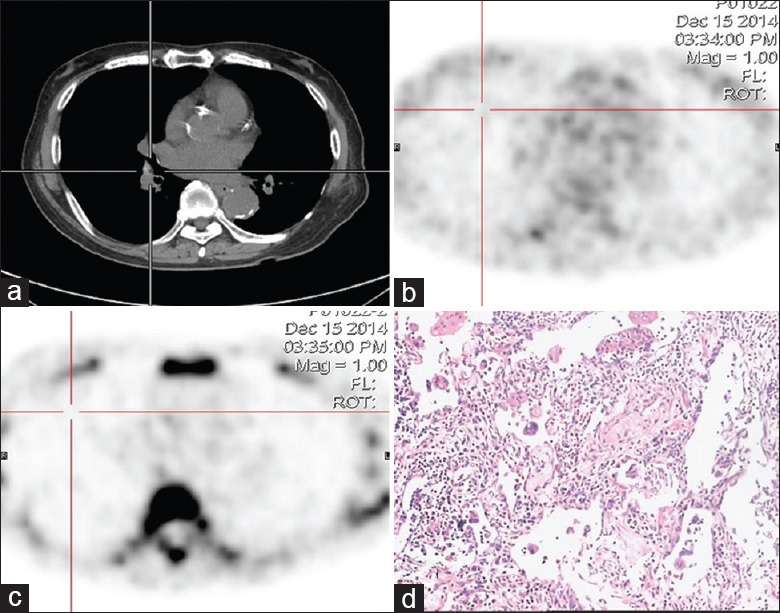
Dual-tracer PET/CT and histological images of a 69-year-old male with solitary pulmonary nodule in the right lower lung hilum area. (a) CT shows a small nodule in the lower lung hilum area. (b) The small nodule exhibits heavy intensity by 18F-FDG imaging. The SUVmax of the lesion was 3.5. (c) The small nodule shows slight intensity by 18F-FLT imaging. The SUVmax of the lesion was 1.6. (d) An inflammatory pseudotumor was confirmed by pathology (HE, original magnification ×100). PET/CT: Positron emission tomography/computed tomography; SUVmax: Maximum standardized uptake value; 18F-FDG: 2-[18F]-fluoro-2-deoxy-D-glucose; 18F-FLT: 3-deoxy-3-[18F]-fluorothymidine.
2-[18F]-fluoro-2-deoxy-D-glucose and 3-deoxy-3-[18F]-fluorothymidine positron emission tomography/computed tomography imaging of benign solitary pulmonary nodule and lung cancer nodules
The ten examined patients with other benign lung nodules showed a variable pattern of 18F-FDG uptake. The SUVmax of benign lung nodules was lower than 2.5 in three of the ten patients and ≥2.5 in seven of the ten patients. These benign lung nodules showed also a variable pattern of 18F-FLT uptake. The 18F-FLT SUVmax of lesions was lower than 2.0 in seven of the ten patients and ≥2.0 in three of the ten patients. The diagnosis value of 18F-FLT and 18F-FDG for lung cancer lesions was analyzed according to the pathological results [Table 1]. For SPNs <3 cm, the sensitivity, specificity, and accuracy of 18F-FDG PET/CT for lung cancer diagnosis were 89%, 67%, and 73%, respectively. Moreover, the sensitivity, specificity, and accuracy of 18F-FLT PET/CT for lung cancer diagnosis were 71%, 79%, and 76%, respectively. Compared with 18F-FDG PET/CT imaging, 18F-FLT PET/CT imaging showed lower sensitivity, higher specificity, and slightly higher accuracy for lung cancer diagnosis.
Table 1.
Effectiveness of 18F-FDG and 18F-FLT for the diagnosis of single nodule lung cancer
| Tracer | TP, n | TN, n | FP, n | FN, n | Sensitivity (%) | Specificity (%) | Accuracy (%) |
|---|---|---|---|---|---|---|---|
| 18F-FLT | 12 | 30 | 8 | 5 | 71 | 79 | 76 |
| 18F-FDG | 15 | 30 | 15 | 2 | 89 | 67 | 73 |
18F-FDG: 2-[18F]-fluoro-2-deoxy-D-glucose; 18F-FLT: 3-deoxy-3-[18F]-fluorothymidine; TP: True positive; TN: True negative; FP: False positive; FN: False negative.
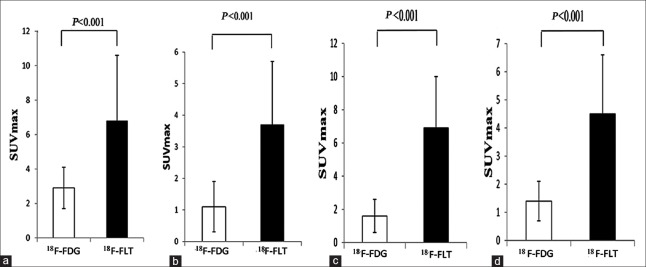
We also separately analyzed the quantitative performance for various SPNs by PET/CT imaging with the two tracers [Figure 6]. The SUVmax of the two tracers was compared in various SPNs, including lung cancer nodules, tuberculosis nodules, inflammatory nodules, and benign nodules; the results indicate that 18F-FDG PET/CT imaging was better than 18F-FLT PET/CT imaging for the detection of various SPNs (P < 0.05). In addition, in a different comparison of the techniques, we separately analyzed the quantitative performance of a single 18F-FLT PET/CT imaging in the transverse comparison or a single 18F-FDG PET/CT imaging for various SPNs [Table 2]. For the 18F-FDG PET/CT imaging, the SUVmax of lung cancer nodules was higher than that of the inflammatory nodules and benign lesions (P < 0.05). However, there was no statistical difference between the lung cancer nodules and tuberculosis nodules (P > 0.05). Similarly, the SUVmax of tuberculosis nodules was higher than that of the inflammatory nodules and benign lesions (P < 0.05). For the 18F-FLT PET/CT imaging, the SUVmax of lung cancer nodules was higher than of that of other SPNs (P < 0.05).
Figure 6.
Comparison of the SUVmax of solitary pulmonary nodules using 18F-FDG and 18F-FLT positron emission tomography/computed tomography imaging. (a) The SUVmax of primary solitary pulmonary cancer nodules (n = 17). (b) The SUVmax of solitary pulmonary inflammatory nodules (n = 13). (c) The SUVmax of pulmonary solitary tuberculosis nodules (n = 15). (d) The SUVmax of pulmonary solitary benign nodules (n = 10). SUVmax: Maximum standardized uptake value; 18F-FDG: 2-[18F]-fluoro-2-deoxy-D-glucose; 18F-FLT: 3-deoxy-3-[18F]-fluorothymidine.
Table 2.
The SUVmax comparison of PET/CT imaging using 18F-FDG and 18F-FLT for various SPNs
| Tracer | Cancer (n = 17) | Inflammation (n = 13) | Tuberculosis (n = 15) | Benign lesions (n = 10) | |
|---|---|---|---|---|---|
| 18F-FDG | 6.8 ± 3.8 | 3.7 ± 2.0*,† | 6.9 ± 3.1 | 4.5 ± 2.1*,† | |
| 18F-FLT | 2.9 ± 1.2 | 1.1 ± 0.8‡ | 1.6 ± 1.0‡ | 1.4 ± 0.7‡ |
*P<0.05 versus cancer; †P<0.05 versus tuberculosis, using 18F-FDG; ‡P<0.05 versus cancer, using 18F-FLT. The data are presented as mean ± SD. SUVmax: Maximum standardized uptake value; PET/CT: Positron emission tomography/computed tomography; SD: Standard deviation; 18F-FDG: 2-[18F]-fluoro-2-deoxy-D-glucose; 18F-FLT: 3-deoxy-3-[18F]-fluorothymidine; SPNs: Solitary pulmonary nodules.
Ki-67 expression correlated with 2-[18F]-fluoro-2-deoxy-D-glucose and 3-deoxy-3-[18F]-fluorothymidine mean maximum standardized uptake value in lung cancer histopathological tissue
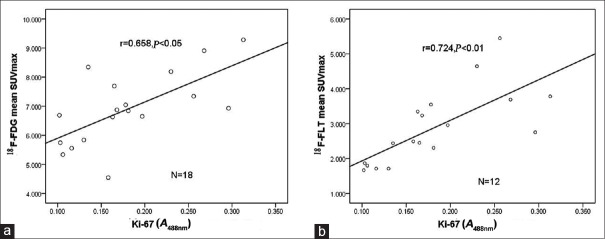
As shown in Figure 7, the proliferation index Ki-67 of lung cancer tissue was significantly positively correlated with the 18F-FDG mean SUVmax of lung cancer (r = 0.658, P < 0.05) and the 18F-FLT mean SUVmax of lung cancer (r = 0.724, P < 0.01).
Figure 7.
Correlation between Ki-67 expression and 18F-FDG, 18F-FLT SUVmax in lung cancer. (a) Ki-67 expression and 18F-FDG SUVmax in lung cancer tissues (n = 18). (b) Ki-67 expression and 18F-FLT SUVmax in lung cancer tissues (n = 12). 18F-FDG: 2-[18F]-fluoro-2-deoxy-D-glucose; 18F-FLT: 3-deoxy-3-[18F]-fluorothymidine; SUVmax: Maximum standardized uptake value.
Discussion
The diagnosis of SPNs remains a challenging goal for modern medical imaging. PET with 18F-FDG and PET/CT is used to diagnose and monitor the effects of treatment in lung cancer patients.[15] However, 18F-FDG is not a tumor-specific tracer, and false-positive findings can occur in inflammatory lesions.[16,17] Research shows that a malignant or benign SPN is often 18F-FDG intensified; therefore, 18F-FDG imaging might have a high false-positive rate.[18] For this reason, there is a need to identify new PET tracers for SPN detection. The thymidine analog 18F-FLT is a stable tumor cell proliferation imaging agent that has been widely used in humans.[19] Imaging of cellular proliferation provides an alternative noninvasive approach for the diagnosis and staging of lung cancer. Buck et al.[20] found that 18F-FLT uptake correlates better with the proliferation of lung tumors than does the uptake of 18F-FDG and might be more useful as a selective biomarker for tumor proliferation. 18F-FLT is a thymine analog and participates in DNA synthesis. 18F-FLT is catalyzed by the thymidine kinase-1 (TK-1) to form the 18F-FLT single phosphoric acid that is trapped in cells. TK-1 is a key enzyme in the DNA repair synthesis pathway and has extremely low activity in the resting stage of cell division but significantly higher activity during late G1-phase and S-phase.
The relationship between the A549 cell division cycle and 18F-FLT uptake showed a strong positive connection of the tracer uptake ratio of cells with TK-1 activity. When cell division and cell proliferation were markedly inhibited, the cells’ 18F-FLT uptake ratio was also obviously decreased, and the expression of the TK-1 level was obviously decreased as well. Therefore, the proliferation activities of tumor cell can be assessed by 18F-FLT uptake level.[21,22] Ki-67 is a proliferating cell nuclear antigen and a part of the cellular matrix. Similar to TK-1, Ki-67 expression is increased during the G1-, S-, G2-, and M-phases of cell division, but it is absent in G0-phase.[23] The relation between the 18F-FLT uptake of NSCLC and Ki-67 showed that 18F-FLT SUV of the lesions is positively correlated with Ki-67 scores. Therefore, 18F-FLT may be used to evaluate proliferation in patients with NSCLC.
In this study, we used cytology, animal models, and clinical data to evaluate the efficacy of the two tracers. In the cytological study, we investigated the 18F-FDG and 18F-FLT binding ability using lung cancer A549 cells. In the animal model experiment, we used micro-PET/CT imaging to study the animal xenograft of A549 cells with 18F-FDG or 18F-FLT. In the clinical assessment, we compared the diagnostic efficacies of 18F-FLT and 18F-FDG PET/CT for NSCLC, focusing on the correlation between 18F-FLT and 18F-FDG tumor uptake and tumor cell proliferation as indicated by the proliferation index Ki-67.
Our cytological study indicated that 18F-FDG is more favorable for the detection of lung cancer cells than 18F-FLT. The two tracers have a different metabolic pathway and reflect a different physiological process, and the differences in the imaging are likely due to differences in the levels of metabolic substrates (glucose and thymine). We observed that the glucose metabolic level was higher than the thymine metabolic level in A549 cells.
The relationship between cells or the tumor tissue proliferation index Ki-67 and tracers’ uptake showed a clear difference in SPN qualitative diagnosis. Cytological experimental results showed that the 18F-FDG uptake rate of A549 cells was higher than the 18F-FLT uptake rate. The tumor cell proliferation index Ki-67 showed no significant correlation with the 18F-FDG uptake rate and showed a significantly positive correlation with 18F-FLT uptake rate. The results showed that the glucose metabolism was higher than the nucleoside metabolism rate in tumor cells. 18F-FLT probe enables improved evaluation of lung cancer cell proliferation, and our study results are similar to previous reports.[21,24]
Our results of animal imaging showed that the tumor-to-nontumor uptake ratio of 18F-FDG was higher than that of 18F-FLT, similar to the cytological experimental results. This indicates that 18F-FDG is more efficient for the imaging of lung cancer than 18F-FLT. The tumor pattern detected by imaging with the two tracers was slightly different, and the 18F-FDG intensity was slightly higher than that of 18F-FLT. The differences between the two tracer patterns are likely due to the effects of microenvironment, blood circulation, or differences in metabolism or the involved pathways.[11]
The clinical trial results agreed with the cytology and animal experimental results. The 18F-FDG uptake pattern of lung cancer tissue was higher than that of 18F-FLT. The proliferation index Ki-67 was significantly positively correlated with 18F-FLT and 18F-FDG uptake rate. However, the results also showed that the Ki-67 and 18F-FLT uptake rate correlation was better. The Ki-67 and 18F-FDG correlation differences and the clinical results may suggest the influence of a cell environment factor. Of course, there are many factors that can affect lung cancer because of its complex components. Furthermore, A549 cell is a kind of human carcinomic alveolar basal epithelial cell, and its clinical pathological types include squamous cell carcinoma, adenocarcinoma, or adenosquamous carcinoma. Thus, the cytological experiments with 18F-FDG and 18F-FLT may reflect the metabolic characteristics of the tumor cells. The animal experimental results are closer to the clinical results.
Although the 18F-FDG uptake pattern of SPNs was higher than the 18F-FLT uptake pattern, the specificity of 18F-FLT imaging was higher than that of 18F-FDG and the sensitivity of 18F-FLT imaging was less than that of 18F-FDG. The two tracers showed similar accuracy. The 18F-FLT tracer may be more efficient for qualitative diagnosis of lung cancer. Further analysis showed that the SUV of 18F-FLT showed significant differences in tumor compared to inflammation, tuberculosis, and benign nodules, but showed no significant difference among inflammation, tuberculosis, and benign nodules. Thus, the 18F-FLT imaging of the tumor lesion showed a relative specificity.
18F-FDG imaging showed a significant difference between tumor and nonspecific inflammatory nodules but not a significant difference between tumor and tuberculosis nodules. This showed that there was an overlap between benign lesions and malignant lesions with 18F-FDG imaging. In addition, it suggests that tuberculosis nodules have strong 18F-FDG uptake characteristics. 18F-FDG reflects the amount of glucose utilization of live cells. The main energy source in most physiological and pathological processes in the human body is glucose, and phagocytosis activity and chemotaxis during inflammatory reaction can consume energy. Thus, these processes may influence 18F-FDG uptake. 18F-FLT takes part in DNA synthesis, and it is taken up only by rapidly proliferating cells, so the specificity of 18F-FLT is significantly higher than that of 18F-FDG. Tumor proliferation, inflammatory activity, and granuloma formation are all associated with DNA synthesis, but the 18F-FLT concentration corresponding to inflammatory activity or granuloma formation is lower than that of tumor cells. Additional 18F-FLT PET imaging could be used as a follow-up procedure to improve diagnostic accuracy after 18F-FDG PET imaging has given a positive result, but it is unable to allow determination of the benign or malignant status of the lesion.
A combination test using both 18F-FLT and 18F-FDG PET can improve the sensitivity and specificity for SPN diagnosis. The results presented in this study showed that the false-negative rate of 18F-FLT PET was higher than that of 18F-FDG. This difference may be related to the following factors: (1) 18F-FLT has the thymine 3’ end replaced by 18F. The affinity of 18F-FLT with the thymine transporter and TK-1 is only 30% of the normal activity with the thymine, and it is unable to be integrated into the DNA. Rasey et al.[22] reported that after coculture with3 H-thymidine and3 H-FLT with A549 lung cancer cells for 60 min,3 H-thymidine into DNA accounted for 90%, but3 H-FLT was only 0.2%. Mammalian cells produce dNTPs either by de novo synthesis or through the nucleoside salvage pathway. Schwartz et al.[25] observed the DNA synthesis in six kinds of cells and found that in two kinds of cells, there is mainly de novo synthesis of DNA with little contribution from TK-1 activity. (2) The tumor tissue is polyclonal and evolves. During different stages and for tumors of different pathological cell types, the number of cells in the proliferation period varies widely. These factors may affect the high false-negative rate of 18F-FLT imaging. In addition, 18F-FDG and 18F-FLT imaging may have false-negative results due to factors including lesion size, tumor cell density, tumor differentiation, and blood glucose level.
In conclusion, 18F-FDG is better than 18F-FLT for the cytological detection of lung cancer cells. However, 18F-FLT PET imaging is beneficial in the qualitative diagnosis in the small animal xenograft lung cancer model. According to clinical data, compared with 18F-FDG PET/CT imaging, 18F-FLT PET/CT imaging showed low sensitivity but high specificity for lung cancer diagnosis. 18F-FLT PET imaging can distinguish lung cancer from other SPNs. 18F-FDG PET imaging showed an overlap in the detection of lung cancer and tuberculosis. We speculate that the differences for these two tracers were due to effects of microenvironment or different metabolisms. Overall, our data suggest that a combination test of 18F-FLT and 18F-FDG PET can improve diagnostic specificity and accuracy.
Financial support and sponsorship
This study was supported by grants from the National Natural Science Foundation of China (No. 81271607), and the National Postdoctoral Science Foundation of China (No. 2015M572810).
Conflicts of interest
There are no conflicts of interest.
Footnotes
Edited by: Qiang Shi
References
- 1.Colt HG, Murgu SD, Korst RJ, Slatore CG, Unger M, Quadrelli S. Follow-up and surveillance of the patient with lung cancer after curative-intent therapy: Diagnosis and management of lung cancer, 3rded: American College of Chest Physicians evidence-based clinical practice guidelines. Chest. 2013;143(5 Suppl):e437S–54S. doi: 10.1378/chest.12-2365. doi: 10.1378/chest.12-2365. [DOI] [PubMed] [Google Scholar]
- 2.Goo JM, Park CM, Lee HJ. Ground-glass nodules on chest CT as imaging biomarkers in the management of lung adenocarcinoma. AJR Am J Roentgenol. 2011;196:533–43. doi: 10.2214/AJR.10.5813. doi: 10.2214/AJR.10.5813. [DOI] [PubMed] [Google Scholar]
- 3.Aberle DR, Abtin F, Brown K. Computed tomography screening for lung cancer: Has it finally arrived? Implications of the national lung screening trial. J Clin Oncol. 2013;31:1002–8. doi: 10.1200/JCO.2012.43.3110. doi: 10.1200/JCO.2012.43.3110. [DOI] [PMC free article] [PubMed] [Google Scholar]
- 4.Groheux D, Quere G, Blanc E, Lemarignier C, Vercellino L, de Margerie-Mellon C, et al. FDG PET-CT for solitary pulmonary nodule and lung cancer: Literature review. Diagn Interv Imaging. 2016;97:1003–17. doi: 10.1016/j.diii.2016.06.020. doi: 10.1016/j.diii.2016.06.020. [DOI] [PubMed] [Google Scholar]
- 5.Zhan P, Xie H, Xu C, Hao K, Hou Z, Song Y. Management strategy of solitary pulmonary nodules. J Thorac Dis. 2013;5:824–9. doi: 10.3978/j.issn.2072-1439.2013.12.13. doi: 10.3978/j.issn.2072-1439.2013.12.13. [DOI] [PMC free article] [PubMed] [Google Scholar]
- 6.Demir Y, Polack BD, Karaman C, Ozdogan O, Sürücü E, Ayhan S, et al. The diagnostic role of dual-phase (18) F-FDG PET/CT in the characterization of solitary pulmonary nodules. Nucl Med Commun. 2014;35:260–7. doi: 10.1097/MNM.0000000000000049. doi: 10.1097/MNM.0000000000000049. [DOI] [PubMed] [Google Scholar]
- 7.Yang W, Zhang Y, Fu Z, Yu J, Sun X, Mu D, et al. Imaging of proliferation with 18F-FLT PET/CT versus 18F-FDG PET/CT in non-small-cell lung cancer. Eur J Nucl Med Mol Imaging. 2010;37:1291–9. doi: 10.1007/s00259-010-1412-6. doi: 10.1007/s00259-010-1412-6. [DOI] [PubMed] [Google Scholar]
- 8.Yamamoto Y, Nishiyama Y, Ishikawa S, Nakano J, Chang SS, Bandoh S, et al. Correlation of 18F-FLT and 18F-FDG uptake on PET with Ki-67 immunohistochemistry in non-small cell lung cancer. Eur J Nucl Med Mol Imaging. 2007;34:1610–6. doi: 10.1007/s00259-007-0449-7. doi: 10.1007/s00259-007-0449-7. [DOI] [PubMed] [Google Scholar]
- 9.Fushiki H, Miyoshi S, Noda A, Murakami Y, Sasaki H, Jitsuoka M, et al. Pre-clinical validation of orthotopically-implanted pulmonary tumor by imaging with 18F-fluorothymidine-positron emission tomography/computed tomography. Anticancer Res. 2013;33:4741–9. [PubMed] [Google Scholar]
- 10.Schelhaas S, Wachsmuth L, Viel T, Honess DJ, Heinzmann K, Smith DM, et al. Variability of proliferation and diffusion in different lung cancer models as measured by 3’-Deoxy-3’-18F-fluorothymidine PET and diffusion-weighted MR imaging. J Nucl Med. 2014;55:983–8. doi: 10.2967/jnumed.113.133348. doi: 10.2967/jnumed.113.133348. [DOI] [PubMed] [Google Scholar]
- 11.Wang H, Zhang J, Tian J, Qu B, Li T, Chen Y, et al. Using dual-tracer PET to predict the biologic behavior of human colorectal cancer. J Nucl Med. 2009;50:1857–64. doi: 10.2967/jnumed.109.064238. doi: 10.2967/jnumed.109.064238. [DOI] [PubMed] [Google Scholar]
- 12.Ost D, Fein AM, Feinsilver SH. Clinical practice. The solitary pulmonary nodule. N Engl J Med. 2003;348:2535–42. doi: 10.1056/NEJMcp012290. doi: 10.1056/NEJMcp012290. [DOI] [PubMed] [Google Scholar]
- 13.Tian J, Yang X, Yu L, Chen P, Xin J, Ma L, et al. Amulticenter clinical trial on the diagnostic value of dual-tracer PET/CT in pulmonary lesions using 3’-deoxy-3’-18F-fluorothymidine and 18F-FDG. J Nucl Med. 2008;49:186–94. doi: 10.2967/jnumed.107.044966. doi: 10.2967/jnumed.107.044966. [DOI] [PubMed] [Google Scholar]
- 14.Tan Y, Tian J, Zhao Z, Chen P, Yang X, Yu L, et al. Analysis on the false positive and false negative cases in 18F-FDG and 18F-FLT PET/CT imaging for pulmonary nodules (In Chinese) Chin J Med Imaging. 2008;16:321–4. [Google Scholar]
- 15.Sahiner I, Vural GU. Positron emission tomography/computerized tomography in lung cancer. Quant Imaging Med Surg. 2014;4:195–206. doi: 10.3978/j.issn.2223-4292.2014.03.05. doi: 10.3978/j.issn.2223-4292. [DOI] [PMC free article] [PubMed] [Google Scholar]
- 16.Shim SS, Lee KS, Kim BT, Chung MJ, Lee EJ, Han J, et al. Non-small cell lung cancer: Prospective comparison of integrated FDG PET/CT and CT alone for preoperative staging. Radiology. 2005;236:1011–9. doi: 10.1148/radiol.2363041310. doi: 10.1148/radiol.2363041310. [DOI] [PubMed] [Google Scholar]
- 17.Yang W, Fu Z, Yu J, Yuan S, Zhang B, Li D, et al. Value of PET/CT versus enhanced CT for locoregional lymph nodes in non-small cell lung cancer. Lung Cancer. 2008;61:35–43. doi: 10.1016/j.lungcan.2007.11.007. doi: 10.1016/j.lungcan2007.11.007. [DOI] [PubMed] [Google Scholar]
- 18.Yang W, Zhang Y, Fu Z, Yu J, Sun X, Mu D, et al. Imaging of proliferation with 18F-FLT PET/CT versus 18F-FDG PET/CT in non-small-cell lung cancer. Eur J Nucl Med Mol Imaging. 2010;37:1291–9. doi: 10.1007/s00259-010-1412-6. doi: 10.1007/s00259-010-1412-6. [DOI] [PubMed] [Google Scholar]
- 19.Szyszko TA, Yip C, Szlosarek P, Goh V, Cook GJ. The role of new PET tracers for lung cancer. Lung Cancer. 2016;94:7–14. doi: 10.1016/j.lungcan.2016.01.010. doi: 10.1016/j.lungcan.2016.01.010. [DOI] [PubMed] [Google Scholar]
- 20.Buck AK, Herrmann K, Shen C, Dechow T, Schwaiger M, Wester HJ. Molecular imaging of proliferation in vivo: Positron emission tomography with [18F] fluorothymidine. Methods. 2009;48:205–15. doi: 10.1016/j.ymeth.2009.03.009. doi: 10.1016/j.ymeth.2009.03.009. [DOI] [PubMed] [Google Scholar]
- 21.Eriksson S, Munch-Petersen B, Johansson K, Eklund H. Structure and function of cellular deoxyribonucleoside kinases. Cell Mol Life Sci. 2002;59:1327–46. doi: 10.1007/s00018-002-8511-x. [DOI] [PMC free article] [PubMed] [Google Scholar]
- 22.Rasey JS, Grierson JR, Wiens LW, Kolb PD, Schwartz JL. Validation of FLT uptake as a measure of thymidine kinase-1 activity in A549 carcinoma cells. J Nucl Med. 2002;43:1210–7. [PubMed] [Google Scholar]
- 23.Gerdes J, Lemke H, Baisch H, Wacker HH, Schwab U, Stein H. Cell cycle analysis of a cell proliferation-associated human nuclear antigen defined by the monoclonal antibody Ki-67. J Immunol. 1984;133:1710–5. [PubMed] [Google Scholar]
- 24.Chalkidou A, Landau DB, Odell EW, Cornelius VR, O’Doherty MJ, Marsden PK. Correlation between Ki-67 immunohistochemistry and 18F-fluorothymidine uptake in patients with cancer: A systematic review and meta-analysis. Eur J Cancer. 2012;48:3499–513. doi: 10.1016/j.ejca.2012.05.001. doi: 10.1016/j.ejca.2012.05.001. [DOI] [PubMed] [Google Scholar]
- 25.Schwartz JL, Tamura Y, Jordan R, Grierson JR, Krohn KA. Monitoring tumor cell proliferation by targeting DNA synthetic processes with thymidine and thymidine analogs. J Nucl Med. 2003;44:2027–32. [PubMed] [Google Scholar]


