

Abstract
Superparamagnetic iron oxide nanoparticles (SPIONs) are used for a wide range of biomedical applications requiring precise control over their physical and magnetic properties, which are dependent on their size and crystallographic phase. Here we present a comprehensive template for the design and synthesis of iron oxide nanoparticles with control over size, size distribution, phase, and resulting magnetic properties. We investigate critical parameters for synthesis of monodisperse SPIONs by organic thermal decomposition. Three different, commonly used, iron containing precursors (iron oleate, iron pentacarbonyl, and iron oxyhydroxide) are evaluated under a variety of synthetic conditions. We compare the suitability of these three kinetically controlled synthesis protocols, which have in common the use of iron oleate as a starting precursor or reaction intermediate, for producing nanoparticles with specific size and magnetic properties. Monodisperse particles were produced over a tunable range of sizes from approximately 2–30 nm. Reaction parameters such as precursor concentration, addition of surfactant, temperature, ramp rate, and time were adjusted to kinetically control size and size-distribution, phase, and magnetic properties. In particular, large quantities of excess surfactant (up to 25:1 molar ratio) alter reaction kinetics and result in larger particles with uniform size; however, there is often a trade-off between large particles and a narrow size distribution. Iron oxide phase, in addition to nanoparticle size and shape, is critical for establishing magnetic properties such as differential susceptibility (dm/dH) and anisotropy. As an example, we show the importance of obtaining the required size and iron oxide phase for application to Magnetic Particle Imaging (MPI), and describe how phase purity can be controlled. These results provide much of the information necessary to determine which iron oxide synthesis protocol is best suited to a particular application.
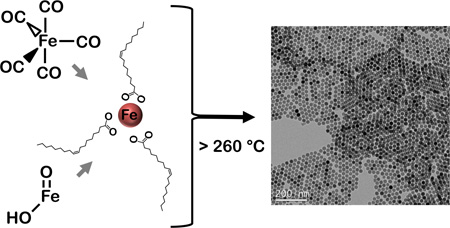
Graphical abstract
1. Introduction
Superparamagnetic iron oxide nanoparticles (SPIONs) have suitable magnetic properties and biocompatibility for a variety of biomedical applications, ranging from imaging to diagnostics, targeting, and therapy.1 Iron oxide nanoparticles are generally safe for intravenous injection, with years of clinical history,2–4 and multiple examples of clinically approved iron oxide nanomaterials for various applications.3, 5 Iron oxide particles can be tailored for long circulation times with no expected renal involvement in clearance, by tuning their hydrodynamic sizes to 15–100 nm.6–8 Iron oxides are cleared by the mononuclear phagocyte system and the iron is captured and enters the body’s iron cycle. This is particularly important, as many contrast agents such as iodine-based X-ray and computed tomography (CT) agents, and gadolinium MRI agents, are cleared by the kidneys, and cause significant morbidity in patients with chronic kidney disease.9–12 SPIONs have been applied as T1 and T2 MRI contrast agents13, and several compounds have received regulatory approval for clinical use.3, 5 SPIONs have additionally been used as contrast agents for photoacoustic imaging.14 Therapeutic applications using the magnetic response of the SPIONs have also been proposed, for example, magnetic fluid hyperthermia (MFH).15, 16 A recent interest in SPION tracers has focused on Magnetic Particle Imaging (MPI), a novel real-time whole body imaging modality developed by Philips in 2005.17 Since then, much progress has been made optimizing synthesis of monodisperse SPION tracers with median core sizes tuned for MPI.18–20
Particle size, phase, morphology, and interactions with immediate environment determine SPION magnetic properties and must be tailored for the specific application.21, 22 For example, 16 nm SPIONs have been shown to be optimal for MFH (with a 373 kHz, 14 kA/m field), with broader distributions decreasing heating efficiency.23 Monodisperse 24–26 nm SPIONs have shown significantly improved MPI performance (i.e. enhanced signal intensity and spatial resolution) at 25 kHz, with smaller 15 nm particles showing better performance at 250 kHz.18, 19 This is consistent with theoretically modeled MPI tracer performance, although the precise optimal size is dependent on magnetocrystalline and shape anisotropies.7, 24 For T1 MRI contrast, ultrasmall (<5nm) SPIONs are optimal due to increased r1 relaxivity, attributed to high surface concentrations of Fe3+.25 For T2 MRI contrast, larger SPIONs have shown improved r2 relaxivity.26 These applications rely on superparamagnetic behavior of the nanoparticles, so phase-pure and size-tuned magnetite (Fe3O4) or maghemite (γ-Fe2O3) are generally required. Presence of antiferromagnetic wüstite (FeO) or hematite (α-Fe2O3) phases will significantly reduce performance for most of these applications. Because these size and magnetic properties are a direct result of the nanoparticle synthesis, it is necessary to understand how synthetic conditions impact nucleation and growth of nanoparticles. Determining and monitoring critical synthesis parameters such as temperature, time, and precursor concentrations will also improve SPION synthesis reproducibility in order to achieve the required phase and median core sizes desired for each application.
Much of the nucleation and growth behavior of these nanoparticle systems can be qualitatively interpreted with classical theories. LaMer supersaturation27 and Ostwald ripening28 processes explain much of what is observed, especially in synthetic methods that are kinetically controlled. More complete models have been developed that predict a wider possible range of growth behaviors dependent on, for example, competing diffusion and adsorption rates of growth species.29, 30 Nucleation and growth models have long been established in the limiting cases of diffusion and interface reaction controlled growth30, and more recently in our fully coupled treatment bridging the gap between these two limits29. Diffusivity, reaction coefficient, and surface energy data are not always available for these systems and experimental measurements of these parameters are not always feasible. Nonetheless, it is important to consider how synthetic parameters influence nucleation and growth rates, and how this affects the final crystal structure, morphology and properties of the nanoparticles.
Historically there have been several approaches to nanoparticle synthesis, with varying degrees of synthetic control over size and monodisperisty. Many metal nanoparticles have been produced by aqueous reduction of metallic salts.31–36 Multicomponent nanoparticles, in this case iron oxides, such as Resovist® and Feridex®, can be synthesized by similar aqueous co-precipitation reactions;37, 38 however, organic phase syntheses generally provide the highest degree of size control.39–42 These organic phase syntheses typically rely on the decomposition of iron carboxylate salts (e.g. iron [III] oleate) which plays a critical role in the kinetics of the subsequent nucleation and growth processes.39, 40, 43 Although other precursors have been explored, for example iron oxyhydroxides such as goethite or ferrihydrites, iron carboxylates likely form as intermediates in these reactions as well.43–45 The solvent and surfactant can be substituted with other similar fatty acids to adjust the boiling point and subtly alter surface energies for shape control, or oxidation strength for phase control.46 Presence of impurities can similarly impact the reaction, for example addition of sodium oleate to iron oleate has been shown to produce wüstite-magnetite core-shell nanocubes.47 Most biomedical applications require phase-pure, spherical SPIONs so such impurities are generally avoided.
Here we evaluate and compare synthesis of iron oxide nanoparticles from decomposition of three common iron containing precursors — iron (III) oleate (Fe[C18H33O2]3), or iron oxyhydroxide (FeOOH), or iron pentacarbonyl (Fe[CO]5). These precursors have been selected for comparison because they have been widely used in the synthesis of monodisperse iron oxide nanoparticles by thermal decomposition, and formation and decomposition of iron oleate is critical to all three reactions.39, 40, 43 While these individual protocols have been previously reported, they have not been compared, nor evaluated for their capability to produce iron oxide nanoparticles with specific size and phase-purity requirements. We find that the iron pentacarbonyl synthesis is particularly suited for production of small (<10 nm) SPIONs. Iron oleate can also be used to synthesize small particles, while both iron oleate and oxyhydroxide are suited to production of larger (10–30 nm) particles. Magnetic and crystalline properties of many nanoparticles are improved by post-synthesis annealing, but this is particularly necessary in the iron pentacarbonyl protocol or synthesis of nanoparticles larger than 22nm (with FeOOH or iron oleate methods), where wüstite phase impurities are common. To uniquely determine iron oxide phase, complimentary characterization techniques are generally necessary. In this work, X-ray (XRD) and selected area electron diffraction (SAED), Raman spectroscopy, and Electron Energy Loss Spectroscopy (EELS) are used together to characterize SPION phase and phase-purity.
2. Experimental
Iron oxide nanoparticles were grown by thermal decomposition in organic solvents. Three different precursors were investigated and compared: iron (III) oleate, iron pentacarbonyl, and iron oxyhydroxide, with synthesis protocols adapted from literature.39, 40, 43 Typically excess surfactant, i.e. oleic acid, was added to adjust growth kinetics and tailor size and distribution. Throughout this work we primarily use the surfactant/solvent combination of oleic acid and 1-octadecene for simplicity, ease of comparison, and because they have been widely used for the synthesis of iron oxide nanoparticles. Particles were characterized according to their size, morphology, phase, and magnetic properties. An additional, controlled oxidation procedure was performed after synthesis, when needed, to optimize phase purity and magnetic properties. As-synthesized particles are terminated with oleic acid and are hydrophobic. They can be kept in organic solvents such as chloroform and hexane for characterization, but for most biomedical applications SPIONs are made water soluble by an aqueous phase-transfer procedure.23, 48–50
2.1 Nanoparticle syntheses
2.1.1 Iron (III) Oleate40
To form iron(III) oleate, iron chloride (FeCl3·6H2O, Alfa Aesar, 97–100%) and sodium oleate (TCI, 95%) were dissolved in a 4:3:7 ratio solution of ethanol, deionized water, and hexanes. The solution was then heated under argon to reflux and held for four hours. The resulting product was then transferred to a separating funnel and the aqueous layer was removed. The remaining organic layer was washed with deionized water three times. After washing, the solution was dried with sodium sulfate (anhydrous, Sigma Aldrich) and remaining solvent was evaporated off, leaving behind the iron (III) oleate complex. The iron (III) oleate was finally dissolved in 1-octadecene (Alfa Aesar, 90%) at the desired molar ratio (0.1698 mmol/g, unless noted) to form the precursor solution.
Thermal decomposition of this iron (III) oleate precursor solution forms iron oxide nanoparticles. Under argon, the precursor was heated to reflux at 320°C at 3°C/min, or 10°C/min in the syntheses without excess oleic acid. The initially rusty brown solution darkens once heated to around 150°C. Starting just above 200°C the solution becomes a translucent tea color. The solution remains this color until nanoparticle nucleation, at which point it becomes dark black. In syntheses from the as-described precursor, nucleation begins immediately above 250°C. However, by adding excess oleic acid to the precursor, nucleation was delayed up to several hours. After nucleation, particles were allowed to grow and age for up to 24 hours or more, until the desired size was reached. After aging, particles were extracted, and washed several times in a chloroform/methanol solution in a 3:2 ratio, and separated with a permanent magnet.
2.1.2 Iron Pentacarbonyl15, 39
Oleic acid (Sigma, 99%) was mixed with octyl ether (10 mL), injected into an argon-purged three-neck flask with a glass syringe, and heated. Upon reaching a temperature of 100°C, 0.2 mL (1.52 mmol) of iron pentacarbonyl (Sigma) was injected into the solution and the temperature was increased to reflux at 283°C. Nucleation was evident by a darkening of the solution over approximately 30 seconds. Particle size was controlled by varying the molar ratio of oleic acid to iron pentacarbonyl, where final size is proportional to this ratio. After nucleation, the solution was refluxed for an additional 1.5 hours. At this point iron oxide nanoparticles had formed. As-synthesized nanoparticles show poor crystallinity, as well as presence of anti-ferromagnetic wüstite, and so must be subsequently optimized. Following synthesis, nanoparticles were oxidized with the addition of Trimethylamine N-oxide (TMANO) to optimize phase and crystallinity (§2.1.4).
2.1.3 Iron Oxyhydroxide43
Iron oxyhydroxide (Iron(III) oxide - hydrated, Sigma-Aldrich, presumably goethite: α-FeOOH) was mixed with oleic acid, with FeOOH to oleic acid molar ratios ranging from 1:15 to 1:20, and1-octadecene in a 250 mL three-neck round bottom flask. The reaction flask was purged with argon and heated to 120°C for approximately one hour. Then, the temperature was increased to 320°C at 15°C/min and held for 24 hours. The resulting nanoparticles were collected with a permanent magnet and washed with organic solvents as described previously (§2.1.1). Crystallographic and magnetic properties may be optimized by annealing after synthesis (§2.1.5).
2.1.4 Oxidation with Trimethylamine N-oxide (TMANO)
For the oxidation process, the solution was cooled to room temperature. One neck of the flask was opened while argon continued to flow, and Trimethylamine N-oxide (TMANO, 0.34 g or 4.66 mmol) was added to the solution, the flask was closed again and everything was allowed to mix at 130°C for 2 hours. During this time the color changed from black to red. Afterwards, the solution was heated to reflux for 1 hour during which time the color turned dark black, indicating the formation of magnetite. The solution was cooled to room temperature and washed with ethanol to remove excess TMANO and unattached oleic acid.
2.1.5 Oxidation by Annealing
Following synthesis, the reaction products were placed in a 250 mL three neck flask. Two necks were open to ambient air and the third was capped with a septum so the thermocouple could be held in place. The solution was brought to temperature (100°C, unless otherwise noted) at 5°C/min while stirring at 400 rpm. 5 mL aliquots were taken at semi-regular intervals (0, 3, 6, and 12 hours). The product was purified by washing several times with 3:2 chloroform/methanol solution, and allowed to dry in vacuum before characterization.
2.2 Physical, structural, and magnetic characterization
The iron (III) oleate complex is an important intermediate in all three nanoparticle syntheses,43, 46, 51 so thermal gravimetric analysis (TGA), differential scanning calorimetry (DSC) (both TA Instruments) were performed to evaluate the decomposition of iron (III) oleate. Nanoparticles were characterized by TEM (300 kV FEI Titan 80–300™, and 200 kV FEI Tecnai f20, both with Gatan CCD cameras), θ - 2θ powder X-ray diffraction (Rigaku, and Bruker F8 Focus), and Raman spectroscopy (Renishaw inVia) to determine morphology, size, size distribution and phase. The FEI Titan 80–300™ TEM is equipped with a Gatan Image Filter and Electron Energy Loss Spectrometer. Iron valence in SPIONs was estimated by measuring the ratio of white lines, the iron L2 and L3 electron core-shell transitions with Electron Energy Loss Spectroscopy (EELS). Here, the integrated intensity of the iron L2 and L3 peaks were measured from the second derivative of the raw spectrum using numerical filters available in Gatan Digital Micrograph, with a 4.1 eV positive and 1.7 eV negative window width.52, 53 Raman spectra were obtained from 1 mg of dried nanoparticle powder on aluminum using a 514nm laser, reduced from 15 mW to approximately 0.15 mW using filters, and six, 60 second scans were summed together. XRD samples were prepared with 2–3 mg of dried nanoparticle powder spread out on double-sided tape on a microscope slide.
Magnetic characteristics were evaluated using a Vibrating Sample Magnetometer (VSM) (Lakeshore, Weterville, OH) and custom-built54 Magnetic Particle Spectrometer (MPS). Differential susceptibility (dm/dH or χdiff[H]) was measured using the MPS, with a 18.6mTµ0−1 sinusoidal excitation field at 25kHz. MPS plots were normalized to compare the full width at half maximum (FWHM), which is an indicator of the potential spatial resolution in MPI scanners.8, 54 The median magnetic core size and distribution were determined from VSM magnetization curves using the Chantrell method.55 The initial susceptibility (χi), coercivity (H0), and saturation magnetization (Ms) of the nanoparticles were experimentally determined and fit to a Langevin function, using 446 kA/m as bulk Ms for magnetite.56 As previously mentioned, magnetocrystalline and shape anisotropies are critical to SPION performance, in particular for MPI and MFH.7, 16, 24, 57 Anisotropy constants for our nanoparticles have previously been measured to be on the order of 3.5 ± 3.0 kJ/m3 for 25 nm SPIONs, well below bulk values of approximately 11 kJ/m3.58, 59
Where sizes are reported, unless otherwise noted, they are median diameter as determined by this fitting procedure. Error bars represent first standard deviation of the log-normal size distribution. VSM size estimates, and volumetric measurement techniques in general, are better statistical representations of a sample as they analyze millions of particles compared to TEM measurements that, at best, include thousands of particles. However, Chantrell fitting assumes a log-normal distribution, and that particles are superparamagnetic. If particles are ferro- or antiferromagnetic, or the size distribution is not log-normal, the results will be inaccurate. Thus, both TEM and VSM are complimentary techniques providing valuable information.
3. Results and Discussion
3.1 Iron (III) Oleate
3.1.1 Thermal Characteristics of Iron (III) Oleate
Understanding the decomposition of the iron (III) oleate complex as a function of temperature and time is critical to designing a nanoparticle synthesis that produces SPIONs of the required size, size distribution, and phase. Iron (III) oleate is either used as the precursor directly, or forms as an intermediate as iron ions coordinate with oleic acid in solution.43 Figure 1a shows TGA, derivative of TGA, and DSC for the iron (III) oleate complex. TGA was performed on purified iron (III) oleate, and DSC was performed on iron (III) oleate in 1-octadecene (0.1698 mMol iron/g solution) as the solvent. Mass loss events, such as decomposition of organics and subsequent off-gassing, are observed with TGA. Three mass losses are distinctly observed, centered approximately at 193.6°C, 260.4°C, and 330.5°C. We attribute the first two mass losses to the dissociation of the oleate ligands. There are three oleate ligands coordinated to each iron atom with differing binding energies, two symmetric ligands (7.0 and 10.5 eV) and a third asymmetric ligand (39.2 eV).51 The thermal transitions observed correspond to the detachment of the first two ligands, followed by the more tightly bound third.40, 51 These two mass losses are very small, not accounting for the full mass of the oleate ligands. Well below the boiling point of oleic acid (360°C), this small mass loss is due to off gassing CO2 produced during the ketonic decarboxylation reaction.51 The remaining mass above 400°C is approximately 18%, including the anticipated 8.5% magnetite plus residual organics. DSC was performed on the purified iron (III) oleate complex, dissolved in 1-octadecene, also shown in Figure 1a. We observed two endothermic events around 165°C and 240°C which correspond to sequential decomposition of the iron (III) oleate complex. These occur just before two key mass loss events are observed in the TGA, and may be attributed to the same ligand dissociation. The temperature ranges we determine for these reactions, bounded by our TGA and DSC events, are 165–195°C (labeled ii on Figure 1a) for the symmetric ligands, and 240–260°C (Figure 1a, labeled i) for the asymmetric ones, are consistent with simulations and previous studies.51 In the case of an iron complexed to a single oleate ligand, Density Functional Theory (DFT) calculations predict that the formation of an iron-oxygen bond is energetically favored51, 60.
Figure 1.

(a) TGA (W, Weight), derivative of TGA (dW/dT), and DSC (Heat Flow) of iron (III) oleate. (b) Size versus temperature for iron oxide nanoparticles synthesized by thermal decomposition of iron (III) oleate in 1-octadecene with a concentration of 0.1698 mmols of iron per gram of solution. Precursor was heated at 10°C/min until the specified temperature was reached, and a 1mL aliquot was removed from heat and quenched. Where indicated, the solution was allowed to age for a number of hours and another aliquot was taken. (c) and (d) are TEM micrographs of the particles synthesized at 290°C and 320°C, respectively. (e) Selected Area Diffraction Pattern from the 320°C sample, indexed as an inverse-spinel structure.
To synthesize small (<10 nm) iron oxide nanoparticles, iron oleate was heated in 1-octadecene. The solution was heated toward the set point (275°C, 290°C, or 320°C) at a rate of 10°C/minute. Based on the observed color change, from rusty brown to black, nucleation occurs at approximately 250°C. An aliquot was taken as soon as the solution reached the set temperature, and again after one hour and 10 hours of aging for the 290°C and 320°C syntheses. Figure 1b displays the size as a function of this maximum growth temperature, both as determined from magnetic fitting, and as measured from TEM. There is some discrepancy in the VSM and TEM size measurements. This may be attributed to loss of TEM contrast at the edge, where the particle may only be a few atoms thick. Alternately, a magnetic dead layer on the surface, phase impurity (see Section 3.4), or particle interaction may also lead to inaccuracies in Chantrell fitting55 results.
Growth proceeds quickly following nucleation at 250°C and there was little difference in size or distribution between particles at nucleation, or when aged at 320°C for 1 or 10 hours. Under these conditions, the excess iron in this supersaturated solution precipitates rapidly followed by a short growth period with little effect of aging. TEM micrographs (Figures 1c and 1d) show single crystalline particles, as indicated by uniform contrast within each particle. The smallest (< 5nm) particles are irregular crystallites, and larger particles appear roughly spherical. Figure 1e shows an example Selected Area Electron Diffraction (SAED) pattern from the 320°C sample, with the characteristic inverse-spinel peaks of magnetite. Using 1-octadecene as solvent, with no additional surfactant, particles up to 10 nm were synthesized. It has been previously shown that higher synthesis temperatures, in higher boiling solvents, produce larger particles.40 To produce larger particles in 1-octadecene, it was necessary to dilute with excess surfactant, e.g. oleic acid.
3.1.2 Addition of Excess Oleic Acid
By adding excess oleic acid, particle size was tuned from approximately 10 to 25 nm. Excess oleic acid altered the reaction beyond just reducing the concentration. Figure 2 shows the effect of independently changing either (a) the excess oleic acid, from 0 to 25:1 molar ratio of additional oleic acid to iron (III) oleate, or (b) the iron concentration, from 0.02 mmol/g to 0.08 mmol/g. Addition of excess oleic acid resulted in a slower reaction, as indicated by the growing magnetic size over the course of the first several hours of the reaction (Figure 2c). Diluting with a non-coordinating solvent, i.e. excess 1-octadecene, also increases the size, but broadens the distribution. This is due to reducing the iron supersaturation prior to nucleation, and is a qualitatively explained by LaMer supersaturation theory.27
Figure 2.

Superparamagnetic iron oxide nanoparticles produced by thermal decomposition of iron (III) oleate in the presence of excess oleic acid. Size is shown as a function of (a) precursor concentration, (b) excess oleic acid, and (c) aging time. All sizes are median diameter (DM) and error bars represent the first standard deviation of the log-normal size distribution (σ), determined by fitting VSM measurements. TEM images of particles of various sizes (d, scale bar 100 nm). High resolution TEM of nanoparticles synthesized from FeOOH (e), Fe(CO)5(f), and iron(III) oleate (g) (5 nm scale).
The growth profiles for several excess surfactant ratios are shown in Figure 2c. In all cases, 0.5 mmol of iron (III) oleate in 2.95g of 1-octadecene are reacted with the specified ratio of excess oleic acid. One mL aliquots were taken throughout the reaction, quenched to arrest growth, and particle size was determined from magnetic properties. Excess oleic acid delays nucleation from around 1.5 hours for a 1:5 ratio up to approximately 2.5 hours for a 1:19 ratio. Prior to nucleation, no nanoparticles are observed in solution by any of our characterization methods. In this particular protocol, the magnetic size increases over the course of several hours following nucleation (Figure 2c). By 12 hours after nucleation the particles have nearly reached their maximal magnetic size. Particles are typically monodisperse, although either adding oleic acid (Figure 2a) or reducing iron concentration (Figure 2b) increases the size and broadens the size distribution.
Figures 2d shows some example TEM images of nanoparticles produced by decomposition of iron oleate. HRTEM confirms that nanoparticles are single crystalline (Figure 2e). They are approximately spherical, and facetted. This is to be expected for a single crystal nanoparticles with a cubic unit cell. This morphology is a compromise between minimizing surface energy, while remaining single crystalline. No defects or twinning are apparent from the micrographs. The particle edges are sharp and well-defined, and no amorphous regions or grain boundaries are observed within the particles. This is consistent with growth from small clusters, and by surfactant-mediated adsorption of growth species. These observations appear to be true across all size ranges. However, faceting does become more apparent at larger sizes. This can be qualitatively explained with an argument similar to the Wulff construction61, however these nanoparticles are not formed at equilibrium. High surface energy facets grow fastest, eventually disappearing into the crystal’s corners and edges. After a long enough growth time, a nanocrystal will be terminated by its low-energy facets. Application of the Wulff construction has been recently used to predict equilibrium shapes of nanoparticles synthesized in-situ.62, 63
3.2 Iron Pentacabonyl
Iron pentacarbonyl decomposes when exposed to heat to form iron oxide nanoparticles. A critical difference between this and the previously described iron (III) oleate synthesis, is the additional Fe(CO)5 decomposition step. The iron pentacarbonyl decomposes and releases CO, and oleic acid likely substitutes onto this partially decomposed intermediate to form an iron oleate complex. This iron oleate complex finally decomposes, and nanocrystals nucleate and grow. When mediated by a surfactant, size and morphology can be controlled. Excess oleic acid delays nucleation, and also results in larger nanoparticle size, from only a few nanometers in diameter at a 1.5:1 excess oleic acid ratio, to more than 10 nm at 2.5:1. Figure 3 shows the effect of the oleic acid ratio on both time until nucleation, and particle diameter. Both size and nucleation time increase with the surfactant to iron ratio. However, extension of the nucleation process also results in a broader size distribution. This is apparent in the inset TEM image of particles synthesized at a 3:1 oleic acid to iron pentacarbonyl ratio. Beyond this ratio, we did not achieve monodisperse particles. TEM images of these nanoparticles show slight faceting, and uniform contrast indicating they are crystalline (see inset TEM in Figure 3). High resolution TEM (Figure 2f) confirms the particles are single crystalline, and also shows no visible defects. Where uniform nanoparticle properties are required, iron oxide phase purity and crystallite quality is of concern. Using this protocol, iron oxide particles typically form as wüstite, an antiferromagnetic phase with a low Néel temperature and undesirable magnetic properties. Nanoparticles synthesized from Fe(CO)5 are always subjected to a oxidation with TMANO and annealing (§2.1.4). Phase purity and control are discussed in more detail in §3.4. The following iron oxyhydroxide synthesis also produces iron (III) oleate as an intermediate, without the difficult-to-reproduce injection step used in this Fe(CO)5 protocol.
Figure 3.

Size and time to nucleation of iron oxide nanoparticles by thermal decomposition of Fe(CO)5 as a function of molar ratio of oleic acid in the precursor. Increasing the excess oleic acid ratio delays nucleation and results in larger particles. TEM micrographs show highly monodisperse particles until, in this case, approximately 2.5:1.
3.3 Iron Oxyhydroxide
The thermal decomposition of iron oxyhydroxide, in the presence of excess oleic acid, is conceptually similar to the iron pentacarbonyl approach. Iron (III) oleate probably forms as an intermediate throughout this reaction.43 However, unlike the Fe(CO)5 protocol, all precursor components are stable when mixed at ambient conditions, until heated. This synthesis can therefore be carried out in a single flask, and the precursor can be prepared in air. Eliminating the need for a rapid injection of one of the components reduces much experimental variation, and improves reproducibility.
Figure 4 below shows the nanoparticle diameter and distribution for several excess surfactant ratios with TEM images overlaid. This set of syntheses demonstrates the process of tuning nanoparticle size by adding excess surfactant. Particle size increased with increasing surfactant ratio, but only to a point. In this particular batch, above 17:1 molar parts excess oleic acid, the nanoparticles were polydisperse. Beyond this ratio, size increased, but the distribution broadened. The TEM images show particles produced at 20:1 are clearly polydisperse. Such a broad size distribution causes wide variation in magnetic properties and results in open loop VSM and unreliable fitting results.
Figure 4.

Particle size versus excess oleic acid ratio for iron oxide nanoparticles produced by thermal decomposition of iron oxyhydroxide. Median diameter and distribution is fit from VSM measurements. Insets are TEM micrographs from each sample.
3.4 Phase purity, characterization, and control
Iron oxide phase is a major factor influencing magnetic properties of nanocrystals, and therefore affects performance of SPION tracers for MPI, MRI, and other applications. Magnetic properties of phase-pure magnetite nanoparticles are compared to mixed-phase nanoparticles of similar size, and commercially available Resovist® (Figure 5). Resovist® is synthesized by co-precipitation, is not monodisperse, and often contains clusters. The FWHM of the differential susceptibility (dm/dH), measured by MPS (Figure 5a), is an indication of potential MPI spatial resolution18, 22 and here is narrowest for phase-pure magnetite nanoparticles. VSM measurements (Figure 5b) also show decreased saturation field and increased susceptibility for the phase-pure magnetite compared to mixed-phase. However, the mixed phase nanoparticles performed the worst, both in terms of FWHM of MPS and the VSM, despite being monodisperse. Phase impurities can have just as important an effect on magnetic properties as size distribution of SPIONs.
Figure 5.

Differential susceptibility (dm/dH) from MPS (a) and m(H) from VSM (b) of iron oxide nanoparticles with comparable physical size (DM ~ 25 nm from TEM) but differing iron oxide phase: pure magnetite (Fe3O4), mixed wüstite/magnetite (FeO@Fe3O4), or commercially available Resovist®.
Phase control is therefore a critical consideration in iron oxide nanoparticle synthesis. The four stable or metastable iron oxide phases are wüstite (FeOx), magnetite (Fe3O4), maghemite (γ-Fe2O3), and hematite (α-Fe2O3). Wüstite and hematite are antiferromagnetic and unsuitable for most applications. Fortunately, wüstite can be readily transformed to superparamagnetic magnetite after synthesis by annealing in air (§2.1.5 and Figure 6c), or introduction of an oxidizing agent, such as TMNAO (§2.1.4 and Figure 6d).
Figure 6.

(a) Raman spectroscopy of iron oxide nanoparticles synthesized from iron(III) oleate and characterized at nucleation and after 24 hours of aging. (b) Synthesized from FeOOH, and oxidized to maghemite (c) XRD, θ - 2θ scans, of iron oxide nanoparticles synthesized form FeOOH. Particles were annealed at 100°C for various times to optimize phase and crystallinity. The peaks observed on annealing can be readily indexed as magnetite. (d) XRD of iron oxide nanoparticles produced by thermal decomposition of Fe(CO)5. Aliquots were taken throughout the synthesis (§2.1.1), and during subsequent oxidation (§2.1.4). Particles initially form as wüstite (FeO1-x), as indicated by the (111), (200) and (220) wüstite peaks in aliquots 1–5. During oxidation (aliquots 6–9) magnetite peaks clearly develop. A second reflux step (aliquots 10 and 11) optimizes the crystallinity, as indicated by sharpening of peaks.
Previous studies have shown the importance of gas composition on the resulting iron oxide phase, in particular the effect of CO on reduction of Fe3O4 to FeO.64, 65 Presence of oxygen in the system transforms CO to CO2 and prevents reduction of Fe3O4 to FeO by CO. The CO and CO2 are most likely byproducts of partial combustion of organics.64 For the decomposition of iron pentacarbonyl, CO gas is produced directly by the precipitation reaction, so gas composition has a direct affect on reaction rate and equilibrium.66 Reactions in this work were performed under argon and phase was characterized and optimized after synthesis.
Figure 6c shows an example of phase optimization by post-reaction annealing (§2.1.5). Here nanoparticles were synthesized by thermal decomposition of FeOOH. In this example, the as-synthesized particles show poor crystallinity in X-ray diffraction scans; peaks are hardly visible above the noise. The sample may contain nanoparticles of varying oxygen content (multiple phases), or may have poor crystallinity. After annealing for several hours magnetite was detectable. Crystallinity improved with additional annealing, as indicated by the formation of more well-defined magnetite peaks.
The iron oxide phases differ both crystallographically and electronically based on the valence state of the iron. Magnetite and wüstite are crystallographically distinct and discernable using X-ray or electron diffraction. However, because both magnetite and maghemite are inverse-spinels with similar lattice spacing, distinguishing between these two phases with diffraction is difficult for crystals smaller than approximately 20 nm, since diffraction peaks are too broad to resolve some of the expected differences between magnetite and maghemite. To determine the phase of an iron oxide definitively, complimentary characterization techniques are typically necessary, for example both diffraction experiments (X-ray or electron), and Raman spectroscopy (Figure 6a and 6b). Diffraction captures the reciprocal lattice directly, while Raman is sensitive to vibrational modes of the crystal.
Raman spectroscopy is capable of distinguishing between different iron oxide compounds based on characteristic vibrational modes.67, 68 The peaks at 670 cm−1, 540 cm−1, and 310 cm−1, are considered diagnostic of magnetite. This is consistent with literature.67 The Raman spectra of nanoparticle synthesized from iron (III) oleate (Figure 6a) are characteristic of magnetite, with no indication of the presence of any other phases, even shortly after nucleation. Figure 6b shows Raman spectra from nanoparticles synthesized from FeOOH. The as-synthesized particles are magnetite. After oxidation at 100°C for 12 hours (see §2.1.5) the 670 cm−1 peak extends beyond 700 cm−1. Additionally, a broad second harmonic appears in the 1300–1400 cm−1 range. Both of these are considered diagnostic of maghemite, and consistent with literature.
Hematite, and many other iron oxide and oxyhydroxide phases are also readily identified from Raman spectra.67, 69 However, thermal and laser induced transformation of many of these phases is a concern.67, 70 Wüstite in particular is metastable at ambient conditions, and is challenging to characterize using Raman spectroscopy without transforming to magnetite or hematite. A distinct wüstite peak has been reported at approximately 595 cm−1 when observed at very low laser powers.67 However, many purported wüstite Raman spectra in literature appear to have been transformed to magnetite.68, 69
EELS is also used to compare as-synthesized SPIONs with nanoparticles annealed at 100°C under atmosphere for 12 hours to form maghemite. These samples were also characterized using Raman spectroscopy in Figure 6b. The iron L3/L2 ratio, here measured from second derivative of the EELS (Figure 7), is proportional to valence, with a larger ratio indicating a higher valence. These iron L edges correspond to transitions to the partially filled 3d shell, from the 2p shell, with spins of -½ and + ½, respectively. Population of the valence shell alters the probability for these transitions, with EELS fine structure depending on, for example, local bonding and coordination. The iron L3/L2 ratio is measured to be 4.54 for the as-synthesized nanoparticles and 5.63 for the annealed. Comparing to references, we estimate the valence of these samples is approximately +2.4 for the as-synthesized (+2.67 theoretical for magnetite), and +2.9 for the annealed sample (+3 theoretical for maghemite).52, 71 These references agree to each other within ~10%, despite Cavé, et al. [67] using a different method for determining peak intensity. The comparably small L3/L2 ratio for the as-synthesized sample may indicate presence of wüstite, which is not readily detectable with Raman spectroscopy. The annealed sample appears to be nearly fully transformed to maghemite.
Figure 7.

Electron energy loss spectra (EELS) from iron oxide nanoparticles synthesized from FeOOH before and after annealing at 100°C for 12 hours, showing the oxygen K-edge (onset ~532 eV) and iron-L edge (onset ~708 eV). The ratio of iron L3 to L2 core-shell transitions is proportional to iron valence, increasing as nanoparticles are annealed from magnetite to maghemite.
As described previously, in certain circumstances (i.e. the Fe(CO)5 protocol or synthesis of the nanoparticles larger than 22nm with FeOOH or iron oleate methods), wüstite (FeO) phase may be present. Wüstite is difficult to detect with Raman spectroscopy, as wüstite rapidly transforms to magnetite under laser irradiation. X-ray (or electron) diffraction experiments can readily identify the wüstite phase. When applied together, diffraction and Raman spectroscopy can be used to determine the phase of any unknown iron oxide. Additionally, iron valence can be calculated using EELS to confirm the diffraction and Raman results.
4. Conclusions
Iron oxide nanoparticles have been synthesized by the thermal decomposition of three different precursors, all sharing iron (III) oleate as an important reaction intermediate. By adjusting thermal parameters, and precursor concentration and composition we have demonstrated size control between approximately 2 nm and 30 nm. In all three procedures, the iron complexes with oleic acid to form iron (III) oleate. Due to the importance of the iron (III) oleate complex in all syntheses, it is the focus of the thermal characterizations. Breakdown of iron (III) oleate occurs above around 250°C. For iron (III) oleate in 1-octadecene, increasing the synthesis temperature beyond this with a constant ramp rate results in increasingly larger particles, up to around 10 nm. If this iron (III) oleate precursor is diluted with excess oleic acid, nucleation is delayed and growth is slowed. The excess oleic acid acts as a surfactant, coating particles and competing with iron and oxygen species for attachment. Particles grown in the presence of excess surfactant and given sufficient aging times are single crystalline and monodisperse. By increasing the oleic acid to iron oleate ratio from 5:1 up to 20:1 or more, particle size can be tuned, up to approximately 25 nm. A similar relationship between excess surfactant ratio and particle size has been demonstrated in the Fe(CO)5 and FeOOH thermal decompositions. We found that the Fe(CO)5 protocol is particularly suited for smaller (<10 nm) nanoparticles, while the FeOOH protocol is capable of producing monodisperse nanoparticles in the 10–25 nm range. By increasing the surfactant (oleic acid) concentration, particle size increases, however above a certain ratio (around 20:1 molar ratio for iron (III) oleate, 2.5:1 for Fe(CO)5, and 16.5:1 for FeOOH) the distribution broadens. Monodisperse particles are required for most applications, so this effectively places an upper limit of around 30 nm on the synthetic approaches described here. Care must be taken to ensure nanoparticles are not only the appropriate size, but also that phase and crystallinity are optimized for the desired properties. In our experience nanoparticles synthesized with the Fe(CO)5 protocol and larger nanoparticles (>22nm) synthesized with FeOOH and iron oleate methods, must be oxidized following synthesis to eliminate oxygen deficiencies and form single crystalline and pure magnetite or maghemite. Phase can be manipulated during synthesis by considering oxygen availability, or post synthesis by introducing an annealing or oxidation step.
Acknowledgments
This work was supported by NIH grants 1RO1EB013689-01/NIBIB, 1R41EB013520-01 and 1R42EB013520-01. Part of this work was conducted at the University of Washington NanoTech User Facility, a member of the NSF National Nanotechnology Infrastructure Network (NNIN). Research performed at Pacific Northwest National Laboratory (PNNL) was supported by the Chemical Imaging Initiative under Contract DE-AC05-76RL01830 operated for the Department of Energy by Battelle. A portion of this work was performed at EMSL, a national scientific user facility sponsored by the Department of Energy’s Office of Biological and Environmental Research and located at PNNL.
References
- 1.Krishnan KM. Biomedical Nanomagnetics: A Spin Through Possibilities in Imaging, Diagnostics, and Therapy. IEEE Trans. Magn. 2010;46:2523–2558. doi: 10.1109/TMAG.2010.2046907. [DOI] [PMC free article] [PubMed] [Google Scholar]
- 2.Weissleder R, et al. Superparamagnetic iron oxide: pharmacokinetics and toxicity. Am. J. Roentgenol. 1989;152:167–173. doi: 10.2214/ajr.152.1.167. [DOI] [PubMed] [Google Scholar]
- 3.Wang Y-XJ, Hussain SM, Krestin GP. Superparamagnetic iron oxide contrast agents: physicochemical characteristics and applications in MR imaging. Eur. Radiol. 2001;11:2319–2331. doi: 10.1007/s003300100908. [DOI] [PubMed] [Google Scholar]
- 4.Lu M, Cohen MH, Rieves D, Pazdur R. FDA report: Ferumoxytol for intravenous iron therapy in adult patients with chronic kidney disease. Am. J. Hematol. 2010 doi: 10.1002/ajh.21656. NA–NA. [DOI] [PubMed] [Google Scholar]
- 5.Reimer P, Balzer T. Ferucarbotran (Resovist): a new clinically approved RES-specific contrast agent for contrast-enhanced MRI of the liver: properties, clinical development, and applications. Eur. Radiol. 2003;13:1266–1276. doi: 10.1007/s00330-002-1721-7. [DOI] [PubMed] [Google Scholar]
- 6.Almeida JPM, Chen AL, Foster A, Drezek R. In vivo biodistribution of nanoparticles. Nanomed. 2011;6:815–835. doi: 10.2217/nnm.11.79. [DOI] [PubMed] [Google Scholar]
- 7.Ferguson RM, et al. Tailoring the magnetic and pharmacokinetic properties of iron oxide magnetic particle imaging tracers. Biomed. Tech. Eng. 2013;58 doi: 10.1515/bmt-2012-0058. [DOI] [PMC free article] [PubMed] [Google Scholar]
- 8.Khandhar AP, Ferguson RM, Arami H, Krishnan KM. Monodisperse magnetite nanoparticle tracers for in vivo magnetic particle imaging. Biomaterials. 2013;34:3837–3845. doi: 10.1016/j.biomaterials.2013.01.087. [DOI] [PMC free article] [PubMed] [Google Scholar]
- 9.Goodwill PW, et al. X-Space MPI: Magnetic Nanoparticles for Safe Medical Imaging. Adv. Mater. 2012;24:3870–3877. doi: 10.1002/adma.201200221. [DOI] [PubMed] [Google Scholar]
- 10.Katzberg RW, Haller C. Contrast-induced nephrotoxicity: Clinical landscape. Kidney Int. 2006;69:S3–S7. doi: 10.1038/sj.ki.5000366. [DOI] [PubMed] [Google Scholar]
- 11.Ix JH, et al. Association of chronic kidney disease with clinical outcomes after coronary revascularization: The arterial revascularization therapies study (ARTS) Am. Heart J. 2005;149:512–519. doi: 10.1016/j.ahj.2004.10.010. [DOI] [PubMed] [Google Scholar]
- 12.Bettmann MA. Frequently Asked Questions: Iodinated Contrast Agents1. RadioGraphics. 2004;24:S3–S10. doi: 10.1148/rg.24si045519. [DOI] [PubMed] [Google Scholar]
- 13.Wang Y-XJ. Superparamagnetic iron oxide based MRI contrast agents: Current status of clinical application. Quant. Imaging Med. Surg. 2011;1:35–40. doi: 10.3978/j.issn.2223-4292.2011.08.03. [DOI] [PMC free article] [PubMed] [Google Scholar]
- 14.Grootendorst DJ, et al. Evaluation of superparamagnetic iron oxide nanoparticles (Endorem®) as a photoacoustic contrast agent for intra-operative nodal staging. Contrast Media Mol. Imaging. 2013;8:83–91. doi: 10.1002/cmmi.1498. [DOI] [PubMed] [Google Scholar]
- 15.Gonzales M, Krishnan KM. Synthesis of magnetoliposomes with monodisperse iron oxide nanocrystal cores for hyperthermia. J. Magn. Magn. Mater. 2005;293:265–270. [Google Scholar]
- 16.Khandhar AP, Ferguson RM, Krishnan KM. Monodispersed magnetite nanoparticles optimized for magnetic fluid hyperthermia: Implications in biological systems. J. Appl. Phys. 2011;109:07B310. doi: 10.1063/1.3556948. [DOI] [PMC free article] [PubMed] [Google Scholar]
- 17.Gleich B, Weizenecker J. Tomographic imaging using the nonlinear response of magnetic particles. Nature. 2005;435:1214–1217. doi: 10.1038/nature03808. [DOI] [PubMed] [Google Scholar]
- 18.Ferguson R, et al. Magnetic Particle Imaging with Tailored Iron Oxide Nanoparticle Tracers. IEEE Trans. Med. Imaging. 2014:1–1. doi: 10.1109/TMI.2014.2375065. [DOI] [PMC free article] [PubMed] [Google Scholar]
- 19.Ferguson RM, Minard KR, Khandhar AP, Krishnan KM. Optimizing magnetite nanoparticles for mass sensitivity in magnetic particle imaging. Med. Phys. 2011;38:1619. doi: 10.1118/1.3554646. [DOI] [PMC free article] [PubMed] [Google Scholar]
- 20.Ferguson RM, Khandhar AP, Krishnan KM. Tracer design for magnetic particle imaging (invited) J. Appl. Phys. 2012;111:07B318. doi: 10.1063/1.3676053. [DOI] [PMC free article] [PubMed] [Google Scholar]
- 21.Arami H, Ferguson RM, Khandhar AP, Krishnan KM. Size-dependent ferrohydrodynamic relaxometry of magnetic particle imaging tracers in different environments. Med. Phys. 2013;40:071904. doi: 10.1118/1.4810962. [DOI] [PMC free article] [PubMed] [Google Scholar]
- 22.Arami H, et al. In vivo multimodal magnetic particle imaging (MPI) with tailored magneto/optical contrast agents. Biomaterials. 2015;52:251–261. doi: 10.1016/j.biomaterials.2015.02.040. [DOI] [PMC free article] [PubMed] [Google Scholar]
- 23.Khandhar AP, Ferguson RM, Simon JA, Krishnan KM. Tailored magnetic nanoparticles for optimizing magnetic fluid hyperthermia. J. Biomed. Mater. Res. A. 2012;100A:728–737. doi: 10.1002/jbm.a.34011. [DOI] [PMC free article] [PubMed] [Google Scholar]
- 24.Weizenecker J, Gleich B, Rahmer J, Borgert J. Micro-magnetic simulation study on the magnetic particle imaging performance of anisotropic mono-domain particles. Phys. Med. Biol. 2012;57:7317–7327. doi: 10.1088/0031-9155/57/22/7317. [DOI] [PubMed] [Google Scholar]
- 25.Kim BH, et al. Large-Scale Synthesis of Uniform and Extremely Small-Sized Iron Oxide Nanoparticles for High-Resolution T1 Magnetic Resonance Imaging Contrast Agents. J. Am. Chem. Soc. 2011;133:12624–12631. doi: 10.1021/ja203340u. [DOI] [PubMed] [Google Scholar]
- 26.Tong S, Hou S, Zheng Z, Zhou J, Bao G. Coating Optimization of Superparamagnetic Iron Oxide Nanoparticles for High T 2 Relaxivity. Nano Lett. 2010;10:4607–4613. doi: 10.1021/nl102623x. [DOI] [PMC free article] [PubMed] [Google Scholar]
- 27.LaMer VK, Dinegar RH. Theory, production and mechanism of formation of monodispersed hydrosols. J. Am. Chem. Soc. 1950;72:4847–4854. [Google Scholar]
- 28.Kahlweit M. Ostwald ripening of precipitates. Adv. Colloid Interface Sci. 1975;5:1–35. [Google Scholar]
- 29.Wen T, Brush LN, Krishnan KM. A generalized diffusion model for growth of nanoparticles synthesized by colloidal methods. J. Colloid Interface Sci. 2014;419:79–85. doi: 10.1016/j.jcis.2013.12.018. [DOI] [PubMed] [Google Scholar]
- 30.Sugimoto T. Peparation of monodispersed colloidal particles. Adv. Colloid Interface Sci. 1987;28:65–108. [Google Scholar]
- 31.Turkevich J, Stevenson PC, Hillier J. A study of the nucleation and growth processes in the synthesis of colloidal gold. Discuss. Faraday Soc. 1951;11:55–75. [Google Scholar]
- 32.Perez H, Pradeau J-P, Albouy P-A, Perez-Omil J. Synthesis and Characterization of Functionalized Platinum Nanoparticles. Chem. Mater. 1999;11:3460–3463. [Google Scholar]
- 33.Puntes VF, Krishnan KM, Alivisatos AP. Colloidal nanocrystal shape and size control: the case of cobalt. Science. 2001;291:2115–2117. doi: 10.1126/science.1057553. [DOI] [PubMed] [Google Scholar]
- 34.Ma D, et al. Synthesis of bismuth nanoparticles and self-assembled nanobelts by a simple aqueous route in basic solution. Colloids Surf. Physicochem. Eng. Asp. 2012;395:276–283. [Google Scholar]
- 35.Wu ZG, Munoz M, Montero O. The synthesis of nickel nanoparticles by hydrazine reduction. Adv. Powder Technol. 2010;21:165–168. [Google Scholar]
- 36.Patharkar RG, Nandanwar SU, Chakraborty M. Synthesis of Colloidal Ruthenium Nanocatalyst by Chemical Reduction Method. J. Chem. 2013;2013:1–5. [Google Scholar]
- 37.Ge J, Hu Y, Biasini M, Beyermann WP, Yin Y. Superparamagnetic Magnetite Colloidal Nanocrystal Clusters. Angew. Chem. Int. Ed. 2007;46:4342–4345. doi: 10.1002/anie.200700197. [DOI] [PubMed] [Google Scholar]
- 38.Baumgartner J, et al. Nucleation and growth of magnetite from solution. Nat. Mater. 2013;12:310–314. doi: 10.1038/nmat3558. [DOI] [PubMed] [Google Scholar]
- 39.Hyeon T, Lee SS, Park J, Chung Y, Na HB. Synthesis of Highly Crystalline and Monodisperse Maghemite Nanocrystallites without a Size-Selection Process. J. Am. Chem. Soc. 2001;123:12798–12801. doi: 10.1021/ja016812s. [DOI] [PubMed] [Google Scholar]
- 40.Park J, et al. Ultra-large-scale syntheses of monodisperse nanocrystals. Nat. Mater. 2004;3:891–895. doi: 10.1038/nmat1251. [DOI] [PubMed] [Google Scholar]
- 41.Sun S, et al. Monodisperse MFe2O4 (M = Fe, Co, Mn) Nanoparticles. J. Am. Chem. Soc. 2004;126:273–279. doi: 10.1021/ja0380852. [DOI] [PubMed] [Google Scholar]
- 42.Sun S, Zeng H. Size-Controlled Synthesis of Magnetite Nanoparticles. J. Am. Chem. Soc. 2002;124:8204–8205. doi: 10.1021/ja026501x. [DOI] [PubMed] [Google Scholar]
- 43.Yu WW, Falkner JC, Yavuz CT, Colvin VL. Synthesis of monodisperse iron oxide nanocrystals by thermal decomposition of iron carboxylate salts. Chem. Commun. 2004:2306. doi: 10.1039/b409601k. [DOI] [PubMed] [Google Scholar]
- 44.Zhao S, Yang C, Yan J, Wang J. A novel solvethermal method for the preparation of magnetic monodisperse Fe3O4 nanoparticles II: High-surface-activity ferrihydrite used as precursor. Mater. Res. Bull. 2013;48:4385–4389. [Google Scholar]
- 45.Vallina B, Rodriguez-Blanco JD, Brown AP, Benning LG, Blanco JA. Enhanced magnetic coercivity of α-Fe2O3 obtained from carbonated 2-line ferrihydrite. J. Nanoparticle Res. 2014;16 [Google Scholar]
- 46.Bronstein LM, et al. Influence of Iron Oleate Complex Structure on Iron Oxide Nanoparticle Formation. Chem. Mater. 2007;19:3624–3632. [Google Scholar]
- 47.Pichon BP, et al. Microstructural and Magnetic Investigations of Wu-stite-Spinel Core-Shell Cubic-Shaped Nanoparticles. Chem. Mater. 2011;23:2886–2900. [Google Scholar]
- 48.Gonzales M, Krishnan KM. Phase transfer of highly monodisperse iron oxide nanocrystals with Pluronic F127 for biomedical applications. J. Magn. Magn. Mater. 2007;311:59–62. [Google Scholar]
- 49.Khandhar AP, Ferguson RM, Arami H, Kemp SJ, Krishnan KM. Tuning surface coatings of optimized magnetite nanoparticle tracers for in vivo Magnetic Particle Imaging. IEEE Trans. Magn. doi: 10.1109/TMAG.2014.2321096. in press. [DOI] [PMC free article] [PubMed] [Google Scholar]
- 50.Arami H, Krishnan KM. Highly Stable Amine Functionalized Iron Oxide Nanoparticles Designed for Magnetic Particle Imaging (MPI) IEEE Trans. Magn. 2013;49:3500–3503. doi: 10.1109/TMAG.2013.2245110. [DOI] [PMC free article] [PubMed] [Google Scholar]
- 51.Palchoudhury S, et al. Synthesis and Growth Mechanism of Iron Oxide Nanowhiskers. Nano Lett. 2011;11:1141–1146. doi: 10.1021/nl200136j. [DOI] [PubMed] [Google Scholar]
- 52.Klie RF, Browning ND. Characterization of oxygen ordering in (La, Sr)FeO3 - δ by atomic resolution Z-contrast imaging and electron energy-loss spectroscopy. J. Electron Microsc. (Tokyo) 2002;51:S59–S66. [Google Scholar]
- 53.Botton GA, Appel CC, Horsewell A, Stobbs WM. Quantification of the EELS near-edge structures to study Mn doping in oxides. J. Microsc. 1995;180:211–216. [Google Scholar]
- 54.Ferguson RM, Khandhar AP, Krishnan KM. Tracer design for magnetic particle imaging. J. Appl. Phys. 2012;111:07B318. doi: 10.1063/1.3676053. [DOI] [PMC free article] [PubMed] [Google Scholar]
- 55.Chantrell RW, Popplewell J, Charles SW. Measurements of Particle Size Distribution Parameters in Ferrofluids. IEEE Trans. Mag. MAG-14. 1978:975–977. [Google Scholar]
- 56.Ferguson RM, Minard KR, Krishnan KM. Optimization of nanoparticle core size for magnetic particle imaging. J. Magn. Magn. Mater. 2009;321:1548–1551. doi: 10.1016/j.jmmm.2009.02.083. [DOI] [PMC free article] [PubMed] [Google Scholar]
- 57.Gonzales-Weimuller M, Zeisberger M, Krishnan KM. Size-dependant heating rates of iron oxide nanoparticles for magnetic fluid hyperthermia. J. Magn. Magn. Mater. 2009;321:1947–1950. doi: 10.1016/j.jmmm.2008.12.017. [DOI] [PMC free article] [PubMed] [Google Scholar]
- 58.Ludwig F, et al. Dynamic Magnetic Properties of Optimized Magnetic Nanoparticles for Magnetic Particle Imaging. IEEE Trans. Magn. 2014;50:1–4. [Google Scholar]
- 59.Ludwig F, et al. Self-consistent magnetic properties of magnetite tracers optimized for magnetic particle imaging measured by ac susceptometry, magnetorelaxometry and magnetic particle spectroscopy. J. Magn. Magn. Mater. 2014;360:169–173. doi: 10.1016/j.jmmm.2014.02.020. [DOI] [PMC free article] [PubMed] [Google Scholar]
- 60.López-Cruz A, López GE. Formation of an iron oxide bond in iron carboxylate complexes: a density functional theory study. Mol. Phys. 2009;107:1799–1804. [Google Scholar]
- 61.Wulff G. Z. Kryst. Mineral. 1901;34:449–530. [Google Scholar]
- 62.Hansen PL. Atom-Resolved Imaging of Dynamic Shape Changes in Supported Copper Nanocrystals. Science. 2002;295:2053–2055. doi: 10.1126/science.1069325. [DOI] [PubMed] [Google Scholar]
- 63.Ringe E, Van Duyne RP, Marks LD. Wulff Construction for Alloy Nanoparticles. Nano Lett. 2011;11:3399–3403. doi: 10.1021/nl2018146. [DOI] [PubMed] [Google Scholar]
- 64.Hai HT, Kura H, Takahashi M, Ogawa T. Facile synthesis of Fe3O4 nanoparticles by reduction phase transformation from gamma-Fe2O3 nanoparticles in organic solvent. J. Colloid Interface Sci. 2010;341:194–199. doi: 10.1016/j.jcis.2009.09.041. [DOI] [PubMed] [Google Scholar]
- 65.Hai HT, et al. Size control and characterization of wustite (core)/spinel (shell) nanocubes obtained by decomposition of iron oleate complex. J. Colloid Interface Sci. 2010;346:37–42. doi: 10.1016/j.jcis.2010.02.025. [DOI] [PubMed] [Google Scholar]
- 66.Smith TW, Wychick D. Colloidal iron dispersions prepared via the polymer-catalyzed decomposition of iron pentacarbonyl. J. Phys. Chem. 1980;84:1621–1629. [Google Scholar]
- 67.Hanesch M. Raman spectroscopy of iron oxides and (oxy)hydroxides at low laser power and possible applications in environmental magnetic studies. Geophys. J. Int. 2009;177:941–948. [Google Scholar]
- 68.Thibeau RJ, Brown CW, Heidersbach RH. Raman spectra of possible corrosion products of iron. Appl. Spectrosc. 1978;32:532–535. [Google Scholar]
- 69.De Faria DLA, Venâncio Silva S, de Oliveira MT. Raman microspectroscopy of some iron oxides and oxyhydroxides. J. Raman Spectrosc. 1997;28:873–878. [Google Scholar]
- 70.Shebanova ON, Lazor P. Raman study of magnetite (Fe3O4): laser-induced thermal effects and oxidation. J. Raman Spectrosc. 2003;34:845–852. [Google Scholar]
- 71.Cavé L, Al T, Loomer D, Cogswell S, Weaver L. A STEM/EELS method for mapping iron valence ratios in oxide minerals. Micron. 2006;37:301–309. doi: 10.1016/j.micron.2005.10.006. [DOI] [PubMed] [Google Scholar]