

Abstract
A mounting body of evidence suggests that the life course sequence that once defined contemporary U.S. women’s lives is changing as an increasing number of women now complete their education after the transition to motherhood. Despite such evidence, we know little about this changing pattern of life course events for many U.S. women. The aim of this study, therefore, is to produce population-based estimates that describe the prevalence of mothers’ school reentry and secondary and college degree attainment, the timing of women’s post-childbearing education vis-à-vis their transition into motherhood, and the characteristics of mothers who pursue additional schooling. To do so, the study draws on data from a nationally representative cohort of U.S. women participating in the National Longitudinal Survey of Youth (n=4,925) and descriptive and event history techniques. Findings suggest that a substantial proportion of mothers (17%) completed additional education after the transition to motherhood, especially mothers who had the lowest levels of education at their time of first birth (high school dropouts) (43%). These mothers, who overwhelmingly earned high school degrees/GEDs, were most likely to do so within five years of giving birth, while mothers pursuing higher levels were more likely to do so when children were older. Mothers who pursued schooling after the transition to motherhood were remarkably more disadvantaged than women who followed the traditional sequencing of life course events. Compared to women who had the same education upon being mothers, they were also younger, more often poor, and had greater job instability but higher cognitive test scores.
Keywords: life course, maternal education, fertility timing, motherhood
Women’s life course trajectories have historically been characterized by a particular sequence of demographic events in which the completion of high school and college preceded women’s transition into the labor market, a marital (or contemporarily, cohabiting) union, and motherhood (Marini 1984a; Skirbekk, Kohler and Prskawetz 2004). Yet there is evidence which suggests that this typical sequence of demographic events has become less normative, as more women are completing secondary and college schooling (among those that pursue it) at later stages of the life course, particularly after having children (Astone et al. 2000; Bradburn, Moen and McClain 1995; Milesi 2010). Despite evidence of this change in the sequencing of two key life course events for many U.S. women, we still do not know how common it is for women with children to return to school and what type of primary/college degrees they typically pursue, when women generally complete their degrees vis-à-vis the transition to motherhood, and how their characteristics compare to women who earn the same level of schooling following the traditional sequence of life course events.
The aim of this study is to provide such insights. This knowledge will not only shed light on how the life course patterns of contemporary U.S. women are changing. It also has several implications for future research investigating the impact of these changes on the wellbeing of women and their children and social policies designed to support women who pursue additional education after making the transition to motherhood. For example, most studies have examined the impact of mothers’ additional education on young children (e.g., Harding 2015, Magnuson et al. 2009), with only one including children (ages 6–12) during middle childhood (Magnuson 2007). As such, if the results of this study reveal that a majority of women pursued additional education well after the transition to motherhood, the need for such research would be clearly identified. In terms of social policy, it would highlight the importance of programs that address the needs of mothers with older children going to school, not just mothers with younger children (e.g. by providing after-school programs, not just traditional forms of on-site child care, which is the current focus) (Women Employed 2011). To provide these contributions to knowledge, future research, and policy, this study draws on the life course framework, nationally representative prospective data from a cohort of women that participated in the National Longitudinal Survey of Youth-1979 (NLSY79), and descriptive and dynamic modeling approaches (e.g., survival models, event history models).
Theoretical Perspectives on the Sequencing of Schooling and Motherhood
A prevailing theoretical paradigm for studying the arc of people’s lives is the life course perspective (Elder 1998). According to this perspective, this arc (i.e., the life course) is shaped by the sequencing of social roles and events that people experience over time. Thus, the theory underscores how changes in the traditional sequencing of key life course events of U.S. women represents an important shift that is likely to result in changes in the futures of many families. For example, there is a small but emerging body of evidence that when mothers without college degrees increase their education, their children’s academic skills improve (Harding 2015; Magnuson 2007; Magnuson et al. 2009). As such, changes in mothers’ trajectories through the secondary and college school systems have the potential to alter the mobility of the next generation of children. The theory also draws attention to the contextual factors surrounding this change in women’s life course sequence. Thus, it emphasizes the cultural (e.g., changing gender roles), demographic (e.g., rising rates of women’s labor force participation, increased share of families headed by unmarried parents), and economic (e.g., rising returns to educational attainment, especially college; diminishing returns to lower levels of education) changes occurring during the period when the mothers in this study were raising their families (Cancian and Reed, 2009; Haveren 1991). As such, it also highlights how shifting circumstances of the time increased the potential for changes in the life courses sequences of women (Moen and Wethington 1992).
Unfortunately, our understanding of the changing life course patterns of mother’s continuing secondary and college education remains limited by the primacy of other theoretical traditions that generally assume that education precedes fertility and is completed early in the life course. For example, much of the work on individual or group differences in educational attainment is organized by either the decision making model (Lucas 2010) or status attainment model (Sewell, Hauser and Portes 1969). Both frameworks implicitly assume that the pursuit of education stops once one leaves school. In a related literature, scholars argue that motherhood deters additional educational attainment, possibly because parent and student are incompatible statuses or because motherhood dampens one’s academic aspirations for the future (Gerson 1985; Raley, Kim and Daniels 2012; Strange 2011). Among studies that do consider the connections between women’s life course events, the emphasis has been on motherhood’s effects on women’s future work trajectories (Brewster and Rindfuss 2000; Desai and Waite 1991), how women’s education leads them to delay their fertility (Skirbekk, Kohler and Prskawetz 2004), or how some women select into motherhood (particularly early motherhood) as an alternative to academic attainment (Edin and Kefalas 2005; Kearney and Levine 2014).
Importantly, although the prevailing theoretical and empirical approaches to studying the connections between women’s education and fertility generally overlook the potential for women’s post-childbearing education, they do not preclude them. For example, there is evidence that while motherhood may dampen some women’s academic aspirations for the future (Raley et al. 2012), it often does not extinguish them (Edin and Kefalas 2005). Although we still do not know how common it is for women to increase their education after having children, there is also mounting evidence suggesting that many women now do so.
Evidence Pointing to Changes in the Life Course Sequencing of Women’s Schooling
The first indicator that mothers are increasingly pursing additional education comes from education research on the college going population and “off-time” enrollment. This literature suggests that a growing proportion of students are pursuing higher education “out of sequence,” or after the occurrence of some other life course event typically thought to precede the completion of education, such as full-time work, marriage, or parenthood (Bozick and DeLuca 2005; Jacobs and King 2002). In fact, one recent study found that enrollment (or reenrollment) in college following a period of delay has become more common than the normative path through the education system in which students pursue school in a continuous fashion and complete it when they are young (Milesi 2010).
Research on changes in the characteristics of the college student population also point to a change in the sequencing of schooling and motherhood for many women. For example, a recent report published by the National Center for Education Statistics based on data from the Beginning Postsecondary Students Longitudinal Survey found that 19% of first time college students (including those attending 2- and 4-year schools) enrolled in 2003–2004 had dependent children, whereas 15 years earlier, this figure was 14% (NCES 2011). Among all college students (i.e., not just first time students), Perna and colleagues (2010) estimated using data from the National Postsecondary Student Aid Study that the total percentage of college students with children in 2003–2004 was 25%, with 71% of them being female. More recent estimates based on the same survey administered in 2011 revealed that the percentage of college students with children had slightly increased to over 26%, with a similarly large percentage of college students with children being female (71%; Institute for Women’s Policy Research).
As for research pointing to an upward trend in mothers’ pursuit of high school or general equivalency degrees (GEDs), one older study found an upward trend in high school degree completion among low-income mothers (Brandon 1993) and there are a handful of studies which found that a large percentage of teen mothers that dropped out school returned to complete their degrees (Furstenberg et al. 1987; Rich and Kim 1999). Taken together, these studies provide compelling evidence that there have been changes in the timing of the completion of women’s high school and college level educational attainment. What scholars need now are estimates of how common it is for women with children to increase their schooling and earn different degrees, insight on the timing of their post-childbearing education vis-à-vis the transition to motherhood, and knowledge of the characteristics of those who pursue additional schooling.
State of the Literature on Women’s Post-Childbearing Education
Given assumptions about the sequencing of schooling and motherhood and established lines of inquiry, there is only a very small body of work describing women’s post-childbearing schooling, and the majority of this work focused on young, largely economically disadvantaged women; particularly teen parents (Hofferth, Reid, and Mott 2001; Furstenberg, et al. 1987; Mott and Marsiglio 1985; Rich and Kim 1999; Upchurch and McCarthy 1990). For example, Rich and Kim (1999) examined the post-childbearing patterns and characteristics of teen mothers using data from the NLSY79. They found that 15 years after giving birth, 40% of teenage mothers who had dropped out of school increased their education and about 20% of who had completed a high school degree or GED, increased their education. They also explored demographic differences between teenage mothers who increased their education and those who did not, and found few, although they only examined a limited set of factors. In Furstenberg and colleague’s study of about 300 urban, predominantly minority, teen mothers, (1987), they found similar patterns in mothers’ post-childbearing education. Ten years after giving birth, 67% of teen mothers who had dropped out of high school had obtained a high school degree; 15 years later, 30% had earned some college education and 5% had a college degree. They also found that rates of additional education were lower for the youngest mothers.
Other noteworthy studies on the topic (e.g., Hofferth, Reid, and Mott 2001; Mott and Marsiglio 1985) were limited to a focus on teen mothers’ attainment of a high school degree.
Two studies have investigated the return to school of women who were not exclusively teen mothers. One is a study by Bradburn, Moen, and Dempster-McClain (1995), which drew on a local sample of women born in the 1920s, well before many of the changes that were occurring around the time that the NLSY79 women were raising their children had begun. The other is a study by MacGregor (2010), which drew on a urban, largely disadvantaged sample mothers (albeit, the sample likely to pursue secondary school or college after having a child) in the Fragile Families and Child Wellbeing Study (FFCW) that, at the time of the study, had only followed women five years post-partum. Because Perna and colleagues (2010) find that more than half of college students with children had children over age 5, this study likely overlooked a substantial proportion of mothers who would later return to school.
In spite of the limitations of these two previous studies, they provide a basis for setting forth some expectations for the current one. For example, Bradburn (1995) found that the mean age of return was age 44. In a more contemporary sample where more mothers are unmarried and participating in the labor market (Bureau of Labor Statistics 2014; Ventura 2009), I expect women to return to school at younger ages to increase their opportunity for mobility and better support their family. Bradburn also found that women with families that were well-off financially were more likely to return to school than women reporting average levels of finances, which the authors argued reflected the economic costs of returning to school. In the contemporary economy, I expect this association would be reversed given the growing costs of not returning to school and diminishing financial returns to lower levels of education (Autor 2014). For similar reasons, (and in contrast to the Bradburn’s findings), I expect that mothers without any college schooling will be more likely to return to school than women with some college schooling, although consistent with MacGregor (2010) and research on adults learners more generally (e.g., NCES 2011), I expect a larger share of mothers who return to school to pursue college schooling to pursue 2-year over 4-year degrees. Finally, based on MacGregor’s findings, I anticipate that mothers who are Black (vs another race/ethnic group), unmarried, and from disadvantaged backgrounds will be more likely to return to school, but that mothers’ with higher cognitive abilities will be more likely to select back into the school system to increase their education.
Summary of Study
In sum, although the life course patterns that once defined contemporary women’s lives are shifting, we know little about the contours of this shift. The extant studies that have examined questions related to women’s post-childbearing education have only provided a patchwork of statistics which were derived from non-representative samples of women with children, and the general characteristics of mothers who return to school (beyond a limited set of demographic factors like race) and the timing of these returns remain unknown. Thus, taking advantage of the breadth of the NLSY79 data, this study provides, for the first time, contemporary information on each of these phenomena in a representative sample. Such descriptive information is vital to pursuing more hypothesis driven research on the ways in which mothers’ pursuit of additional education affects families and public policies that aim to increase mothers’ human capital.
Methods
Data and Sample
The NLSY79 is a nationally representative cohort study of young Americans originally designed to capture their life course experiences. It included 6,283 women between the ages 14 to 22 when data collection began in 1979. Data collection proceeded annually through 1994, then switched to a biennial format. Although the NLSY79 is a less contemporary data source, it captures the experiences of mothers during the 1980s and 90s—a unique period characterized by dramatic changes in women’s labor force participation and family formation. Thus, it is an important period when the life course trajectories that characterized women’s lives in earlier decades were changing. The NLSY79 is also the only available source of nationally representative data that prospectively captures women’s nearly complete education and fertility histories, thereby reducing the problems of left and right censoring or bias in the “risk pool.” Additionally, it includes rich background data on mothers (collected in most cases prior to having children), which allows me to present a portrait of factors that select women back into school compared to women who had similar starting educations at the time they became mothers but did not return to school, and allows me to capture an array of time-varying factors such as women’s marital status, employment situation, income, that may correlate with mothers’ fertility timing, on one hand, and additional degree receipt on the other.
For the analyses presented here, the sample is restricted to the 4,925 women who had children. This sample includes some women (18% of the sample) who had become mothers by the start of the first wave of data collection, for whom information on post-fertility education is unknown. These women were retained to avoid biasing the sample by explicitly excluding young mothers. Because information on their additional education was not missing completely at random (i.e., the missing mechanism was known, and was therefore considered missing at random), multiple imputation techniques could be and were applied (Allison 2001). To maintain the sample’s representativeness, I used the custom weighting program developed by Bureau of Labor Statistics (BLS) staff to generate a weight that generalizes my sample to a population of mothers. Additional exclusions were made using Stata’s subpop to ensure correct estimates of standard errors (Cochran 1977), including: 903 women participating in military and poor white oversamples, which were dropped fairly early in the study (1984 and 1990 respectively), leaving large amounts of missing data, and in some analyses (explained below), subsets of women based on their education at the time of their first birth. In some analyses, the final sample is also represented in post-childbearing women-years (years since first birth), right censored at 18.
Maternal Education Histories
I combine various pieces of information on education with data on the month and year of women’s first birth to create several education history measures. This information includes: highest grade (through grade 12) or years of schooling (13 and up) completed (reported each survey wave); whether the mother received a high school degree or GED and date when it was received (reported every survey wave); highest degree ever received (1988–2010); month and year the highest degree was received (1988–2010); if a college degree was received and what type (1979–1984); whether a degree was received since the last interview (1980–1984); and whether the woman was currently enrolled in school (all survey waves). When pieced together, this data provides complete coverage of women’s education histories, with a few exceptions. If a woman earned a college degree after the 1986 interview but attritted by 1988, I cannot account for that degree change. Also, for women who earned college degrees prior to 1988, I can capture the survey wave the degree was earned, but do not know the month. In such cases, month is coded as May if the degree is a college diploma (when such degrees are typically conferred) and June (likewise) if it is a high school degree. This assignment has implications for only a small number of cases in which the birth occurred the same year as the degree was earned because I do not know for certain whether the degree came before or after the birth (8%). In cases where education was reported inconsistently (e.g., mother reported 12 years, then 10 years, then 12 years), I recoded the outlying year (10) with the modal report (12). Finally, I do not know if mothers reenrolled if enrollment did not occur during a survey year.
Combining this information, I created several time-invariant measures. The first is a measure of mothers’ highest degree at the time of first child’s birth, dummy coded based on four different categories: less than high school, high school diploma or GED, Associate’s degree, or Bachelor’s degree. The second was an indicator of whether the mother had exited the school system but returned to earn some post-childbearing education (0 = no, 1 = yes). The third is a measure of the type of additional education she earned. Categories were: receipt of a high school diploma or GED, an Associate’s degree or at least two years of college, or a Bachelor’s degree. Note that these measures are not dummy coded. For example, a mother could earn a post-childbearing high school degree and Associate’s degree. Fourth, using the same four categories, I created a measure of her attainment when her oldest child is age 18. Finally, I created a measure for whether the mother ever reenrolled in school, regardless of whether she went on to earn a degree, based on maternal reports of whether she was enrolled in school as of May 1 that survey year.
In addition, I created three time-varying indicators of additional post-childbearing degree. The first captured a post-childbearing high school diploma or GED (0=no degree, 1= degree earned). The second captured a post-childbearing Associate’s degree or two years of college. The third captured a post-childbearing Bachelor’s degree. For these variables, the time metric was not survey year, but the number of years since becoming a mother. For example, a woman who first gave birth in 1990 and earned a Bachelor’s degree in 1994 would have a value of “1” on the time-varying measure of post-childbearing Bachelor’s degree for post-childbearing year 4. All years after the observation are censored. Using the same coding scheme, I also created a time-varying measure for whether the mother reenrolled in school that year (0 = no, 1 = yes). Lastly, I created a time-varying measure of highest degree at each post-childbearing woman year, dummy coded as less than high school, high school diploma or GED, Associate’s degree, or Bachelor’s degree.
In creating these measures, I counted at least two years of college as a post-childbearing education to allow women who may have earned some type of other credential, especially a vocational degree—which was not an option category for questions about highest college degree (1988–2010) and coded as “Other” in earlier questions about “type of college” degree (1979–1984)—to be counted. I also do not consider education beyond a Bachelor’s degree. I make this distinction because in many cases, graduate degrees (e.g., Master’s in Education or Business) have conventionally been earned at a later stage of the life course, particularly after accruing work experience and at older ages.
Time-Varying Characteristics
To provide a sense of mothers economic and social circumstances and the array of resources that may help or limit women’s reentry into school and degree attainment, I included measures on various factors that vary over time, including: mother’s occupational sector, dummy coded based on U.S. Census occupational codes for (1) professional or managerial, (2) sales, technical, or administrative, (3) service occupations, (4) all others; total family income earned the prior year; mother reports of family wealth; whether the mother was currently employed (0 = no, 1 = yes); her marital status (dummy coded married, never married, divorced/widowed); number of children in the home (continuous); number of weeks mother spent out of the labor market in the last year (continuous), labor force instability (proxy measure based on a ratio of the number of jobs the mother had since age 18 by her number of adult years); and whether she was poor (indicated by reports of income below the federal poverty threshold, or in cases where this information was missing, if she received TANF, AFDC, or food stamps). I also accounted for the region (dummy coded North East, Midwest, South, West Coast). These variables were coded using the same woman-year (vs. survey year) strategy described above.
Time-Invariant Variables
Using these time-varying measures, I created two time-invariant variables which correspond to 1) the year the woman became a mother and 2) year she earned a post-childbearing degree. I also include time-invariant measures of the mothers’ background. These include her race (dummy coded White, Black, and Hispanic), nativity (foreign born=1), whether she lived with a single parent growing up, whether her family ever received welfare or public assistance (e.g., food stamps, ADFC), whether either of her parents were foreign born, whether she grew up in an urban area, the proportion of her school that was poor, the number of siblings she grew up with (continuous), the education of her mother (dummy coded less than high school, high school, some college, Bachelor’s degree) and father (coded similarly), and reports of total wealth (financial assets and home ownership). These factors represent the constellation of sociodemographic factors related to mothers’ family of origin and thus, opportunity for pursuing education via traditional versus less conventional paths, such as after the birth of a child.
Lastly, I included several time-invariant variables assessed when women were young that are typical indicators of selection and may positively correlate with their likelihood of returning to school after childbearing (MacGregor 2010). These include mothers’ educational expectations (assessed between ages 16 and 21 and dummy coded less than high school, high school, some college, and 4-year degree), mother’s scores on the Rosenberg Self-Esteem Scale (Rosenberg 1965), and mothers’ cognitive skills based on the Armed Forces Qualification Test (AFQT). I also include an indicator for negative selection and delinquency by using self-reports for if she drank alcohol before age 18 (1 = yes).
Analysis Plan
The analysis has three parts. The first is a descriptive study based on a series of bivariate associations. Specifically, cross-tabulations of women’s education when they became mothers with mothers’ final levels of education provide a sense of how women’s education changed after having children. Comparisons of the background characteristics of women who earned a post-childbearing degree to women who had the same level of education at the time of first birth but did not earn a post-childbearing degree provide a picture of the characteristics that select some women back into school. Comparisons among women who increased their education after having children with women with the same highest degree who followed conventional paths through the education system reveal differences in the characteristics of women pursuing these two different life course sequences. Finally, descriptive estimates for the subsample of mothers that earned post-childbearing education which differentiate among women who earned different degrees convey a sense of mothers’ life circumstances (e.g., marital status) around the time they did so.
The second part of the study focuses only on mothers that returned to school (n=848). Its aim is to provide a dynamic picture of how mothers’ likelihood of returning to school/earning a degree changes as women’s time since becoming a mother increases. I do this two ways. First, I present four histograms, where year since becoming a mother is the x-axis. Separate graphs are presented for any reenrollment (capturing women in school who may or may not eventually earn a degree) and the three categories of post-childbearing degree attainment. Second, graphs of Kaplan-Meier failure estimates capture the proportion of mothers at each year since the first birth that had returned to school (Graph A) or, among those at risk (e.g., those with no high school degree at birth are the only ones at risk of earning a high school degree post-childbearing) that earned a particular degree (Graphs B-D) (Singer & Willet, 2003). Graphs for reenrollment, Associate’s degree/some college, and Bachelor’s degree are stratified by degree at first birth and log rank tests assess whether there is a significant difference in failure rates by starting education. These graphs provide a cumulative view of time-related patterns in mothers’ additional education.
The third part of the study is a multivariate analysis where I use discrete event history methods and logistic regression to predict the odds of returning to school (Model 1) or earning a specific degree (Models 2–4). Models 2–4 were only estimated among women at risk of earning the degree being predicted (as above). Discrete event history models (versus parametric models) are appropriate here because time was measured in discrete intervals (years since first birth), not continuous units (Allison 1982). Event history models, more generally, are based on pooled data that allow me to capture a process that occurs at varying points of time for different women and incorporate time-invariant and time-varying predictors that correspond to the time in which the event occurred. Time, in this case, reflects years since becoming a mother, right censored at 18 years post-fertility (when the first child becomes an adult and presumably leaves the home) to distinguish between periods when women are caring for children and when they are not, and the relevance of a degree obtained post-childbearing to children’s or women’s lives is different. Of course, women are caregivers for different lengths of time. Many have multiple births and children do not always leave the home at age 18, but the chosen endpoint must be consistent for all women and thus 18 years post-fertility was the most appropriate choice. To account for any correlated errors in the repeated measures, I employ robust standard errors.
To deal with missing data, I used multiple imputation to impute missing values for all independent variables or covariates (Allison 2001), although I did not use multiply imputed data to present estimates based on raw frequencies (the histograms and the Kaplan Meier failure estimates). I used Stata’ ice program to impute 20 datasets (using the dependent variables in the imputation model) and the mi estimate suite of commands to analyze multiply imputed data (Royston 2004). Missing data on the dependent variable, which is an issue that only applies to the event-history models (i.e., cases of censoring), is not imputed, but rather, is assumed to be independent of the censoring mechanism (i.e., missing at random [MAR])—a key assumption of discrete event history models shared by multiple imputation (Allison 2001; Singer and Willett 2003). Overall, rates of missing data vary. Missing data on time-invariant background factors is low (no more than 4% on all variables, except for school poverty, which is missing in 40% of cases). Rates of missingness on measures of additional maternal education are no greater than 20%. Time-varying information (e.g., at older child ages) reached higher levels of missingness due to attrition (about 40% by 2010), although the availability of earlier time-varying measures of the same variable for the imputation model provided high quality estimates in such missing data cases (see Allison 2009). Moreover, estimates based on observed data are remarkably similar to the imputed ones. For example, results in Table 1 and 2 are nearly identical; results in Table 3 are the same 71% of the time; when they were not the same, they varied by 1% or 1/10 of a unit 72% of the time.
Table 1.
Descriptive Information of the Post-Motherhood Education of NLSY79 Women (N=4,925) 1
| Education at Time of First Child’s Birth
|
|||||
|---|---|---|---|---|---|
| Less than High School | High School Degree/GED | Associate’s degree Degree | Bachelor’s degree1 | Full Sample | |
| Ever reenrolled in school | 28% | 24% | 26% | --- | 25% |
| Obtained post-motherhood education1 | 43% | 15% | 13% | --- | 17% |
| Education at child age 182 | |||||
| Less than high school | 57% | --- | --- | --- | 7% |
| High school/GED | 37% | 85% | --- | --- | 56% |
| Associate’s degree/some college | 5% | 11% | 87% | --- | 14% |
| Bachelor’s degree | 1% | 4% | 13% | --- | 22% |
| Weighted percent2 | 20% | 55% | 7% | 18% | 100% |
| Raw n2 | 1,088 | 2,145 | 242 | 547 | 4,022 |
Notes:
Some estimates based on subsample of women who had less than a Bachelor’s degree at the time of their first child’s birth (N=4,291). Post-motherhood education was not calculated for women who had Bachelor’s degrees at the time of first birth. 2 Estimates based on weighted sample.
Raw n’s do not add to 4,925 because it excludes women for whom information on their education at their time of first birth was missing. Estimates of percentages, however, are based on imputed data, and thus, the full analytical sample of 4,925 women.
Table 2.
Descriptive Information on the NLSY79 Women Who Obtained Post-Motherhood Education, Stratified by the Type of Education Obtained (N= 848)1
| Type of Post-Motherhood Education
|
|||
|---|---|---|---|
| High School Degree/GED | Associate’s degree or Some College | Bachelor’s degree | |
| Mother Education at First Birth | |||
| Less than high school | 100% | 15% | 6% |
| High school degree/GED | --- | 85% | 65% |
| Associate’s degree | --- | --- | 28% |
| Bachelor’s degree | --- | --- | --- |
| Relevant Time-Related Factors | |||
| Years since giving birth | 6.51 | 9.38 | 9.01 |
| Calendar year (rounded) | 1987 | 1993 | 1995 |
| Weighted % (of full sample)3 | 8% | 9% | 3% |
| Raw n | 393 | 376 | 134 |
Notes:
Estimates calculated for the subsample of NLSY79 women (N= 848) who obtained additional education after becoming a mother.
Presented background characteristics represent a selection of the time-invariant covariates used in the multivariate models.
Full sample includes 4,925 women. Standard deviation presented in parenthesis. Estimates based on weighted sample.
Table 3.
Employment, Economic, and Sociodemographic Characteristics of NLSY79 Mothers at the Time They Obtained Each Level of Post-Motherhood Education (N= 848)1
| High School Degree/GED | Associate’s degree or Some College | Bachelor’s degree | |
|---|---|---|---|
|
|
|||
| Occupational Sector | |||
| Professional/managerial | 7% | 31% | 48% |
| Technical/sales/administrative support | 28% | 44% | 34% |
| Service occupations | 40% | 20% | 14% |
| Other | 26% | 4% | 4% |
| Economic Factors | |||
| Family income | 15,331.01 (924.56) | 34,012.96 (2,415.78) | 73,703.23 (18,855.61) |
| Partner income | 8,855.10 (1255.86) | 18,493.46 (2,369.61) | 38,968.17 (5,546.32) |
| Family wealth | 12,758.29 (2,978.51) | 43,999.68 (6,224.62) | 203,475.60 (77,178.19) |
| Poverty | 53% | 29% | 15% |
| Employment Characteristics | |||
| Number of weeks out of labor market | 32.11 (1.74) | 24.16 (2.52) | 29.37 (4.54) |
| Average number of jobs per year | .66 (.05) | .58 (.02) | .55 (.04) |
| Employed | 25% | 60% | 51% |
| Family and Maternal Characteristics | |||
| Divorced/widowed | 22% | 29% | 15% |
| Never married | 23% | 16% | 10% |
| Number of children in home | 1.63 (.06) | 1.82 (.06) | 1.76 (.12) |
| Mother age | 24.86 (.37) | 31.32 (.36) | 33.41 (.59) |
| Region | |||
| North east | 12% | 14% | 21% |
| Midwest | 25% | 28% | 21% |
| South | 41% | 37% | 46% |
| West Coast | 22% | 22% | 12% |
| Weighted % (of full sample)2 | 7% | 8% | 3% |
| Raw n2 | 421 | 401 | 136 |
Notes:
Estimates calculated for the subsample of NLSY79 women (N= 848) who obtained additional education after becoming a mother.
Sum of numbers greater than 858 because some women achieved multiple levels of post-childbearing education. Standard deviation presented in parenthesis. Estimates based on weighted sample.
Results
Descriptive Statistics
Table 1 presents cross-tabulations of mother’s education at the time of first birth with her education 18 years later. Overall, I find that 17% of mothers increased their education to either a high school degree/GED, Associate’s degree or two years of college education, or Bachelor’s degree, and one quarter reenrolled in school. Among mothers who began with less than a high school degree, 43% increased their education. Among mother who began with a high school degree or GED, 15% increased their education. Among mothers who began with an Associate’s degree, 13% increased their education to a Bachelor’s degree. Of the women who did not have a high school degree at first birth (20% of the NLSY79 sample), 56% earned a high school degree/GED, 5% completed an Associate’s degree or two years of college, and 1% earned a Bachelor’s degree. Of the women who had high school degrees/GEDs at first birth and increased their education (82%), 11% earned an Associate’s degree or some college and 4% earned a Bachelor’s degree.
I also report related statistics that focus only on women who earned post-childbearing education (N = 848) in Table 2, which reflects the 8% of the total sample who earned a high school degree post-childbearing, 9% who completed an Associate’s degree or some college, and 3% that earned a Bachelor’s degree. Within these groups, I report estimates of their education at first birth, which differ from those in Table 1, as some mothers earned multiple degrees. I find that out of the 3% of mothers that earned a Bachelor’s degree, 28% began with an Associate’s degree, 65% had a high school degree/GED, and 6% had no high school education. Out of the 9% of mothers who earned an Associate’s degree or some college education, 85% began with a high school degree or GED while 15% did not have one. Mothers who did not have a high school degree at first birth but later increased their education did so, on average, 6.51 years after giving birth. For women with a high school education/GED, they completed their education, on average, 9.38 years after the transition to motherhood. For the Associate’s degree group, the mean time to a Bachelor’s degree was 9.01 years.
Figures 1 and 2 provide more detail on the timing of mothers’ additional education vis-a-vis their transition to motherhood. Figure 1 plots frequencies of years since first birth for reenrollment and different degree types. Looking at the graph for those who earned a high school degree/GED reveals that while mean time to degree was 6.51 years, degree receipt was clustered during the years immediately following first birth (years 0–5). After year five, the number of mothers earning a high school degree/GED declines. The pattern also appears for reenrollment. Alternately, for the women who earned at least two years of college or an Associate’s degree, there was a slight uptick in completion after year five which continued until about year 14, when it slightly declined. There did not appear to be a timing related pattern among women who earned a Bachelor’s degree.
Figure 1.
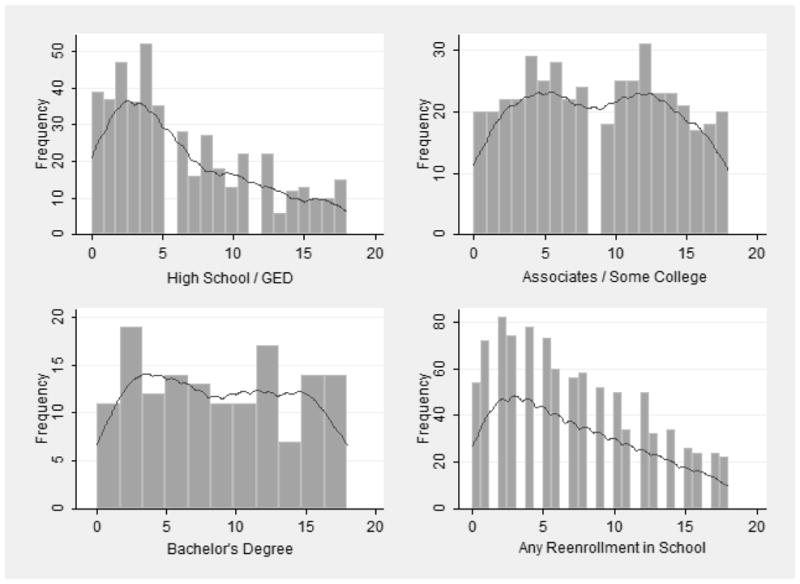
Frequencies of Additional Education/Reenrollment by Years Since First Birth
Notes: Frequencies correspond to years since the mother first gave birth, or correspondigly the age of the oldest child. Reenrollment and Associate’s degree/some college estimated among women without Bachelor’s degrees at time of first birth. Associate’s degree/some college estimated among women with a high school degree or less at first birth. High school/GED estimated among women without a high school degree or equivalency at first birth.
Figure 2.
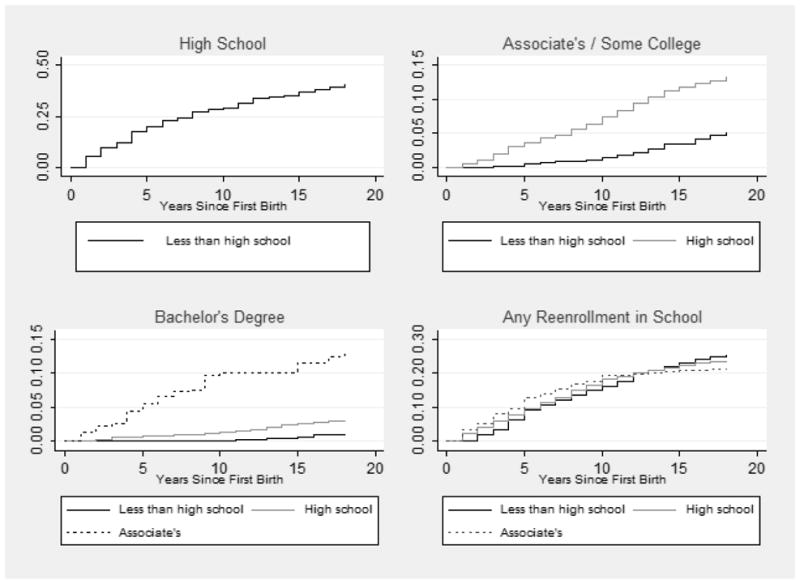
Kaplan-Meier Failure Estimates for Additional Education Presented for Education Type and Additional Education, Stratified by Education at First Child’s Birth
Notes: Ticks on y axis presented in increments of .25 for high school. Ticks in increments of .05 for Associate’s degree/Some College and Bachelor’s degree and .10 for Any Reenrollment. Reenrollment and Associate’s degree/some college estimated among women without Bachelor’s degrees at time of first birth. Associate’s degree/some college estimated among women with a high school degree or less at first birth. High school/GED estimated among women without a high school degree or equivalency at first birth.
Figure 2 plots Kaplan-Meier failure estimates which provide a cumulative look at the timing of different types of additional maternal education. It allows one to determine the percentage of mothers who had earned a particular type of education at each point in time among those at risk of earning it. The plots are stratified by education at first birth. For example, ten years after becoming a mother, more than half of women at risk of earning a high school degree or GED (women who started out without a high school education) had earned one. Similarly, by year ten, the majority of women with an Associate’s degree at first birth who later earn a Bachelor’s degree had done so, with a smaller proportional increase between year 10 and 18. Yet the majority of women who earned a Bachelor’s degree but started with less than an Associate’s degree did so some time after year 10. Log likelihood test statistics suggested that rates of degree completion did vary by starting education. The cumulative failure rates of earning an Associate’s degree or two years of college revealed similarly low rates during the first few years for the two groups of women at risk of doing so (those with less than an Associate’s degree), but then steadily diverge over time, with high school graduates returning to school to complete an Associate’s degree or some college at higher rates. A log likelihood test also suggested that rates varied by starting education.
The final set of descriptive statistics in Table 3 provides information of the characteristics of women who earned any post-childbearing education around the time they did so to give a sense of the life circumstances of mothers earning additional education. For example, mothers who earn a high school degree/GED were approximately 25 years old on average. About half of them had never married or were divorced, and 40% were working in service jobs. A total of 53% reported being poor and only 25% reported being employed. In comparison, mothers who earned an Associate’s degree or two years of college were on average about 31 years old, typically worked in a technical/sales/administrative support, and were employed at higher rates (60%). Compared to mothers who earned a high school degree/GED, they also had more income and wealth, had spent less time out of the labor market that year (24.16 weeks vs. 32.11 weeks) and had more job stability (reflected in the rate of different jobs per year), and had higher rates of divorce (29%), although they were less likely to have been never married (16%). Women who earned a Bachelor’s degree, on average, were about 33 years old. The modal occupation was managerial or professional. Only ¼ were divorced or single and over half were employed. Unsurprisingly, they had more income and wealth than other mothers and were less likely to report being poor (15%), but their rates of job stability were about the same (.55 vs. .58) as women who had earned an Associate’s degree or some college and they spent more weeks out of the labor market than them.
Bivariate Associations
The next estimates provide two sets of comparisons. Table 4 compares the background characteristics of women with the same starting levels of education who did not earn additional education to those who did. Table 5 looks at women whose highest education was the same (18 years post-childbirth) and compare between those who earned that degree before the transition to motherhood (i.e., the “traditional” route) with those who completed it afterward. The results of Table 4 reveal few significant differences in the characteristics of women who returned to school compared to similar women (defined by their education at child birth) who did not. For mothers who started without a high school degree, the only differentiating characteristics were mothers’ race (a larger share of women who pursued additional education were White [69%] than were Black [21%] or Hispanic[10%] compared to the race/ethnic distribution of women who did not increase their education), if the family of origin received welfare (less common among mothers that obtained additional education than mothers who did not; 21 vs. 27%), and number of siblings (which was fewer in families of women who obtained additional education than in families of women who did not). For mothers who had a high school degree/GED at first birth, a smaller proportion of minorities earned post-childbearing education than did not (75 vs. 81%). Within this group, women that earned additional education were also more likely to have grown up with a single mother (33 vs. 24%), to have been never married at time of first birth (36% vs 20%), and were a younger age at first birth (22.88 vs 24.16 years). Yet their parents had more education (18 vs. 8% had college educated fathers; 9 vs. 4% had college educated mothers). For women starting out with an Associate’s degree, there were few notable differences except by parents’ education (e.g., 23% of mothers who increased their education had mothers who had no high school education vs. 10%) and age at first birth (26.67 years among returners vs 28.06).
Table 4.
Descriptive Information on NLSY79 Women by Education at Time of First Birth, Comparing Between Women Who Returned to School to Earn Additional Education to Those Who Did Not (N= 4,925)
| Education at First Child’s Birth
|
||||||
|---|---|---|---|---|---|---|
| Less than High School | High School Degree/GED | Associate’s degree | ||||
|
| ||||||
| No Additional Education | Additional Education | No Additional Education | Additional Education | No Additional Education | Additional Education | |
| Mother Background Characteristics | ||||||
| White | 56% | 69%*** | 81% | 75%* | 83% | 84% |
| Black | 30% | 21%*** | 13% | 19%+ | 11% | 11% |
| Hispanic | 14% | 10%* | 6% | 6% | 6% | 5% |
| Foreign born | 8% | 6% | 5% | 3%+ | 2% | 2% |
| Foreign language | 20% | 17% | 12% | 13% | 12% | 12% |
| Foreign born parent | 13% | 11% | 8% | 6%+ | 10% | 10% |
| Lived with single mother | 39% | 43% | 24% | 33%* | 18% | 16% |
| Family received welfare | 27% | 21%* | 8% | 7% | 3% | 1%+ |
| Urban area (1979) | 79% | 76% | 78% | 78% | 80% | 87% |
| Proportion of school poor | 30% | 27% | 21% | 20% | 17% | 15% |
| Father less than high school | 64% | 56%+ | 42% | 35%* | 26% | 23% |
| Father high school degree | 29% | 33% | 41% | 38% | 36% | 39% |
| Father some college | 4% | 7% | 9% | 9% | 18% | 25%* |
| Father Bachelor’s degree | 4% | 4% | 8% | 18%* | 22% | 12% |
| Mother less than high school | 67% | 61% | 38% | 38%* | 23% | 10%** |
| Mother high school degree | 28% | 33% | 50% | 53% | 50% | 61% |
| Mother some college | 4% | 4% | 8% | 10% | 20% | 19% |
| Mother Bachelor’s degree | 2% | 2% | 4% | 9%* | 7% | 10% |
| Number of siblings | 4.52 (.14) | 4.06* (.14) | 3.51 (.06) | 3.59 (.15) | 3.20 (.14) | 2.90 (.35) |
| Other Characteristics at First Birth | ||||||
| Divorced/widowed | 6% | 5% | 5% | 3% | 5% | 7% |
| Never married | 56% | 50% | 21% | 33%*** | 11% | 8% |
| Poverty | 60% | 54% | 20% | 20% | 6% | 8% |
| Employed | 15% | 13% | 40% | 39% | 51% | 57% |
| Age | 18.23 (.19) | 18.24 (.17) | 24.16 (.13) | 22.88*** (.26) | 28.06 (.37) | 26.67* (.47) |
| Weighted % within degree | 58% | 43% | 85% | 15% | 87% | 13% |
| Raw n’s of total sample | 664 | 391 | 1,798 | 306 | 210 | 32 |
Notes: Significant differences between pre-fertility and post-fertility group within each education strata indicated in post-fertility column. Standard errors presented in parenthesis. Estimates based on weighted sample.
p<.001,
p<.01,
p<.05,
p<.10.
Table 5.
Descriptive Information on NLSY79 Women By Highest Level of Education at Child Age 18, Comparing Between Women Who Earned Their Education Before Having Children and Those That Earned it After Having Children (N= 4,925)
| Highest Degree 18 Years after First Becoming a Mother
|
||||||
|---|---|---|---|---|---|---|
| High School Degree/GED | Associate’s degree or Some College |
Bachelor’s degree | ||||
|
| ||||||
| Obtained Pre- Motherhood |
Obtained Post- Motherhood |
Obtained Pre- Motherhood |
Obtained Post- Motherhood |
Obtained Pre- Motherhood |
Obtained Post- Motherhood |
|
| Mother Background Characteristics | ||||||
| White | 79% | 70%*** | 78% | 73% | 91% | 78%* |
| Black | 15% | 20%* | 17% | 20% | 6% | 15%* |
| Hispanic | 6% | 10%** | 5% | 7% | 3% | 6%* |
| Foreign born | 5% | 5% | 2% | 3% | 5% | 4% |
| Foreign language | 12% | 15%* | 13% | 15% | 12% | 14% |
| Foreign born parent | 8% | 10% | 9% | 6% | 11% | 8% |
| Lived with single mother | 25% | 43%*** | 21% | 30%* | 15% | 32%*** |
| Family received welfare | 9% | 18%*** | 5% | 10%* | 1% | 7%** |
| Urban area (1979) | 78% | 75% | 83% | 79% | 81% | 81% |
| Proportion of school poor | 22% | 26%** | 17% | 21%+ | 13% | 17% |
| Father less than high school | 44% | 55%*** | 25% | 38%** | 12% | 26%** |
| Father high school degree | 41% | 35%* | 37% | 38% | 28% | 36% |
| Father some college | 8% | 6% | 16% | 12% | 14% | 13% |
| Father Bachelor’s degree | 7% | 5%** | 21% | 13%* | 46% | 26%** |
| Mother less than high school | 41% | 57%*** | 22% | 33%* | 8% | 20%** |
| Mother high school degree | 49% | 36%*** | 49% | 48% | 44% | 56%* |
| Mother some college | 7% | 4% | 18% | 9%** | 20% | 14%* |
| Mother Bachelor’s degree | 3% | 2% | 10% | 9% | 27% | 10%** |
| Number of siblings | 3.57 (.06) | 4.01*** (.15) | 3.23 (.12) | 3.67* (.17) | 2.69 (.07) | 3.31* (.19) |
| Other Characteristics at First Birth | ||||||
| Divorced/widowed | 5% | 7% | 3% | 4% | 2% | 3% |
| Never married | 23% | 48%*** | 13% | 38%*** | 4% | 21%*** |
| Poverty | 23% | 47%*** | 10% | 27%*** | 3% | 19%*** |
| Employed | 37% | 18%*** | 50% | 33%*** | 57% | 43%* |
| Age | 23.46 (.14) | 19.24*** (.24) | 26.97 (.29) | 21.40*** (.28) | 29.58 (.20) | 24.41*** (.49) |
| Weighted % within degree | 87% | 13% | 62% | 38% | 85% | 15% |
| Raw n’s of total sample | 1932 | 361 | 348 | 241 | 568 | 132 |
Notes: Significant differences between pre-fertility and post-fertility group within each education strata indicated in post-fertility column. Standard errors presented in parenthesis. Estimates based on weighted sample.
p<.001,
p<.01,
p<.05,
p<.10.
Turning to Table 5, I find far more differences between women who earned a degree post-childbearing from those who earned the same degree before motherhood. Among those whose highest degree was a high school diploma/GED, women who earned it post-motherhood were more likely to be a minority (20 vs. 15% Black, 10 vs. 6% Hispanic), have lived in a home where a foreign language was spoken (15% vs. 12%), the mother was single (43% vs. 25%), the family received welfare (18% vs. 9%), and there were more children (4.01 vs. 3.56). They also went to high schools with a greater proportion of poor students (26% vs. 22%), and their parents had less education (55% of fathers had no high school education vs. 44%; 57% vs. 41% for their mothers). They were also younger at age of first birth (19.24 years vs. 23.45), more likely to have been unmarried (48% vs. 23%) or experienced poverty (47% vs. 23%), and were less likely to be employed (18% vs. 37%). Among mothers whose highest degree was an Associate’s degree or some college, I find the same factors are significantly different across groups, and the patterns follow the same direction, with two exceptions; there was no difference by race/ethnicity or foreign language. For women whose highest degree was a Bachelor’s degree, race/ethnicity is statistically significant between groups as are the other characteristics previously noted.
Multivariate Analyses
In the final analyses, I use event-history methods to predict the odds of reenrollment (enrolling in school after a spell of unenrollment irrespective of future degree attainment) or earning different levels of education, post-childbearing, by an extensive set of time-invariant and time-varying factors, which were assessed during the same wave as mothers’ education.
Model 1 of Table 6 predicts reenrollment among mother who did not have a Bachelor’s degree at the time of first birth. I find that the odds Black and Hispanic women reenrolled was 54% and 37% greater than for Whites. Increased odds of reenrollment was also associated with growing up with a single mother (OR=1.19), AFQT score (OR=1.01), poverty (OR=1.22), job instability (OR=1.20), and having divorced (OR=1.82) or never married (OR=1.42) versus married. Being employed was associated with decreased odds of enrollment (OR=.75), as was each unit increase in mothers’ age or number of children (OR=.90; OR=.96). Among women at risk of earning a high school degree or GED, the results in Model 2 reveal that being Black (vs. White) was associated with a 33% decrease in the odds of earning such a degree, as was growing up in an urban area (OR=.71). Mothers’ AFQT score (OR=1.02), current poverty (OR=1.42), prior labor force instability (OR=1.29), and early expectations of earning a 4-year degree (OR=1.70) were associated with increased odds of returning to school to earn a high school diploma/GED.
Table 6.
Discrete Event History Models Estimating the Associations between NLSY79 Mothers’ Odds of School Reentry/Additional Education and Time-Varying and Time-Invariant Characteristics (N= 4,925)
|
B (SE)
|
||||
|---|---|---|---|---|
| Model 11 (N=3,478)
|
Model 21 (N=1,088)
|
Model 31 (N=3,233)
|
Model 41 (N=3,478)
|
|
| Years since first birth | .98* (.01) | .99 (.02) | 1.05* (.01) | 1.04 (.03) |
| Education at Child Birth | ||||
| High school | 1.01 (.13) | --- | 2.24 (.45) | 1.31 (.53) |
| Some college | .98 (.20) | --- | --- | 2.59* (1.25) |
| Bachelor’s degree | --- | --- | --- | --- |
| Time-Invariant Factors | ||||
| Sociodemographic Factors | ||||
| Black | 1.54*** (.19) | .66* (.14) | 1.40* (.24) | 1.63 (.51) |
| Hispanic | 1.37+ (.24) | .85 (.27) | 1.34 (.36) | 1.74 (.84) |
| Foreign born | .78 (.17) | 1.15 (.36) | .64 (.22) | .71 (.42) |
| Foreign language | 1.14 (.19) | .88 (.32) | 1.38 (.34) | 1.33 (.53) |
| Foreign born parent | 1.17 (.18) | 1.05 (.33) | .79 (.20) | .93 (.43) |
| Lived with single mother | 1.19* (.11) | 1.10 (.16) | 1.20 (.17) | 1.45 (.35) |
| Family received welfare | .95 (.10) | .90 (.15) | .93 (.17) | .86 (.32) |
| Urban area (1979) | 1.07 (.12) | .71* (.12) | .78 (.13) | .79 (.23) |
| Proportion of school poor | 1.00 (.00) | .99 (.00) | .99 (.00) | 1.00 (.01) |
| Number of siblings | .99 (.02) | .99 (.03) | 1.02 (.03) | 1.02 (.05) |
| Parents’ education | ||||
| Father high school degree | 1.03 (.11) | 1.09 (.20) | 1.01 (.16) | 1.06 (.33) |
| Father some college | 1.03 (.17) | 1.20 (.48) | 1.12 (.28) | 1.12 (.47) |
| Father Bachelor’s degree | 1.52 (.26) | 1.10 (.53) | 1.21 (.29) | 1.28 (.54) |
| Mother high school degree | .95 (.10) | 1.10 (.19) | 1.10 (.17) | 1.41 (.42) |
| Mother some college | 1.08 (.20) | .92 (.39) | .90 (.24) | 1.12 (.47) |
| Mother Bachelor’s degree | 1.21 (.26) | 1.41 (.69) | 1.30 (.41) | 1.32 (.47) |
| Other Background Factors | ||||
| Mother AFQT Score | 1.01*** (.00) | 1.02*** (.00) | 1.02** (.00) | 1.02** (.01) |
| More reported self-esteem | 1.25 (.13) | .94 (.19) | 1.23 (.21) | 1.50 (.40) |
| Early alcohol use | .96 (.04) | .90 (.06) | .87* (.06) | .89 (.11) |
| Academic Expectations | ||||
| High school | .94 (.09) | 1.25 (.23) | 1.91 (1.29) | .27 (.24) |
| Some college | 1.73 (.39) | 1.42 (.42) | 4.36* (2.96) | 1.30 (1.17) |
| Bachelor’s degree | 1.89 (.42) | 1.70 (.47)* | 4.11* (2.83) | 1.69 (1.53) |
| Time-Varying Factors | ||||
| Occupational Sector | ||||
| Technical/sales/administrative support | .82 (.12) | .90 (.37) | .59** (.11) | .40** (.14) |
| Service occupations | .76+ (.12) | .90 (.36) | .42** (.11) | .26** (.10) |
| Other | .46*** (.09) | .79 (.32) | .22*** (.07) | .15** (.11) |
| Economic/Employment Factors | ||||
| Family income | .99 (.00) | .99 (.00) | .99 (.00) | 1.00 (.00) |
| Family wealth | .99 (.00) | .99 (.00) | .99 (.00) | 1.00 (.00) |
| Poverty | 1.22+ (.14) | 1.42* (.25) | 1.83*** (.35) | 1.33 (.46) |
| Weeks out of labor market | 1.00 (.00) | .99 (.00) | 1.01* (.00) | 1.00 (.00) |
| % time employed since age 18 | 1.20+ (.12) | 1.29* (.15) | 1.73** (.32) | 1.39 (.46) |
| Employed | .75** (.08) | .86 (.18) | 1.48* (.26) | 1.02 (.29) |
| Family and Maternal Factors | ||||
| Single (married) | 1.82*** (.22) | 1.04 (.20) | 1.55** (.25) | .93 (.30) |
| Never married | 1.42** (.19) | 1.10 (.22) | 1.25 (.27) | .88 (.31) |
| Number of children in home | .90* (.04) | 1.07 (.08) | .91 (.06) | .81 (.12) |
| Mother birth age | .96*** (.01) | .98 (.02) | .95** (.02) | .94* (.03) |
| Region | ||||
| Midwest (North east) | 1.09 (.15) | .63+ (.16) | 1.07 (.24) | .94 (.38) |
| South | 1.19 (.15) | .73 (.18) | 1.19 (.25) | 1.47 (.50) |
| West Coast | 1.16 (.17) | .73 (.21) | 1.15 (.27) | 1.01 (.43) |
| Post-childbearing woman years1 | 64,908 | 81,148 | 82,102 | 79,440 |
Notes:
Model 1 predicts reentry. Model 2 predicts a high school degree or GED. Model 3 predicts Some College or an Associate’s degree. Model 4 predicts a Bachelors Degree. Estimates based on weighted sample. Subpop feature is used to exclude cases in estimation, but all cases counted toward count of woman years. Number of child years varies somewhat across columns due to differences in missing on the dependent variable.
p<.001,
p<.01,
p<.05,
p<.10.
In Model 3, I find that being Black (vs. White) is again associated with an increased odds of earning an Associate’s degree or some college (OR=1.40), as is each unit increase in mothers’ AFQT score (OR=1.02) or weeks out of the labor market (OR=1.01), poverty (OR=1.83), job instability (OR=1.73), being employed (OR=1.48), and divorced vs. married (OR=1.55). Early alcohol use is associated with a 13% decreased odds as is each unit increase in age at first birth (OR=.95) and employment in all occupation categories compared to professional and managerial. Model 4 focused on women at risk of earning a Bachelor’s degree, and revealed only a few significant predictors. Among them, having some college was associated with an increased odds of earning a Bachelors’ (OR=2.59), as was each unit increase in AFQT score (OR=1.02). A unit increase in mothers’ age at first birth was associated with a 6% decrease in the odds of returning to school to earn a Bachelor’s degree. Compared to women in professional or managerial occupations, mothers in all other categories were at decreased odds of returning to school to earn a Bachelor’s degree.
Discussion
The life course trajectories of U.S. women have grown increasingly varied as a nontrivial proportion of women now complete their schooling after the transition to motherhood (MacGregor 2010; NCES 2011). This historic change in women’s lives has not gone unnoticed by scholars and policy makers. For example, a small emerging literature examines the returns to post-childbearing education for mothers and children (Harding 2015; Magnuson 2007; Thurston and Roska 2012). There is also growing policy interest in “two generation” interventions that encourage women’s post-childbearing educational attainment as a way of improving the lives of both mothers and children (Chase-Lansdale and Brooks-Gunn 2014). As such, it is surprising we know so little about this trend and the population of women driving it. This study represents a step in learning more about this life course phenomenon using data from a cohort of women who were raising children during a time of tremendous change in the work, schooling, and family experiences of women, and thus, shifts in the structures organizing women’s life courses.
First, population based estimates described which education groups of women were most likely to return to school and what their typical post-childbearing attainment looked like. For example, I found that 28% of mothers who earned a Bachelor’s degree began with an Associate’s degree, but 65% had a high school degree or GED. Only 5% lacked a high school degree. Thus, while it appears that many mothers who earned four-years degrees began their pursuit of additional education with less education than we might anticipate, such numbers also highlight how two generation approaches aimed at helping disadvantaged mothers complete a college degree may have a harder time reaching the subset of mothers for whom such programs would have the biggest impact: those without high school degrees. At the same time, over 40% of high school drop outs increased their education—a number on par with studies on high school drop outs in general (Rumberger & Lamb 2003). Thus, these results suggest that young mothers with children may be no less likely to return to school than those who dropped out for other reasons. Broadly, the array of figures provided in this study provide much needed information for policy makers, who currently lack basic statistics by which to assess the potential for programs which support mother’s additional schooling, or researchers studying topics related to this phenomenon.
This study also explored the timing of mothers’ schooling vis-à-vis the transition to motherhood. For all three educational outcomes, the average time to completion occurred when the first child had entered formal schooling. Moreover, five years after giving birth, less than 1/3 of mothers who returned to school to earn an Associate’s degree, some college, or a Bachelor’s degree had done so. After this time, the rate of increase was gradual, not sharp, which is a pattern that contrasts with the findings of Bradburn and colleagues (1995). These findings move the current research which is has focused on women with young children (Harding 2015; Magnuson et al. 2009) in a new direction. They also suggest we need to better understand cohort based changes in the timing of women’s post-fertility schooling, heterogeneity in the timing of mothers’ return to school, and the impact on families’ wellbeing given such timing differences. From a social policy perspective, it suggests that social policies need to be designed that support women with older children as well as younger children.
Furthermore, this study provided information on the background characteristics of mothers who earned additional schooling, revealing that mothers who returned to school to earn an academic credential were more disadvantaged in a number of ways compared to women who completed the same credential before having children. Although this pattern is not surprising, the fact that this particular pattern of life course sequencing is driven by less advantaged segments of women suggests that increased education may represent an adaptive strategy for those women who face the greatest challenges to mobility (Moen and Wethington 1992), particularly during a time when the crescendo of calls to tie welfare to work was growing louder. Conversely, it also informs studies on whether the returns to education may be less for women who achieve it at later stages of the life course. For policy, these insights underscore how many women from disadvantaged backgrounds not only desire to pursue additional schooling, as reported elsewhere (e.g., Edin and Kafalas 2005, Katz 2013), but actually do, and as such, future work and family policy should be careful not to create barriers that reverse this trend.
Alternately, I also found that women who returned to school compared to those that did not but had similar educations at the time of first birth were not as select in their background characteristics as one might assume—a pattern also noted by Rich and Kim (1999). This finding suggests we likely need new data, including qualitative data, to yield better insights into how mothers who return to school differ from mothers of similar educational backgrounds that do not. Such information is essential to crafting policies that better target the factors that help or hinder mothers’ pursuit of additional education.
Moreover, while such studies may not be able to achieve representativeness, they could draw on the information presented here to provide a portrait of mothers’ lives around the time they earned their additional education. This information is a necessary update to the study by Bradburn et al. (1995) which found that the mean age of mothers returning to school was 44 (my study found that women were far younger around age 29) and that returning mothers were more economically advantaged. I found that poverty was a common feature among women with children that increased their education. The multivariate models also revealed a pattern associated of economic and demographic factors connected to disadvantage, although mothers were also more likely to increase their education if they had higher academic ability and personal aspirations, labor force attachment, professional job experience and were younger too. Other factors, such as mothers’ marital status, were not associated with increased odds of earning additional education, although it was associated with reenrollment. This finding suggests that unmarried mothers with children in school may face more barriers to pursuing a degree than married women—a finding which could be further examined in future research as well.
In spite of such contributions, the study also had limitations. First, a study of this kind must rely on available sources of data. To date, the NLSY79 is the only one up to the task. It is also based on a cohort of women born in the early to mid-1960’s. Given much of the trend in post-secondary enrollment among adults with dependents seems to have occurred in the last decade and likely driven by women born a few decades later, more contemporary data is desirable. We will have to wait some time to examine this possibility once more recent cohorts of women, for whom there is similarly extensive longitudinal data available, like the NLSY97, have completed both their schooling and fertility. This study, however, sets the stage for future comparative analyses using the NLSY97 data.
Another limitation of the data is that, while it is considered nationally representative, its representativeness of certain subpopulations, especially Hispanic women, has decreased over time. This problem has been documented elsewhere (see Wolter 2008) and is shared by other nationally representative data collections that began decades ago. Next, there was missing data, largely due to attrition. I used multiple imputation techniques, but the results of imputed analyses in a descriptive study of this kind may elicit more skepticism. Results based on the observed and imputed values were remarkably similar, however. Next, I cannot capture all non-four year post-secondary credentials as well as other studies do, perhaps due to the specific questioning in the NLSY79. I therefore consider academic gains reflected in two years of college, but it would be preferable to know whether a degree or certificate was earned and what type. I also do not distinguish between high school degrees or GEDs to prevent the results from being overwhelmingly nuanced, but this grouping is also often made when categorizing education. The time-varying measures were also assessed at the same time as mothers’ education. These measures are intended to reflect the life circumstances of mothers around the time they earned their degree, but it is possible that in some cases they reflect the degree earned. Although, I cannot eliminate this potential source of error in these measures, it is likely to introduce less error in measurement than using data often taken two years earlier from the previous wave. Next, although I included a rich array of time-varying (e.g., marital status) and time-invariant (e.g., family background, AFQT scores, measures of delinquency and self-esteem) factors, I may have not accounted for the full range of factors associated with mother’s selection back into school, or different types of schooling. Although the associations presented in this study are descriptive and not intended to convey causal connections, accounting for such factors could alter the patterns of associations reported in this study. It also remains possible that the association between these factors (e.g., link between marital status and degree attainment) may vary at different stages of women’s life course (such as at younger versus older ages)—a possibility that should also be investigated in future research. Lastly, measures of enrollment are based on enrollment during the current survey year, and therefore, does not capture some mother’s reenrollment, especially after 1994 when data collection became biennial.
In sum, more research is needed to illuminate the various reasons for this new life course trajectory, the impact of returning to school and earning post-childbearing education on mothers and children, and changes and continuities in this trend across time. Such research is essential to understanding a how key element of people’s lives, their education, is obtained and shapes other dimensions of the life course in contemporary times. Yet such studies also would be incomplete without drawing on the information presented here. This study, therefore, provides the necessary foundation for these pursuits and a spring board for future investigations on a timely topic by describing a key change in the life course patterns of contemporary U.S. women during a time when women’s lives were undergoing tremendous change. By doing so, the study also lays the foundation for future investigations that explore this changing life course pattern in a more contemporary cohort of women—for example, mothers raising children during the post welfare reform era, when opportunities for low-income mothers to pursue additional education were restricted (Katz 2013) and tuition increased precipitously, yet access to loans to support the pursuit of additional schooling and education-related wage gaps increased as well.
References
- Allison PD. Missing data. Thousand Oaks, CA: Sage Publications; 2001. [Google Scholar]
- Allison PD. Missing data. In: Millsap Roger E, Maydeu-Olivares Alberto., editors. The SAGE handbook of quantitative methods in psychology. Sage Publications; 2009. [Google Scholar]
- Astone N, Schoen R, Ensminger R, Roberts K. School reentry in early adulthood: The case of inner-city African Americans. Sociology of Education. 2000;73:133–154. [Google Scholar]
- Autor D. Skills, education, and the rise in earnings inequality among the ‘other 99 percent. Science. 2014;344:843–851. doi: 10.1126/science.1251868. [DOI] [PubMed] [Google Scholar]
- Blau F. Trends in the well-being of American women, 1970–1995. Journal of Economic Literature. 1998;26:112–165. [Google Scholar]
- Bozick R, DeLuca S. Better late than never? Delayed enrollment in the high school to college transition. Social Forces. 2005;84:531–554. [Google Scholar]
- Bradburn EM, Moen P, Dempster-McClain D. Women’s return to school following the transition to motherhood. Social Forces. 1995;73:1517–1551. [Google Scholar]
- Brandon P. Trends over time in the educational attainment of single mothers. Focus. 1993;15:26–34. [Google Scholar]
- Brewster KL, Rindfuss RR. Fertility and women’s employment in industrialized nations. Annual Review of Sociology. 2000;26:271–296. [Google Scholar]
- Buchmann C, DiPrete TA, McDaniel A. Gender inequalities in education. Annual Review of Sociology. 2008;34:319–37. [Google Scholar]
- Cancian M, Reed D. Changes in family structure, childbearing, and employment: Implications for the level and trend in poverty. Changing Poverty, Changing Policies. 2009:92–121. [Google Scholar]
- Carnevale A, Smith N, Strohl S. Recovery: Job growth and educational requirements through 2010. Georgetown Public Policy Institute; 2015. https://cew.georgetown.edu/wp-content/uploads/2014/11/Recovery2020.ES_.Web_.pdf. [Google Scholar]
- Chase-Lansdale LP, Brooks-Gunn J. Two-generation programs in the 21st century. The Future of Children. 2014;24:13–39. doi: 10.1353/foc.2014.0003. [DOI] [PubMed] [Google Scholar]
- Cochran WG. Sampling techniques. 3. New York: John Wiley and Sons; 1977. [Google Scholar]
- Domina T, Roksa J. Should mom go back to school? Post-natal educational attainment and parenting practices. Social Science Research. 2012;41:695–708. doi: 10.1016/j.ssresearch.2011.12.002. [DOI] [PubMed] [Google Scholar]
- Desai S, Waite L. Women’s employment during pregnancy and after the first birth: occupational characteristics and work commitment. American Sociological Review. 1991;56:551–566. [Google Scholar]
- Edin K, Kefalas M. Promises I can keep: Why poor women put motherhood before marriage. Berkeley, CA: University of California Press; 2005. [Google Scholar]
- Elder GH. The life course as developmental theory. Child Development. 1998;69:1–12. [PubMed] [Google Scholar]
- Furstenberg FF, Jr, Brooks-Gunn J, Morgan SP. Adolescent mothers and their children in later life. Family Planning Perspectives. 1987;19:142–151. [PubMed] [Google Scholar]
- Gerson K. Hard choices: How women decide about work, career, and motherhood. Berkeley and Los Angeles: University of California Press; 1985. [Google Scholar]
- Goldrick-Rab S, Sorensen K. Unmarried parents in college. The Future of Children. 2010;20:179–203. doi: 10.1353/foc.2010.0008. [DOI] [PubMed] [Google Scholar]
- Harding J. Increases in maternal education and children’s cognitive scores and behavioral problems. Developmental Psychology. 2015;51:583–599. doi: 10.1037/a0038920. [DOI] [PubMed] [Google Scholar]
- Hareven TK. The history of the family and the complexity of social change. The American Historical Review. 1991;96:95–124. [Google Scholar]
- Hofferth SL, Reid L, Mott F. The effects of early childbearing on schooling over time. Family Planning Perspectives. 2001;33:259–267. [PubMed] [Google Scholar]
- Hopkins K. US News and World Report. 2011. Mar 23, Child-family college programs for parents. [Google Scholar]
- Institute for Women’s Policy Research. IWPR #C424. Washington, DC: 2014. 4.8 million college students are raising children. [Google Scholar]
- Jacobs JA, King RK. Age and college completion: A life-history analysis of women aged 15–44. Sociology of Education. 2002;75:211–230. [Google Scholar]
- Katz Sheila. Just give us a chance to get an education:’ CalWORKs mothers’ survival narratives and strategies. Journal of Poverty. 2013;17:273–304. [Google Scholar]
- Kearney MS, Levine PB. Income inequality and early nonmarital childbearing. Journal of Human Resources. 2014;49:1–31. [Google Scholar]
- Lucas SR. New directions in education transitions research: An introduction. Research in Social Stratification and Mobility. 2010;28:1–2. [Google Scholar]
- MacGregor CA. Fragile Families Working Paper. 2010. Education delayed: Family structure and postnatal educational attainment. 09-07-FF. [Google Scholar]
- Magnuson K. Maternal education and children’s academic achievement during middle childhood. Developmental Psychology. 2007;43:1497–1512. doi: 10.1037/0012-1649.43.6.1497. [DOI] [PubMed] [Google Scholar]
- Magnuson K, Sexton H, Davis-Kean P, Huston A. The Effects of Increases in Maternal Education on Young Children’s Language Skills. Merrill Palmer Quarterly. 2009;55:319–349. [Google Scholar]
- Marini M. The order of events in the transition to adulthood. Social Forces. 1984a;63:229–244. [Google Scholar]
- Marini MM. Women’s educational attainment and the timing of entry into parenthood. American Sociological Review. 1984b;49:491–511. [Google Scholar]
- Milesi C. Do all roads lead to Rome? Effect of educational trajectories on educational transitions. Research in Social Stratification and Mobility. 2010;28:23–44. [Google Scholar]
- Moen P, Wethington E. The concept of family adaptive strategies. Annual Review of Sociology. 1992:233–251. [Google Scholar]
- Mott FL, Marsiglio W. Early childbearing and completion of high school. Family Planning Perspectives. 1985;17:234–237. [PubMed] [Google Scholar]
- National Center for Education Statistics. Trends in attainment among student populations at increased risk of noncompletion: Selected years, 1989–1990 to 2008–2009) U.S. Department of Education; 2011. [Google Scholar]
- Perna LW, Fester R, Walsh E. Exploring the College Enrollment of Parents: A Descriptive Analysis. Journal of Student Financial Aid. 2010;40:6–16. [Google Scholar]
- Raley R, Kim Y, Daniels K. Young adults’ fertility expectations and events: Associations with college enrollment and persistence. Journal of Marriage and Family. 2012;74:866–879. doi: 10.1111/j.1741-3737.2012.00990.x. [DOI] [PMC free article] [PubMed] [Google Scholar]
- Rich LM, Kim S. Patterns of later life education among teenage mothers. Gender and Society. 1999;13:789–817. [Google Scholar]
- Rosenberg M. Society and the adolescent self-image. Princeton, NJ: Princeton University Press; 1965. [Google Scholar]
- Royston P. Multiple imputation of missing values. Stata Journal. 2004;4:227–241. [Google Scholar]
- Rumberger RW, Lamb SP. The early employment and further educational experiences of high school dropouts: A comparative study of the United States and Australia. Economics of Education Review. 2003;22:353–366. [Google Scholar]
- Sewell WH, Haller AO, Portes A. The educational and early occupational attainment process. American Sociological Review. 1969;34:82–92. [Google Scholar]
- Sharma R. Recession brings mothers back to school. Medill Reports. 2010 Mar 2; [Google Scholar]
- Singer JD, Willett JB. Applied longitudinal data analysis: Methods for studying change and event occurrence. New York: Oxford University Press; 2003. [Google Scholar]
- Skirbekk V, Kohler H, Prskawetz A. Birth month, school graduation, and the timing of births and marriages. Demography. 2004;41:547–568. doi: 10.1353/dem.2004.0028. [DOI] [PubMed] [Google Scholar]
- Strange K. A longitudinal analysis of the relationship between fertility timing and schooling. Demography. 2011;48:931–956. doi: 10.1007/s13524-011-0050-3. [DOI] [PubMed] [Google Scholar]
- St Rose A, Hill C. Women in community colleges: access to success. American Association of University Women; Washington, DC: 2013. [Google Scholar]
- Taniguichi H, Kaufman G. Belated entry: Gender differences and similarities in the pattern of nontraditional college enrollment. Social Science Research. 2006;36:550–568. [Google Scholar]
- Upchurch DM, McCarthy J. The timing of a first birth and high school completion. American Sociological Review. 1990;55:224–234. [Google Scholar]
- Bureau of Labor Statistics. Working in the 21st century. 2014 http://www.bls.gov/opub/working/home.htm.
- Ventura SJ. NCHS Data Brief 18. Department of Health and Human Services; 2009. Changing patterns of nonmarital fertility in the United States. [PubMed] [Google Scholar]
- Wolter K. Information collection request for the National Longitudinal Survey of Youth 1979, OMB # 1220–0109. Bureau of Labor Statistics; 2010. [Google Scholar]
- Women Employed. Single mothers and paths of success: Creating Paths out of Poverty. 2001 http://www.swd.ucla.edu/documents/SingleMothers.pdf.