

Abstract
Small cell lung cancer (SCLC) is a highly aggressive and metastatic malignancy that shows rapid development of chemoresistance and a high rate of recurrence. Recent genome and transcriptome studies have provided the whole landscape of genomic alterations and gene expression changes in SCLC. In light of the inter‐individual heterogeneity of SCLC, subtyping of SCLC might be helpful for prediction of therapeutic response and prognosis. Based on the transcriptome data of SCLC cell lines, we undertook transcriptional network‐defined SCLC classification and identified a unique SCLC subgroup characterized by relatively high expression of Hippo pathway regulators Yes‐associated protein (YAP) and transcriptional coactivator with PDZ‐binding motif (TAZ) (YAP/TAZ subgroup). The YAP/TAZ subgroup displayed adherent cell morphology, lower expression of achaete‐scute complex homolog 1 (ASCL1) and neuroendocrine markers, and higher expression of laminin and integrin. YAP knockdown caused cell morphological alteration reminiscent of floating growth pattern in many SCLC cell lines, and microarray analyses revealed a subset of genes regulated by YAP, including Ajuba LIM protein (AJUBA). AJUBA also contributed to cell morphology regulation. Of clinical importance, SCLC cell lines of the YAP/TAZ subgroup showed unique patterns of drug sensitivity. Our findings shed light on a subtype of SCLC with YAP and TAZ expression, and delineate molecular networks underlying the heterogeneity of SCLC.
Keywords: AJUBA, morphology, SCLC, TAZ, YAP
Lung cancer is the leading cause of cancer‐related death worldwide, and small cell lung cancer (SCLC) is an aggressive and highly metastatic subtype that accounts for approximately 15% of lung cancers.1, 2
SCLC is primarily defined by light microscopy, and morphological characteristics of SCLC include small cell size, scant cytoplasm, ill‐defined cell borders, finely granular nuclear chromatin, nuclear molding, absent or inconspicuous nucleoli, extensive necrosis, and a high mitotic rate.3 SCLC is categorized as a subtype of neuroendocrine (NE) tumor, but immunohistochemistry for NE markers such as NCAM1, CHGA, and SYP has not been mandatory for the diagnosis.4, 5 Indeed, it has been described that all NE markers might be negative in a subset of morphologically diagnosed SCLC.6
Several cancer genome projects have analyzed cohorts of SCLC patients and revealed genomic alterations, copy number aberrations, and transcriptome changes in SCLC.7, 8 Frequent inactivation of TP53 and RB1, and amplification of the MYC family genes have been confirmed in accordance with previous reports.9 Most recently, The Cancer Genome Atlas has described the comprehensive genomic landscape of SCLC in a large cohort.10 These studies not only elucidated the oncogenic mechanisms of SCLC but also shed light on previously unappreciated heterogeneity in gene expression profiles. In parallel with studies on cancer tissue samples, several projects of comprehensive genome and transcriptome analyses on hundreds of established cancer cell lines have been recently completed, including the Cancer Cell Line Encyclopedia (CCLE), which provide valuable research resources for cancer cell biology.11, 12
Achaete‐scute complex homolog 1 (ASCL1) is a basic helix–loop–helix family transcription factor essential for NE differentiation and SCLC formation.13, 14, 15, 16, 17 Insulinoma‐associated 1 (INSM1) is a zinc‐finger transcription factor that also plays important roles in NE marker expression and SCLC tumorigenesis.18, 19
Yes‐associated protein (YAP) and transcriptional coactivator with PDZ‐binding motif (TAZ, also known as WWTR1) are the core downstream effectors of the Hippo pathway that is involved in diverse biological processes.20 After nuclear translocation, YAP and TAZ cooperate mainly with the TEAD family transcription factors to transactivate genes that regulate cell proliferation, differentiation, and apoptosis.21 YAP participates in lung branching morphogenesis and epithelial regeneration, whereas TAZ is important for lung alveolarization.22, 23 Furthermore, oncogenic action of YAP and TAZ in non‐small cell lung cancer (NSCLC) has been recently reported.24 However, in SCLC, the roles of YAP and TAZ have been scantly investigated.25
As a consequence of genomic alterations and gene mutations in cancer cells, aberrant patterns of gene expression profiles occur, which eventually determine cancer cell behaviors. In the present study, through analyses on publicly available transcriptome data of SCLC cell lines, we found that YAP and TAZ are expressed in a subset of SCLC characterized by low transcript levels of ASCL1 and NE markers. Our findings delineate a distinct subgroup of SCLC cells characterized by YAP and TAZ expression, and shed light on the molecular mechanisms underlying the heterogeneity of SCLC.
Materials and Methods
Transcriptome data of SCLC cell lines and SCLC tissues
Transcriptome data of SCLC cell lines were from the GSE36139 microarray dataset provided by CCLE (n = 51), and E‐MTAB‐2706 RNAseq dataset (n = 30).11, 12 Transcriptome data of SCLC tissue samples were from the GSE30219 (n = 21) and GSE62021 (n = 25) microarray datasets, and GSE60052 RNAseq dataset (n = 79).26, 27, 28 A list of human transcription factors was previously described by the FANTOM5 project (http://fantom.gsc.riken.jp/5). Significance Analysis of Microarrays was used for statistical analyses of differentially expressed genes.
Characteristics of SCLC cell lines
Information on cell morphology of SCLC cell lines was retrieved from ATCC (http://www.atcc.org), JCRB (http://cellbank.nibiohn.go.jp), DS Pharma Biomedical (http://www.saibou.jp), Common Access to Biological Resources and Information (http://www.cabri.org), DSMZ (https://www.dsmz.de), and the Cell Line Knowledge Base. Cell morphology was categorized into three subtypes: suspension culture with floating aggregates, adherent cells, and mixtures of adherent, loosely adherent, and floating cells (mixed morphology).29 Cell origin and mutation status (TP53, RB1, KRAS, EGFR) were surveyed in the CCLE (http://www.broadinstitute.org/ccle) and COSMIC (http://cancer.sanger.ac.uk/cosmic) databases.30 Cell characteristics are summarized in Table S1.
Cell cultures
BEAS‐2B (immortalized bronchial epithelial cells), A549 and NCI‐H441 lung adenocarcinoma cells, and NCI‐H209 SCLC cells were purchased from ATCC (Rockville, MD, USA). Lu134A, Lu134B, and Lu139 SCLC cells were obtained from RIKEN BRC (Tsukuba, Japan). SBC3 and SBC5 cells were from JCRB (Osaka, Japan). Normal human bronchial epithelial cells and small airway epithelial cells were from Takara Bio (Tokyo, Japan) and Lonza (Basel, Switzerland), respectively. Cell circularity was quantified using Image J software (NIH, Bethesda, MD, USA).
Small interfering RNA experiment
Small interfering RNA against human YAP (siYAP #1, HSS115942; #2, HSS115944; #3, HSS173621) and AJUBA (siAJUBA #1, HSS150205; #2, HSS189297), and the negative control (siNC) were purchased from Invitrogen (Life Technologies, Carlsbad, CA, USA). SBC3 and SBC5 cells were transfected with 20 nM siRNA using Lipofectamine RNAiMAX (Invitrogen) according to the manufacturer's instructions.
Quantitative RT‐PCR
The detailed procedures were described previously.31 The expression levels were normalized to that of GAPDH. The PCR primers are listed in Table S2.
Immunoblot analysis
The detailed procedures were described previously.31 Rabbit monoclonal anti‐YAP/TAZ (D24/E4), rabbit polyclonal anti‐phospho‐YAP (Ser127), and rabbit polyclonal anti‐AJUBA antibodies were purchased from Cell Signaling Technology (Danvers, MA, USA). Mouse mAb for α‐tubulin was from Sigma‐Aldrich (St. Louis, MO, USA). The corresponding HRP‐conjugated secondary antibodies were used.
Immunofluorescence
Rabbit monoclonal anti‐YAP (EP1674Y) antibody was purchased from Abcam (Cambridge, UK). SBC3 and SBC5 cells were fixed with acetone and methanol, and blocked with 5% normal goat serum in PBS for 1 h. The cells were incubated with anti‐YAP (1:100) at 4°C overnight, and then incubated for 1 h with goat anti‐rabbit Alexa Fluor 594‐conjugated antibody (Life Technologies). Nuclei were stained with DAPI.
Gene expression profiling in SBC3 and SBC5 cells
Total RNA was extracted from SBC3 and SBC5 cells 48 h after siNC or siYAP transfection, using the RNeasy Mini Kit (Qiagen, Hilden, Germany). Microarray analysis was carried out using the Affymetrix GeneChip Human Genome U133 Plus 2.0 array (Santa Clara, CA, USA). Expression values less than that of the negative control probe were filtered out. Gene ontology (GO) analysis and KEGG pathway analysis was carried out as described previously.24
Statistical analysis
Spearman's correlation coefficient (ρ) and Pearson's correlation coefficient (r) were calculated for correlation analysis. The differences were examined by Student's t‐test, or anova with Tukey's post hoc test with JMP version 9.0.3 (SAS Institute, Cary, NC, USA).
Results
Subtypes of SCLC cell lines defined by gene expression profiles
Heterogeneity of SCLC cell lines in terms of gene expression profiling has been previously described.32 In addition, distinct subtypes of SCLC cell lines defined by differential expression levels of basic helix–loop–helix family transcription factors, ASCL1 and NEUROD1, have been proposed.33 We hypothesized that the heterogeneity of SCLC cell lines might be attributable to differential expression patterns of key transcription factors. Using publicly available transcriptome datasets of cancer cell lines,11, 12 we aimed to subclassify SCLC cell lines based on the expression profiles of transcription factors.
Transcription factor‐defined clustering analysis of SCLC cell lines registered in the CCLE microarray database (n = 51) yielded five major clusters (Fig. 1a, left panel). Among 1520 transcription factors, ASCL1 showed the highest standard deviation, followed by ISL1, MYC, INSM1, and NEUROD1 (Table S3A). Both ASCL1 and INSM1 are core regulators of NE differentiation, whereas ASCL1 and NEUROD1 are key transcription factors involved in early and late neurogenic differentiation, respectively. Among five clusters, ASCL1 in clusters 4 and 5 (57%, n = 29) and NEUROD1 in cluster 3 (20%, n = 10) showed relatively high expression levels compared to the other clusters. In contrast, cluster 1 (16%, n = 8) displayed low expression levels of ASCL1, ISL1, INSM1, and NEUROD1. In accordance, NE markers such as DLK1, GRP, NCAM1, SYP, and CHGA showed lower transcript levels in cluster 1 (Fig. 1b, left panel). In line with these findings, principal component analysis clearly separated these subgroups (Fig. 1c).
Figure 1.

Subtypes of SCLC cell lines defined by expression patterns of transcription factors. (a) Hierarchical clustering of expression levels of 1520 transcription factors in SCLC cell lines. Red to blue color gradient in the correlation matrix indicates higher correlation. Blue, suspension; red, adherent and mixed. Left, CCLE dataset (n = 51). Right, E‐MTAB‐2706 dataset (n = 30). (b) Heatmap of expression levels of 18 genes. YAP1 (YAP), WWTR1 (TAZ), selected transcription factors (TEAD4, ASCL1, INSM1, NEUROD1, ISL1, ST18, HES1, FOXA2, NKX2‐1, MYC, MYCL), and neuroendocrine markers (DLK1, GRP, NCAM1, SYP, CHGA). Left: CCLE dataset (n = 51). Right, E‐MTAB‐2706 dataset (n = 30). (c) Principal component analysis of 1520 transcription factors in the CCLE dataset (n = 51). (d) Kyoto Encyclopedia of Genes and Genomes (KEGG) pathway analysis of the top 150 genes enriched in cluster 1 of the CCLE dataset (n = 8). The predicted pathways are presented in the order of −log2(P‐value).
To confirm these findings, we next studied the E‐MTAB‐2706 dataset of SCLC cell lines analyzed by RNAseq (n = 30). Clustering analysis on the expression profiles of transcription factors resulted in three major clusters (Fig. 1a, right panel). ASCL1 in cluster 3 (60%, n = 18), and NEUROD1 in cluster 1 (27%, n = 8) showed relatively high expression levels compared to the other clusters. Similar to cluster 1 in the CCLE dataset, cluster 2 in the E‐MTAB‐2706 dataset (13%, n = 4) displayed low expression levels of ASCL1, ISL1, INSM1, NEUROD1, and NE markers (Fig. 1B, right panel).
Expression of YAP and TAZ in a subset of SCLC cell lines
Important roles of ASCL1, INSM1, and NEUROD1 in SCLC have been previously reported.15, 16, 18, 34 To explore a novel mechanism, we examined the SCLC cell lines with low expression levels of ASCL1, ISL1, INSM1, NEUROD1, and NE markers. We compared the gene expression profiles of cluster 1 in the CCLE dataset with other clusters, and obtained a list of genes with differential expression (Table S3B). In cluster 1, INSM1 and ASCL1 were listed as the top and fourth lowest genes, and we found that YAP is the seventh highest gene. Furthermore, we found several target genes of YAP and TAZ reported in previous research among the highly expressed genes in cluster 1 such as CYR61 and CTGF.35, 36 In agreement, KEGG pathway analysis of the top 150 genes enriched in cluster 1 revealed that Hippo signaling was the most relevant to the gene signature in cluster 1 (Fig. 1d). Importantly, transcription factors enriched in cluster 1 included TEAD4, which largely mediates the action of YAP and TAZ (Table S3B, Fig. 1b, left panel).
We further analyzed the transcriptome data of 30 SCLC cell lines in the E‐MTAB‐2706 dataset, and relatively high expression of YAP and/or TAZ was noted in cluster 2 with low expression of ASCL1, ISL1, INSM1, NEUROD1, and NE markers (Fig. 1b, right panel). These findings revealed a novel subtype of SCLC cells characterized by poor NE differentiation and high expression of YAP and TAZ.
Expression of YAP and TAZ in a subset of SCLC tissues
Heterogeneity of SCLC tissues has been documented in terms of the fraction of cells with small‐cell morphology. To assess expression levels of YAP and TAZ in association with ASCL1, both in SCLC and NSCLC, we surveyed the GSE30219 microarray dataset which analyzed 293 lung cancers of various histologies (Fig. S1a).
Relatively high expression of ASCL1 was observed in 21% (n = 18/85) of adenocarcinoma, 55% (n = 31/56) of large cell neuroendocrine carcinoma (LCNEC), and 0% (n = 0/61) of squamous cell carcinoma. Of note, 76% (n = 16/21) of SCLC showed high ASCL1 expression, whereas the rest of SCLC (24%, n = 5/21) showed low expression levels of ASCL1. High expression of YAP and TAZ was observed in all adenocarcinomas (n = 85/85) and squamous cell carcinomas (n = 61/61). In contrast, variable but generally low levels of YAP and TAZ expression were found in LCNEC and SCLC. The expression levels of ASCL1, YAP, and TAZ were further compared in each case of SCLC, and we found a trend that SCLC with low ASCL1 transcript levels showed higher YAP and TAZ expression (Fig. S1b). Correlation analysis further confirmed that ASCL1 expression is negatively correlated with YAP and TAZ both in LCNEC and SCLC (Fig. S1c). These observations were in support of our findings in SCLC cell lines, and suggested the presence of a subtype of SCLC with low ASCL1 and relatively high YAP and TAZ expression (YAP/TAZ subgroup).
Expression of YAP and TAZ in SCLC cell lines with adherent and mixed cell morphology
Heterogeneity of SCLC cell lines in terms of cell morphology has been previously documented.29 We surveyed cell morphological features of 51 SCLC cell lines in the CCLE dataset referring to public databases. We noted that 14 cell lines (27%) show adherent cell morphology and grow as monolayers, whereas 31 cell lines (61%) are cultured in suspension as floating cell aggregates. Cell morphology of 6 cell lines (12%) are described as mixtures of adherent, loosely adherent, and floating cells (hereafter referred to as mixed morphology). We next examined the gene expression profiles in association with cell morphological differences in SCLC cell lines. We compared the cell lines that show adherent and mixed morphology (n = 20) with those cultured in suspension (n = 31). Intriguingly, YAP, TAZ, and their target genes CTGF and CYR61 were among the top 50 genes differentially expressed in SCLC cell lines with adherent and mixed cell morphology (Table S3C).
We also compared expression levels of YAP, TAZ, and ASCL1 in SCLC cell lines with adherent and mixed morphology (39%, n = 20/51) to those cultured in suspension (61%, n = 31/51), and found that YAP and TAZ are highly expressed in the former group of SCLC cell lines (Fig. 2a). In contrast, ASCL1 expression levels did not show significant differences between both groups. We obtained similar results in the E‐MTAB‐2706 dataset, by comparing SCLC cell lines with adherent and mixed morphology (40%, n = 12/30) to those cultured in suspension (60%, n = 18/30) (Fig. 2a).
Figure 2.
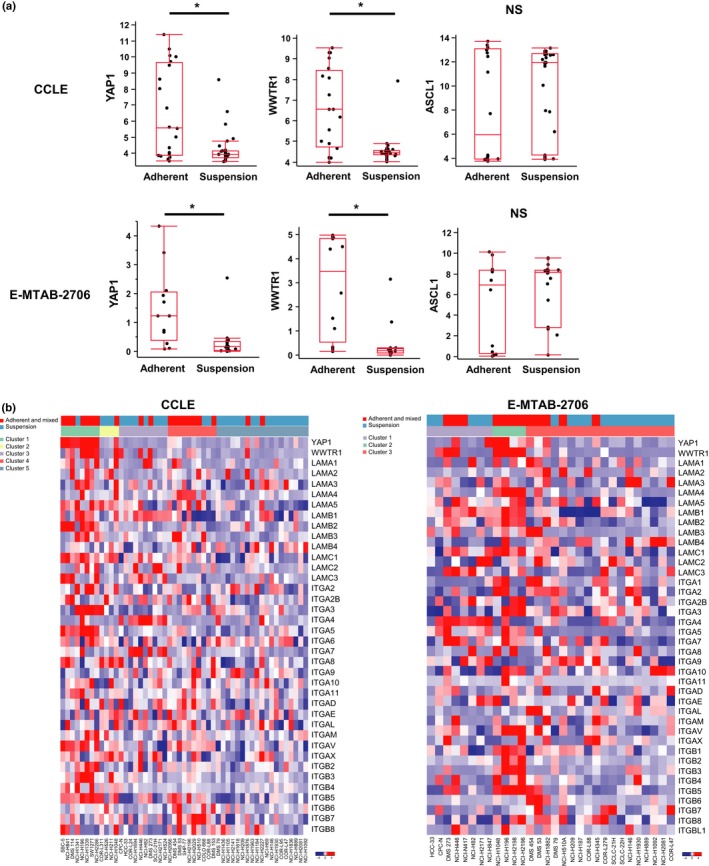
YAP and TAZ expression in SCLC cell lines with adherent and mixed cell morphology. (a) Box plots showing the expression levels of YAP1 (YAP), WWTR1 (TAZ), and ASCL1 in SCLC cell lines cultured in suspension and those with adherent and mixed cell morphology. Upper panels, CCLE (n = 51). Y‐axis represents the normalized value. Lower panels, E‐MTAB‐2706 (n = 30). Y‐axis represents the value of log2(1 + RPKM). *P < 0.05, Student's t‐test. NS, not significant. (b) Heatmap of relative expression levels of YAP1, WWTR1, and genes encoding integrin and laminin subunits. Left panel, CCLE (n = 51). Right panel, E‐MTAB‐2706 (n = 30).
Molecular mechanisms underlying the differences between cell aggregation and substrate adhesion have not been well established. A previous report has shown that cell morphological transition from floating aggregates to adherent monolayers is concomitant with altered expression patterns of integrins.37 It has been also reported that laminin induces the attachment of SCLC cells cultured in suspension.38 Based on these reports, we compared transcript levels of YAP, TAZ, and genes that encode integrin and laminin subunits in SCLC cell lines of the CCLE and E‐MTAB‐2706 datasets. As anticipated, SCLC cell lines with adherent and mixed morphology showed higher expression of integrin and laminin genes, supporting the notion that adherent cell morphology is associated with laminin substrates and integrin‐mediated cell attachment (Fig. 2b). It was also noteworthy that vimentin was highly expressed while the expression of E‐cadherin was low in SCLC cell lines with adherent and mixed morphology, suggesting a mechanism associated with epithelial–mesenchymal transition (Table S3C).
YAP is expressed in a subset of SCLC cell lines with adherent cell morphology
In order to confirm the above finding, we cultured six different SCLC cell lines (NCI‐H209, Lu134A, Lu134B, Lu139, SBC3, and SBC5) and compared cell morphology. While NCI‐H209, Lu134A, Lu134B and Lu139 cells were cultured in suspension as floating aggregates, SBC3 and SBC5 cells displayed adherent cell morphology (Fig. 3a).
Figure 3.

YAP and TAZ expression in SCLC cell lines. (a) Phase contrast microscopy of SCLC cell lines (NCI‐H209, Lu134A, Lu134B, Lu139, SBC3, and SBC5). Scale bar = 100 μm. (b) Immunoblotting for YAP and TAZ in SCLC cell lines (NCI‐H209, Lu134A, Lu134B, Lu139, SBC3, and SBC5), NSCLC cell lines (A549 and NCI‐H441), and lung epithelial cells (small airway epithelial cells [SAEC], normal human bronchial epithelial [NHBE] cells, and BEAS‐2B immortalized bronchial epithelial cells). α‐Tubulin was detected as the loading control. (c) Immunocytochemistry for YAP in SBC5 and SBC3 cells. Red, anti‐YAP antibody; blue, DAPI. Scale bar = 100 μm.
In accordance with cell morphological differences, cell lines cultured in suspension lacked the expression of either YAP or TAZ as determined by immunoblotting (Fig. 3b). Meanwhile, YAP was expressed both in SBC3 and SBC5 cells. SBC3 cells also expressed TAZ, and its expression level was much higher than in lung epithelial cells (small airway epithelial cells, normal human bronchial epithelial cells, and BEAS‐2B) and NSCLC cell lines (A549 and NCI‐H441). We also undertook quantitative RT‐PCR for YAP and TAZ in these cell lines, and confirmed high expression of YAP in SBC3 and SBC5 cells (Fig. S2). Of note, A549 lung adenocarcinoma cells showed low expression levels of YAP, which was consistent with a previous report.39
Expression of YAP at protein level was also confirmed by immunocytochemistry both in SBC3 and SBC5 cells (Fig. 3c). Nuclear localization of YAP was observed in most cultured cells, suggesting that YAP is constitutively activated to participate in transcriptional regulation in the nucleus.
Knockdown of YAP causes cell morphological change
In the following experiments, we explored the functional significance of YAP expression in SCLC cells (SBC3 and SBC5) and studied the effects of YAP knockdown. Three different siRNAs for YAP clearly abolished YAP expression at protein level both in SBC3 and SBC5 cells, whereas TAZ expression was sustained in SBC3 cells (Fig. 4a). Intriguingly, SBC5 cells with YAP knockdown cultured on tissue culture dishes showed cell phenotypic change from a spindle‐like or elongated shape to more round cell morphology (Fig. 4b). Quantification of cell circularity further confirmed this effect and suggested that YAP is involved in cell morphological alteration (Fig. 4c).
Figure 4.

YAP knockdown causes cell morphological change. (a) Immunoblotting for YAP/TAZ in SBC5 and SBC3 cells treated with negative control (siNC) or siYAP. (b) Phase contrast microscopy of SBC5 cells treated with siNC or siYAP. Scale bar = 100 μm. (c) Box plots showing the circularity of SBC5 cells treated with siNC or siYAP. *P < 0.05 by anova with Tukey's post hoc test.
Gene expression profiling reveals YAP‐regulated genes in SCLC cell lines
To detect gene signatures regulated by YAP in SCLC cell lines, microarray analyses in SBC3 and SBC5 cells with or without YAP knockdown were carried out (Table S4A,B). We further carried out GO analyses of the genes downregulated by YAP knockdown (Table S4C, D). In SBC5 cells, enrichment of GO terms associated with cell morphology, such as “cytoskeleton organization”, “regulation of cell motion”, and “regulation of cell size” was found (Table S4D). The expression levels of integrins, laminins, and epithelial–mesenchymal transition markers (E‐cadherin and vimentin) were not remarkably altered by YAP knockdown, and thus they did not seem to be direct targets of YAP in SBC5 cells.
Both in SBC3 and SBC5 cells, 79 genes were upregulated (>2.0‐fold), and 138 genes were downregulated (<0.5‐fold) (Fig. 5a, left and middle). Among the commonly downregulated genes, AMOTL2 and AJUBA (also known as JUB) were validated by quantitative RT‐PCR, which indicated the reliability of microarray results (Fig. 5b). Decreased expression of AJUBA following YAP knockdown was further confirmed by immunoblotting (Fig. 5c). Next, we compared the 138 genes to the top 100 genes highly coexpressed with YAP in SCLC cell lines of the CCLE dataset (Table S3D). Consequently we identified four genes (AJUBA, MSRB3, ARL2BP, and GPX8) whose expression levels are closely associated with YAP in SCLC cell lines (Fig. 5a, right panel). AJUBA has been recently reported as a target of YAP that mediates its action in human bronchial epithelial cells,40 and our observations suggested that such signaling might be also active in SCLC.
Figure 5.

YAP‐regulated genes in SCLC cell lines. (a) Venn diagram showing overlaps of downregulated (left) or upregulated (middle) genes following YAP knockdown in SBC5 and SBC3 cells. Four commonly downregulated genes (AJUBA,ARL2BP,GPX8, and MSRB3) showed coexpression with YAP in the CCLE dataset (right). (b) Quantitative RT‐PCR for AMOTL2 and AJUBA in SBC5 and SBC3 cells treated with negative control (siNC) or siYAP. The expression level was normalized to GAPDH. Error bars represent standard errors. (c) Immunoblotting for AJUBA in SBC5 and SBC3 cells treated with siNC or siYAP.
As the prognostic impact of AJUBA has been recently suggested in SCLC,41 we next assessed the expression of AJUBA in publicly available datasets of SCLC tissues (Fig. S3). In three different datasets, expression levels of YAP and AJUBA showed positive correlation, supporting the notion that AJUBA is regulated by YAP in SCLC tissues, as observed in SCLC cell lines.
Knockdown of AJUBA causes cell morphological change
Given that AJUBA was a robust target of YAP in SCLC cell lines, we explored the effect of AJUBA knockdown. Two different siRNAs for AJUBA decreased AJUBA expression at protein level in SBC5 cells (Fig. 6a). As AJUBA has been also suggested as an upstream regulator of YAP,42, 43 we investigated whether YAP phosphorylation and expression could be altered following AJUBA silencing (Fig. S4). In line with previous studies, AJUBA knockdown resulted in decreased expression of both total and phosphorylated YAP in SBC5 cells. These findings suggested that YAP and AJUBA might form a reciprocal positive regulatory loop in SCLC.
Figure 6.
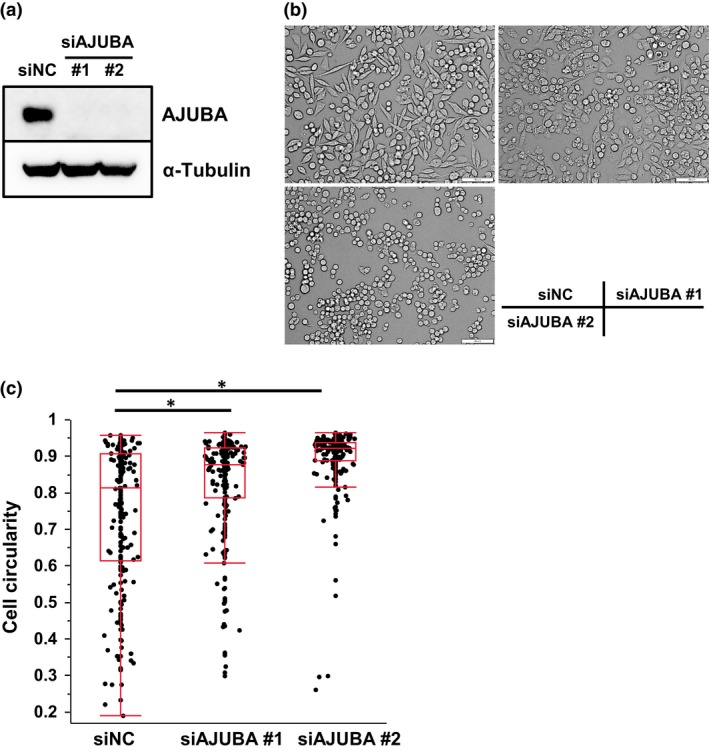
Knockdown of AJUBA causes morphological change in SCLC cells. (a) Immunoblotting for AJUBA in SBC5 cells treated with negative control (siNC) or siAJUBA. (b) Phase contrast microscopy of SBC5 cells treated with siNC or siAJUBA. Scale bar = 100 μm. (c) Box plots showing the circularity of SBC5 cells treated with siNC or siAJUBA. *P < 0.05 by anova with Tukey's post hoc test.
Similar to the effect caused by YAP knockdown, AJUBA knockdown resulted in cell morphological alteration (Figs 4b and 6b). Cell circularity of SBC5 cells was further quantified, which confirmed the effect of AJUBA knockdown on cell morphology (Fig. 6c).
SCLC cell lines of the YAP/TAZ subgroup are more sensitive to topotecan
In order to explore the clinical relevance of the above findings, we examined drug sensitivity to anticancer agents in SCLC. Most recently, large‐scale drug sensitivity data in SCLC cell lines have been published.44 Using this dataset, we comprehensively surveyed the drug sensitivity in 61 SCLC cell lines. The IC50 values to 526 anticancer agents were compared between YAP high and low, or TAZ high and low subgroups. Consequently, we discovered that SCLC cell lines of the YAP/TAZ subgroup are more sensitive to topotecan (Fig. 7a). This subset of SCLC cell lines also showed relatively higher sensitivity to mTOR and PLK inhibitors as compared to other SCLC cell lines with low YAP and TAZ expression (Fig. 7b, Table S5).
Figure 7.
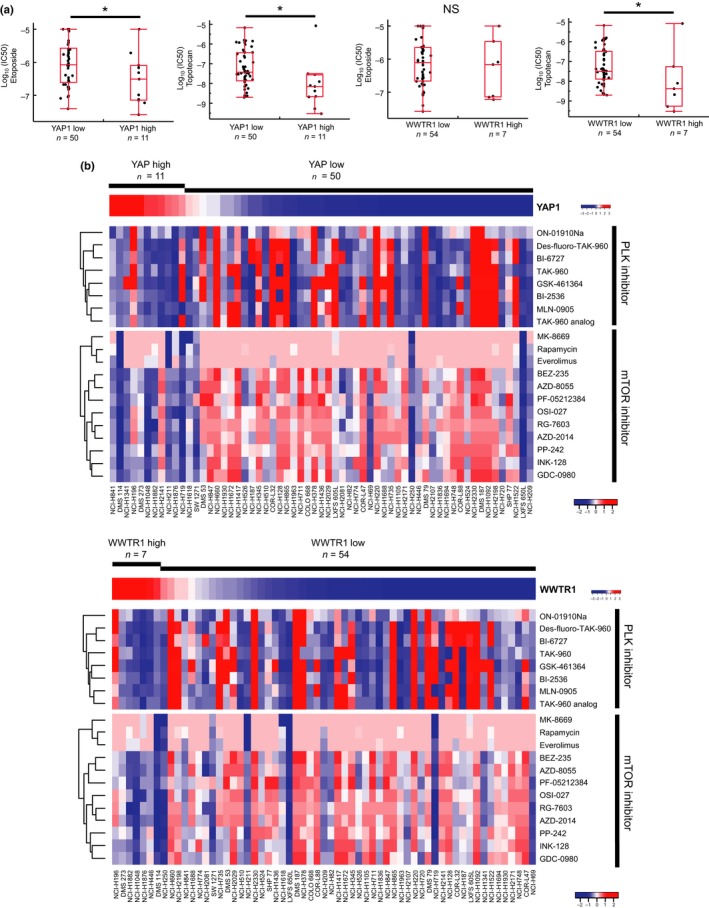
Drug sensitivity of SCLC cell lines. (a) Box plot showing the median and distribution of drug response of SCLC cell lines. The Y‐axis represents log10 (IC 50) values for etoposide and topotecan. *P < 0.05 by Student's t‐test. NS, not significant. (b) Heat map showing the IC 50 response for 12 mammalian target of rapamycin (mTOR) inhibitors and 8 polo‐like kinase (PLK) inhibitors in SCLC cell lines arranged by expression levels of YAP1 (YAP; upper panel) and WWTR1 (TAZ; lower panel).
Discussion
In the present study, we characterized a subgroup of SCLC with low ASCL1 expression and poor NE differentiation. SCLC cell lines of this subgroup showed relatively high YAP and TAZ expression and adherent cell morphology. Microarray analyses revealed genes regulated by YAP in SCLC cells, and among them, AJUBA has been implicated with YAP‐mediated phenotypic modulation.
SCLC is categorized as a subtype of NE tumor; however, its diagnosis relies on morphological findings without detection for NE markers by immunohistochemistry. The SCLC cell lines of the YAP/TAZ subgroup analyzed in this study constitute a variant subtype of SCLC and display atypical features compared to the classic subtype with NE differentiation. Thus, our findings need to be interpreted in light of the interindividual and intratumoral heterogeneity in SCLC.
Combined SCLC that contains any other NSCLC component has been recognized, which shows different levels of NE marker expression.6, 45 In a previous report, a subset of SCLC negative for NE markers was identified, by gene expression and immunohistochemistry analyses, that comprises 23% (n = 10/43) of SCLC cases.46 Most recently, transcriptome analyses on The Cancer Genome Atlas cohort of SCLC revealed that 23% (n = 16/69) of cases showed relatively low expression levels of ASCL1 and NE markers.10 Both ASCL1 expression and NE differentiation have also been recognized in LCNEC as well as a subset of lung adenocarcinoma (10–20%).47, 48 It is postulated that SCLC can originate both from NE and non‐NE precursor cells, based on the observations in murine models as well as clinical samples.49 Furthermore, many cases with transformation from NSCLC to SCLC have been reported as a mechanism for acquired drug resistance.50 The molecular mechanisms that determine the abovementioned histological subtypes (i.e., SCLC, NSCLC, combined SCLC, SCLC with poor NE differentiation, LCNEC, and adenocarcinoma with NE differentiation) need to be further delineated for precise diagnosis and patient management.
Variations of cell morphology in cultured SCLC cell lines have been previously reported.29 Classic SCLC cell lines tend to grow in suspension and form floating cell aggregates, whereas variant SCLC cell lines develop an adherent monolayer with epithelioid appearance. In the present study, gene expression profiles of SCLC cell lines with adherent cell morphology revealed high transcript levels of YAP and TAZ (Fig. 2a, Table S3C). We also showed that YAP knockdown induced cell phenotypic change to round cell morphology (Fig. 4). Taken together with the generally low expression of YAP and TAZ in many SCLC tissues (Fig. S1a), the small and round cell shape indicative of “small‐cell cancer” and loss of cell adhesion might be accompanied by decreased expression of YAP, TAZ, and AJUBA, as indicated in this study. Our findings suggest that such a mechanism might constitute part of the molecular networks underlying SCLC pathogenesis.
In a previous report, enrichment of ASCL1 and NE markers was revealed in a subgroup of SCLC with poor prognosis, whereas higher expression levels of YAP were described in another subgroup of SCLC with good prognosis.46 In addition, AJUBA repression showed strong correlation to shorter survival.41 Together with our findings, it is suggested that suppression of YAP and TAZ is associated with acquisition of the malignant phenotype in SCLC, which is in contrast with their oncogenic action in NSCLC.24 In hematological malignancies such as leukemia and multiple myeloma, a tumor‐suppressive role for YAP has been recently suggested.51 Similarities of pathological mechanisms between SCLC and hematological malignancies seem worthy of further investigation, in light of the unique role of YAP and TAZ.
Analysis of a large‐scale drug screening dataset showed that SCLC cell lines of the YAP/TAZ subgroup had higher sensitivity to the widely used anticancer agent for SCLC, topotecan. Furthermore, SCLC cell lines of this subgroup were more sensitive to mTOR and PLK inhibitors (Fig. 7). In a clinical setting, SCLC of the YAP/TAZ subgroup may be more responsive to chemotherapy or targeted therapies. In this regard, recognition of this subgroup would be of clinical importance from prognostic and therapeutic viewpoints.
Disclosure Statement
The authors have no conflict of interest.
Abbreviations
- ASCL1
achaete‐scute complex homolog 1
- CCLE
Cancer Cell Line Encyclopedia
- CHGA
chromogranin A
- GO
gene ontology
- INSM1
insulinoma‐associated 1
- KEGG
Kyoto Encyclopedia of Genes and Genomes
- LCNEC
large cell neuroendocrine carcinoma
- mTOR
mammalian target of rapamycin
- NCAM1
neural cell adhesion molecule 1
- NE
neuroendocrine
- NEUROD1
neuronal differentiation 1
- NSCLC
non‐small cell lung cancer
- PLK
polo‐like kinase
- RNAseq
RNA sequencing
- SCLC
small cell lung cancer
- siNC
negative control siRNA
- SYP
synaptophysin
- YAP
Yes‐associated protein
- TAZ
transcriptional coactivator with PDZ‐binding motif
Supporting information
Fig. S1. Inverse correlation between YAP1 (YAP), WWTR1 (TAZ), and ASCL1 expression.
Fig. S2. YAP and TAZ expression in SCLC cell lines.
Fig. S3. Positive correlation between YAP and AJUBA.
Fig. S4. Phosphorylation and expression of YAP following AJUBA knockdown in SBC5 cells.
Table S1. Characteristics of SCLC cell lines.
Table S2. PCR primers used in this study.
Table S3. Analyses of SCLC cell lines in the CCLE dataset.
Table S4. Microarray analysis.
Table S5. Expression of YAP1 (YAP) or WWTR1 (TAZ) and drug sensitivity (IC50) of SCLC cell lines.
Acknowledgments
This work was supported by the Japan Society for the Promotion of Science (KAKENHI) (grant numbers JP16K18437, JP26461185, JP15K15768, and JP16H02653), and a grant to the Respiratory Failure Research Group and Research on Allergic Disease and Immunology, Health and Labor Sciences Research Grants from the Ministry of Health, Labor and Welfare, Japan.
Cancer Sci 107 (2016) 1755–1766
Funding Information
This work was supported by JSPS KAKENHI, and Health and Labor Sciences Research Grants from the Ministry of Health, Labor and Welfare, Japan.
References
- 1. Devesa SS, Bray F, Vizcaino AP, Parkin DM. International lung cancer trends by histologic type: male:female differences diminishing and adenocarcinoma rates rising. Int J Cancer 2005; 117: 294–9. [DOI] [PubMed] [Google Scholar]
- 2. Byers LA, Rudin CM. Small cell lung cancer: where do we go from here? Cancer 2015; 121: 664–72. [DOI] [PMC free article] [PubMed] [Google Scholar]
- 3. Nicholson SA, Beasley MB, Brambilla E et al Small cell lung carcinoma (SCLC): a clinicopathologic study of 100 cases with surgical specimens. Am J Surg Pathol 2002; 26: 1184–97. [DOI] [PubMed] [Google Scholar]
- 4. Travis WD, Brambilla E, Muller‐Hermelink HK, Harris CC. World Health Organization Classification of Tumours, Pathology and Genetics: Tumours of the Lung, Pleura, Thymus and Heart. Lyon: IARC, 2004. [Google Scholar]
- 5. Travis WD, Brambilla E, Nicholson AG et al The 2015 World Health Organization classification of lung tumors: impact of genetic, clinical and radiologic advances since the 2004 classification. J Thorac Oncol 2015; 10: 1243–60. [DOI] [PubMed] [Google Scholar]
- 6. Travis WD. Update on small cell carcinoma and its differentiation from squamous cell carcinoma and other non‐small cell carcinomas. Mod Pathol 2012; 25(Suppl. 1): S18–30. [DOI] [PubMed] [Google Scholar]
- 7. Peifer M, Fernández‐Cuesta L, Sos ML et al Integrative genome analyses identify key somatic driver mutations of small‐cell lung cancer. Nat Genet 2012; 44: 1104–10. [DOI] [PMC free article] [PubMed] [Google Scholar]
- 8. Rudin CM, Durinck S, Stawiski EW et al Comprehensive genomic analysis identifies SOX2 as a frequently amplified gene in small‐cell lung cancer. Nat Genet 2012; 44: 1111–6. [DOI] [PMC free article] [PubMed] [Google Scholar]
- 9. Takahashi T, Nau MM, Chiba I et al p53: a frequent target for genetic abnormalities in lung cancer. Science 1989; 246: 491–4. [DOI] [PubMed] [Google Scholar]
- 10. George J, Lim JS, Jang SJ et al Comprehensive genomic profiles of small cell lung cancer. Nature 2015; 524: 47–53. [DOI] [PMC free article] [PubMed] [Google Scholar]
- 11. Barretina J, Caponigro G, Stransky N et al The cancer cell line encyclopedia enables predictive modelling of anticancer drug sensitivity. Nature 2012; 483: 603–7. [DOI] [PMC free article] [PubMed] [Google Scholar]
- 12. Klijn C, Durinck S, Stawiski EW et al A comprehensive transcriptional portrait of human cancer cell lines. Nat Biotechnol 2015; 33: 306–12. [DOI] [PubMed] [Google Scholar]
- 13. Borges M, Linnoila RI, van de Velde HJ et al An achaete‐scute homologue essential for neuroendocrine differentiation in the lung. Nature 1997; 386: 852–5. [DOI] [PubMed] [Google Scholar]
- 14. Linnoila RI, Zhao B, DeMayo JL et al Constitutive achaete‐scute homologue‐1 promotes airway dysplasia and lung neuroendocrine tumors in transgenic mice. Cancer Res 2000; 60: 4005–9. [PubMed] [Google Scholar]
- 15. Osada H, Tatematsu Y, Yatabe Y, Horio Y, Takahashi T. ASH1 gene is a specific therapeutic target for lung cancers with neuroendocrine features. Cancer Res 2005; 65: 10680–5. [DOI] [PubMed] [Google Scholar]
- 16. Osada H, Tomida S, Yatabe Y et al Roles of achaete‐scute homologue 1 in DKK1 and E‐cadherin repression and neuroendocrine differentiation in lung cancer. Cancer Res 2008; 68: 1647–55. [DOI] [PubMed] [Google Scholar]
- 17. Murai F, Koinuma D, Shinozaki‐Ushiku A, Fukayama M, Miyaozono K, Ehata S. EZH2 promotes progression of small cell lung cancer by suppressing the TGF‐β‐Smad‐ASCL1 pathway. Cell Discov 2015; 1: 15026. [DOI] [PMC free article] [PubMed] [Google Scholar]
- 18. Fujino K, Motooka Y, Hassan WA et al Insulinoma‐Associated Protein 1 Is a Crucial Regulator of Neuroendocrine Differentiation in Lung Cancer. Am J Pathol 2015; 185: 3164–77. [DOI] [PubMed] [Google Scholar]
- 19. Jia S, Wildner H, Birchmeier C. Insm1 controls the differentiation of pulmonary neuroendocrine cells by repressing Hes1. Dev Biol 2015; 408: 90–8. [DOI] [PubMed] [Google Scholar]
- 20. Yu FX, Zhao B, Guan KL. Hippo pathway in organ size control, tissue homeostasis, and cancer. Cell 2015; 163: 811–28. [DOI] [PMC free article] [PubMed] [Google Scholar]
- 21. Saito A, Nagase T. Hippo and TGF‐β interplay in the lung field. Am J Physiol Lung Cell Mol Physiol 2015; 309: L756–67. [DOI] [PubMed] [Google Scholar]
- 22. Mahoney JE, Mori M, Szymaniak AD, Varelas X, Cardoso WV. The hippo pathway effector Yap controls patterning and differentiation of airway epithelial progenitors. Dev Cell 2014; 30: 137–50. [DOI] [PMC free article] [PubMed] [Google Scholar]
- 23. Mitani A, Nagase T, Fukuchi K, Aburatani H, Makita R, Kurihara H. Transcriptional coactivator with PDZ‐binding motif is essential for normal alveolarization in mice. Am J Respir Crit Care Med 2009; 180: 326–38. [DOI] [PubMed] [Google Scholar]
- 24. Noguchi S, Saito A, Horie M et al An integrative analysis of the tumorigenic role of TAZ in human non‐small cell lung cancer. Clin Cancer Res 2014; 20: 4660–72. [DOI] [PubMed] [Google Scholar]
- 25. Nishikawa E, Osada H, Okazaki Y et al miR‐375 is activated by ASH1 and inhibits YAP1 in a lineage‐dependent manner in lung cancer. Cancer Res 2011; 71: 6165–73. [DOI] [PubMed] [Google Scholar]
- 26. Rousseaux S, Debernardi A, Jacquiau B et al Ectopic activation of germline and placental genes identifies aggressive metastasis‐prone lung cancers. Sci Transl Med 2013; 5: 186ra66. [DOI] [PMC free article] [PubMed] [Google Scholar]
- 27. Saito Y, Nagae G, Motoi N et al Prognostic significance of CpG island methylator phenotype in surgically resected small cell lung carcinoma. Cancer Sci 2016; 107: 320–5. [DOI] [PMC free article] [PubMed] [Google Scholar]
- 28. Jiang L, Huang J, Higgs BW et al Genomic landscape survey identifies SRSF1 as a key oncodriver in small cell lung cancer. PLoS Genet 2016; 12: e1005895. [DOI] [PMC free article] [PubMed] [Google Scholar]
- 29. Carney DN, Gazdar AF, Bepler G et al Establishment and identification of small cell lung cancer cell lines having classic and variant features. Cancer Res 1985; 45: 2913–23. [PubMed] [Google Scholar]
- 30. Forbes SA, Bindal N, Bamford S et al COSMIC: mining complete cancer genomes in the catalogue of somatic mutations in cancer. Nucleic Acids Res 2011; 39: D945–50. [DOI] [PMC free article] [PubMed] [Google Scholar]
- 31. Horie M, Saito A, Mikami Y et al Characterization of human lung cancer‐associated fibroblasts in three‐dimensional in vitro co‐culture model. Biochem Biophys Res Commun 2012; 423: 158–63. [DOI] [PubMed] [Google Scholar]
- 32. Pedersen N, Mortensen S, Sørensen SB et al Transcriptional gene expression profiling of small cell lung cancer cells. Cancer Res 2003; 63: 1943–53. [PubMed] [Google Scholar]
- 33. Poirier JT, Dobromilskaya I, Moriarty WF, Peacock CD, Hann CL, Rudin CM. Selective tropism of Seneca Valley virus for variant subtype small cell lung cancer. J Natl Cancer Inst 2013; 105: 1059–65. [DOI] [PMC free article] [PubMed] [Google Scholar]
- 34. Osborne JK, Larsen JE, Shields MD et al NeuroD1 regulates survival and migration of neuroendocrine lung carcinomas via signaling molecules TrkB and NCAM. Proc Natl Acad Sci USA 2013; 110: 6524–9. [DOI] [PMC free article] [PubMed] [Google Scholar]
- 35. Zanconato F, Forcato M, Battilana G et al Genome‐wide association between YAP/TAZ/TEAD and AP‐1 at enhancers drives oncogenic growth. Nat Cell Biol 2015; 17: 1218–27. [DOI] [PMC free article] [PubMed] [Google Scholar]
- 36. Stein C, Bardet AF, Roma G et al YAP1 exerts its transcriptional control via TEAD‐mediated activation of enhancers. PLoS Genet 2015; 11: e1005465. [DOI] [PMC free article] [PubMed] [Google Scholar]
- 37. Gilchrist AJ, Meuser R, Turchinsky J, Shaw AR, Pasdar M, Dixon WT. Cell adhesion‐mediated transformation of a human SCLC cell line is associated with the development of a normal phenotype. Exp Cell Res 2002; 276: 63–78. [DOI] [PubMed] [Google Scholar]
- 38. Fridman R, Giaccone G, Kanemoto T, Martin GR, Gazdar AF, Mulshine JL. Reconstituted basement membrane (matrigel) and laminin can enhance the tumorigenicity and the drug resistance of small cell lung cancer cell lines. Proc Natl Acad Sci USA 1990; 87: 6698–702. [DOI] [PMC free article] [PubMed] [Google Scholar]
- 39. Wang Y, Dong Q, Zhang Q, Li Z, Wang E, Qiu X. Overexpression of yes‐associated protein contributes to progression and poor prognosis of non‐small‐cell lung cancer. Cancer Sci 2010; 101: 1279–85. [DOI] [PMC free article] [PubMed] [Google Scholar]
- 40. Lange AW, Sridharan A, Xu Y, Stripp BR, Perl AK, Whitsett JA. Hippo/Yap signaling controls epithelial progenitor cell proliferation and differentiation in the embryonic and adult lung. J Mol Cell Biol 2015; 7: 35–47. [DOI] [PMC free article] [PubMed] [Google Scholar]
- 41. Sato T, Kaneda A, Tsuji S et al PRC2 overexpression and PRC2‐target gene repression relating to poorer prognosis in small cell lung cancer. Sci Rep 2013; 3: 1911. [DOI] [PMC free article] [PubMed] [Google Scholar]
- 42. Tanaka I, Osada H, Fujii M et al LIM‐domain protein AJUBA suppresses malignant mesothelioma cell proliferation via Hippo signaling cascade. Oncogene 2015; 34: 73–83. [DOI] [PubMed] [Google Scholar]
- 43. Das Thakur M, Feng Y, Jagannathan R, Seppa MJ, Skeath JB, Longmore GD. Ajuba LIM proteins are negative regulators of the Hippo signaling pathway. Curr Biol 2010; 20: 657–62. [DOI] [PMC free article] [PubMed] [Google Scholar]
- 44. Polley E, Kunkel M, Evans D et al Small cell lung cancer screen of oncology drugs, investigational agents, and gene and microRNA expression. J Natl Cancer Inst 2016; 108. pii: djw122. doi: 10.1093/jnci/djw122 [DOI] [PMC free article] [PubMed] [Google Scholar]
- 45. Hiroshima K, Iyoda A, Shida T et al Distinction of pulmonary large cell neuroendocrine carcinoma from small cell lung carcinoma: a morphological, immunohistochemical, and molecular analysis. Mod Pathol 2006; 19: 1358–68. [DOI] [PubMed] [Google Scholar]
- 46. Hamanaka W, Motoi N, Ishikawa S et al A subset of small cell lung cancer with low neuroendocrine expression and good prognosis: a comparison study of surgical and inoperable cases with biopsy. Hum Pathol 2014; 45: 1045–56. [DOI] [PubMed] [Google Scholar]
- 47. Fujiwara T, Hiramatsu M, Isagawa T et al ASCL1‐coexpression profiling but not single gene expression profiling defines lung adenocarcinomas of neuroendocrine nature with poor prognosis. Lung Cancer 2012; 75: 119–25. [DOI] [PubMed] [Google Scholar]
- 48. Augustyn A, Borromeo M, Wang T et al ASCL1 is a lineage oncogene providing therapeutic targets for high‐grade neuroendocrine lung cancers. Proc Natl Acad Sci USA 2014; 111: 14788–93. [DOI] [PMC free article] [PubMed] [Google Scholar]
- 49. Meder L, König K, Ozretić L et al NOTCH, ASCL1, p53 and RB alterations define an alternative pathway driving neuroendocrine and small cell lung carcinomas. Int J Cancer 2016; 138: 927–38. [DOI] [PMC free article] [PubMed] [Google Scholar]
- 50. Oser MG, Niederst MJ, Sequist LV, Engelman JA. Transformation from non‐small‐cell lung cancer to small‐cell lung cancer: molecular drivers and cells of origin. Lancet Oncol 2015; 16: e165–72. [DOI] [PMC free article] [PubMed] [Google Scholar]
- 51. Cottini F, Hideshima T, Xu C et al Rescue of Hippo coactivator YAP1 triggers DNA damage‐induced apoptosis in hematological cancers. Nat Med 2014; 20: 599–606. [DOI] [PMC free article] [PubMed] [Google Scholar]
Associated Data
This section collects any data citations, data availability statements, or supplementary materials included in this article.
Supplementary Materials
Fig. S1. Inverse correlation between YAP1 (YAP), WWTR1 (TAZ), and ASCL1 expression.
Fig. S2. YAP and TAZ expression in SCLC cell lines.
Fig. S3. Positive correlation between YAP and AJUBA.
Fig. S4. Phosphorylation and expression of YAP following AJUBA knockdown in SBC5 cells.
Table S1. Characteristics of SCLC cell lines.
Table S2. PCR primers used in this study.
Table S3. Analyses of SCLC cell lines in the CCLE dataset.
Table S4. Microarray analysis.
Table S5. Expression of YAP1 (YAP) or WWTR1 (TAZ) and drug sensitivity (IC50) of SCLC cell lines.