Abstract
We determined the gene expression profiles for 48 ATP binding cassette (ABC) transporters in matched colon cancer and normal colon tissues in order to provide insight into the mechanisms underlying expression of transporters related to colon carcinogenesis. The expression of ABCB1,ABCC1,ABCC2,ABCC3, and ABCG2 was altered in association with colon carcinogenesis. Among these transporters, the expression of ABCC3 was repressed by Wnt signaling pathway in colon cancer cell lines. Knockdown of the pathway components transcription factor 7‐like 2 (TCF7L2) or β‐catenin thus increased ABCC3 expression, whereas activation of Wnt signaling with inhibitors of glycogen synthase kinase–3β (GSK‐3β) reduced it. ChIP and luciferase reporter assays also showed that TCF7L2 binds to the ABCC3 locus and regulates its expression. Finally, overexpression of ABCC3 in colon cancer cells conferred resistance to anticancer drug‐induced cytotoxicity. Our data thus suggest that Wnt signaling represses ABCC3 expression during colon carcinogenesis, and that subsequent upregulation of ABCC3 expression during drug treatment might contribute to acquired drug resistance.
Keywords: ABCC3 transporter, colorectal cancer, drug resistance, MRP3 transporter, Wnt signaling pathway
Colorectal cancer (CRC) is one of the most common types of cancer worldwide. Surgical resection is the only curative treatment available for primary CRC. Unresectable tumors are often treated with chemotherapy, and advanced CRC is treated with a combination of surgery and chemotherapy. Although the outcome of chemotherapy for CRC has improved since the introduction of combination regimens including 5‐fluorouracil (5‐FU) and either oxaliplatin or irinotecan as well as that of molecularly targeted drugs,1, 2, 3 CRC remains a leading cause of cancer death. Development of more effective chemotherapeutic regimens for CRC is thus urgently needed.
Challenges faced by chemotherapy for CRC include side‐effects, high cost,4 and development of drug resistance. Reduced drug absorption as well as increased drug metabolism and excretion at the systemic level thus lower the effective drug concentration in blood.5 Furthermore, reduced drug uptake as well as increased drug metabolism and export in cancer cells increase drug resistance. ATP binding cassette (ABC) transporters are key mediators of the efflux of anticancer agents from cancer cells and therefore play an important role both in chemosensitivity of chemotherapy‐naive cancer cells and in acquired resistance of cancer cells to anticancer drugs.
ATP binding cassette transporters are localized at the cell membrane and mediate the export of substrates including metabolites, lipids, proteins, saccharides, amino acids, inorganic and organic ions, metals, and drugs.6 Among the 48 human ABC transporters, 12 proteins have been found to mediate the efflux of anticancer drugs.5, 7 Inhibition of the activity of such transporters in cancer cells would be expected to increase the intracellular concentration of these drugs and thereby to increase their effectiveness. However, such inhibitors have failed to overcome anticancer drug resistance in clinical trials.8 One reason for this failure is that the transporters are expressed not only in cancer cells but also in normal cells, in which they have important physiological roles, with the result that inhibition of transporter activity can be associated with a high incidence of adverse effects. The expression levels of certain ABC transporters were recently found to be markedly altered in several cancer types including CRC compared with corresponding normal cells,9 suggesting that inhibitors that target such transporters might be associated with fewer side‐effects.
Oncogenic transformation in CRC proceeds according to a well‐characterized adenoma‐carcinoma sequence. Normal epithelial cells thus progress to cancer cells in a stepwise manner associated with mutational activation of oncogenes. To identify ABC transporter genes whose expression levels change during colon carcinogenesis, we have now examined the expression levels of ABC transporter genes in normal colon and colon cancer tissue derived from chemotherapy‐naive patients. We then examined whether signaling associated with gene mutation during the adenoma‐carcinoma sequence might regulate the observed changes in transporter gene expression. We found that the Wnt signaling pathway, which is activated at an early stage of the adenoma‐carcinoma sequence, regulates the expression of ABCC3.
Materials and Methods
Surgical specimens
We sampled tissue from three colon cancer patients who underwent surgical resection of the primary tumor at Tohoku University Hospital (Table 1). This aspect of the study was approved by the Institutional Review Board of Tohoku University Graduate School of Medicine, and the patients provided written informed consent.
Table 1.
Patient characteristics
| Patient | Age (years) | Sex | Tumor location | T† | N | M | G | Stage‡ | Complication | Presurgical treatment | RIN§ | |
|---|---|---|---|---|---|---|---|---|---|---|---|---|
| Normal | Tumor | |||||||||||
| 1 | 69 | M | Ascending colon | T3 | N1b | M0 | G2 | IIIB | Diabetes mellitus | None | 8.2 | 7.9 |
| 2 | 61 | M | Ascending colon | T3 | N0 | M0 | G2 | IIA | None | None | 9.0 | 9.0 |
| 3 | 56 | F | Sigmoid colon | T2 | N0 | M0 | G2 | I | None | None | 7.5 | 6.9 |
†T, N, M, and G refer to the primary tumor site, regional lymph node involvement, the presence or otherwise of distant metastatic spread, and the grade of CRC based on the degree of cell differentiation and cell growth rate, respectively. ‡The stage of each cancer was determined from the pathological diagnosis according to the TNM Classification of Malignant Tumours (seventh edition). §RIN, RNA integrity number for the isolated total RNA samples.
Cell culture, RNAi, and modulation of Wnt signaling
Human colon cancer cell lines were obtained from ATCC (Manassas, VA, USA). HCT 116 and HT‐29 were cultured in McCoy's 5A medium (Thermo Scientific, Waltham, MA, USA), COLO 205 and HCT‐15 in RPMI 1640 (Sigma, St. Louis, MO, USA), and SW620 in DMEM (Sigma). For RNAi, cells were transfected with Silencer Select specific (Table S1) or negative control (no. 1) siRNAs (Thermo Scientific) at a final concentration of 9.1 nM with the use of the Lipofectamine RNAi MAX Reagent (Thermo Scientific). Total RNA and protein were extracted from cells 72 h after siRNA transfection. For modulation of Wnt signaling, cells were exposed to AR‐A014418 (Abcam, Cambridge, UK), LiCl (Wako, Osaka, Japan), or ICG‐001 (MedChemexpress, Monmouth Junction, NJ, USA) for 24 h before extraction of total RNA.
RT‐qPCR, immunoblot, and ChIP‐qPCR analyses
RT and quantitative PCR (qPCR), immunoblot, and ChIP‐qPCR analyses were performed as described previously.10 RT‐qPCR data were normalized by the amount of β‐glucuronidase (GUSB) mRNA. For ChIP‐qPCR, HCT 116 cells were infected with a lentivirus encoding an shRNA specific for TCF7L2 mRNA (5ʹ‐GAUGGAAGCUUACUAGAUU‐3ʹ). The qPCR primers and antibodies used in this study are listed in Table S1.
Statistical analysis
Data are presented as means ± SD for biological (not technical) replicates. For microarray analysis, differences were evaluated with the two‐tailed, paired t‐test or Welch's t‐test depending on analysis of variance. Differences in other experiments were evaluated as indicated. Statistical analysis was performed with R (The R Foundation for Statistical Computing, ver. 3.0.2 or ver. 3.3.0, Vienna, Austria). A P‐value of <0.05 was considered statistically significant.
Other methods
Additional methods are described in Supporting Information (Appendix S1).
Results
Gene expression profiles for 48 ABC transporters in normal colon and colon cancer
We determined gene expression profiles for three paired colon cancer (T1, T2, T3) and normal colon (N1, N2, N3) specimens collected from chemotherapy‐naive patients as well as for five colon cancer cell lines by RNA sequencing (RNA‐seq) (Table S2). Clustering analysis according to correlation coefficients assigned expression profiles to two broad categories: cell lines and clinical specimens (Fig. S1). The clinical specimens were further divided into two groups—normal colon and colon cancer—rather than into three groups of samples obtained from the same individuals.
Among the 48 human ABC transporter genes, expression of eight genes (ABCB2, ABCB3, ABCB8, ABCB10, ABCC1, ABCC2, ABCE1, ABCF2) was upregulated, whereas that of 17 genes (ABCA2, ABCA5, ABCA6, ABCA8, ABCA9, ABCA10, ABCB1, ABCB4, ABCB5, ABCB11, ABCC3, ABCC8, ABCD2, ABCD3, ABCG1, ABCG2, ABCG4) was downregulated in each cancer specimen (Fig. 1 and Table S3).
Figure 1.
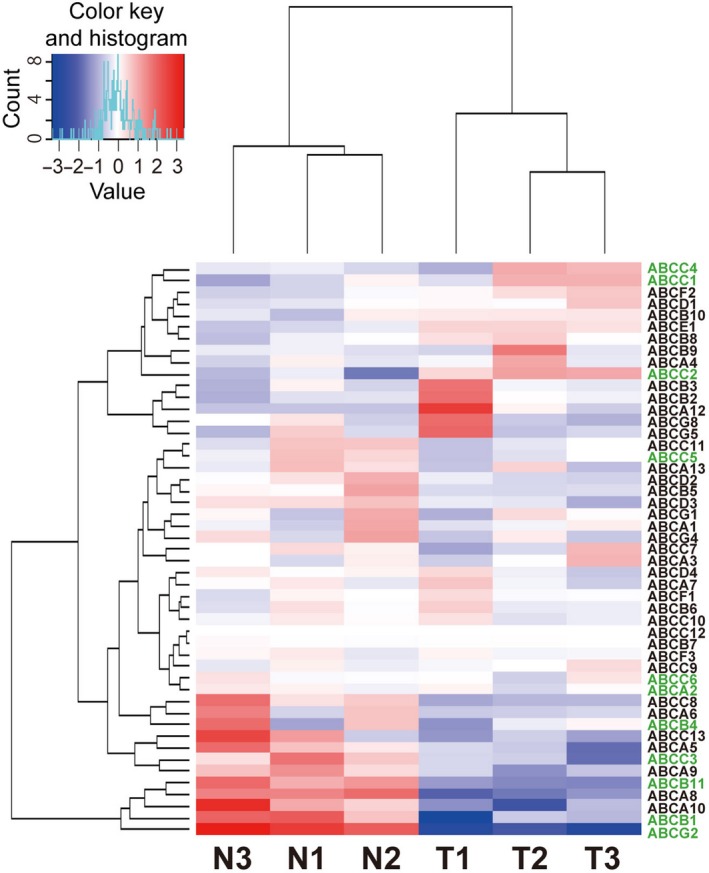
Heat map and cluster analysis of gene expression profiles for 48 ABC transporters in normal colon and colon cancer tissue. Each row represents an ABC transporter gene, and each column represents a clinical sample. N and T indicate paired normal and tumor tissue specimens, respectively. Genes and samples are arranged according to their similarity in expression levels determined by RNA‐seq. The expression level of each gene was standardized by subtraction of the mean log2(expression level) for the six samples from each value and is colored blue, white, or red to represent a low, moderate, or high level, respectively. Gene names colored green are analyzed in Fig. 2.
We next focused on 11 ABC transporters whose substrates were previously shown to include anticancer agents5 (Fig. 2a). Reanalysis of a microarray data set11 revealed that, among these transporters, expression of the genes for ABCC1 and ABCC2 was significantly upregulated, whereas that of those for ABCB1, ABCC3, and ABCG2 was significantly downregulated in colon cancer compared with normal tissue (Fig. 2a). These findings are consistent with the results of another previous study9 and our RNA‐seq analysis (Fig. 2b), and we validated these findings by RT‐qPCR (Fig. 2c).
Figure 2.
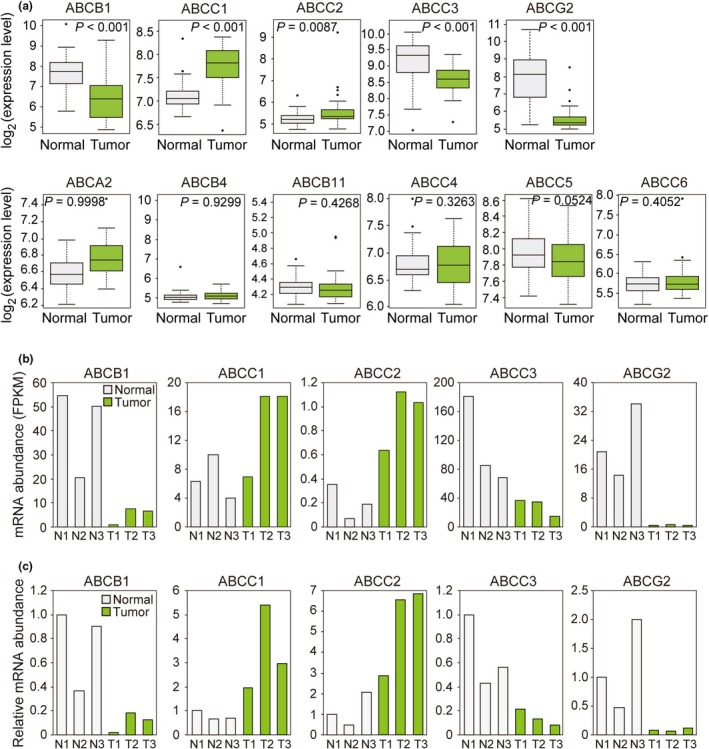
Gene expression levels in normal colon and colon cancer tissue for 11 ABC transporters related to anticancer drug resistance. (a) Box plots of gene expression levels for 11 ABC transporters were constructed from data in a public microarray database.11 (b) Gene expression levels for five ABC transporters as determined by our RNA‐seq analysis of clinical specimens. The five transporters are those that showed a significant difference in gene expression level between the paired samples in (a). FPKM, fragments per kilobase of transcript per million mapped reads. (c) RT‐qPCR analysis of the transporters in (b). Data are expressed relative to the corresponding value for N1.
Consistent with our gene expression data, immunohistochemistry revealed that the expression of ABCC3 (also known as multidrug resistance‐associated protein 3, or MRP3) was prominent in normal colonic epithelial cells but was markedly downregulated in the corresponding colon cancer cells (Fig. 3). The expression of ABCC3 was thus downregulated at both mRNA and protein levels in colon cancer compared with normal colon.
Figure 3.
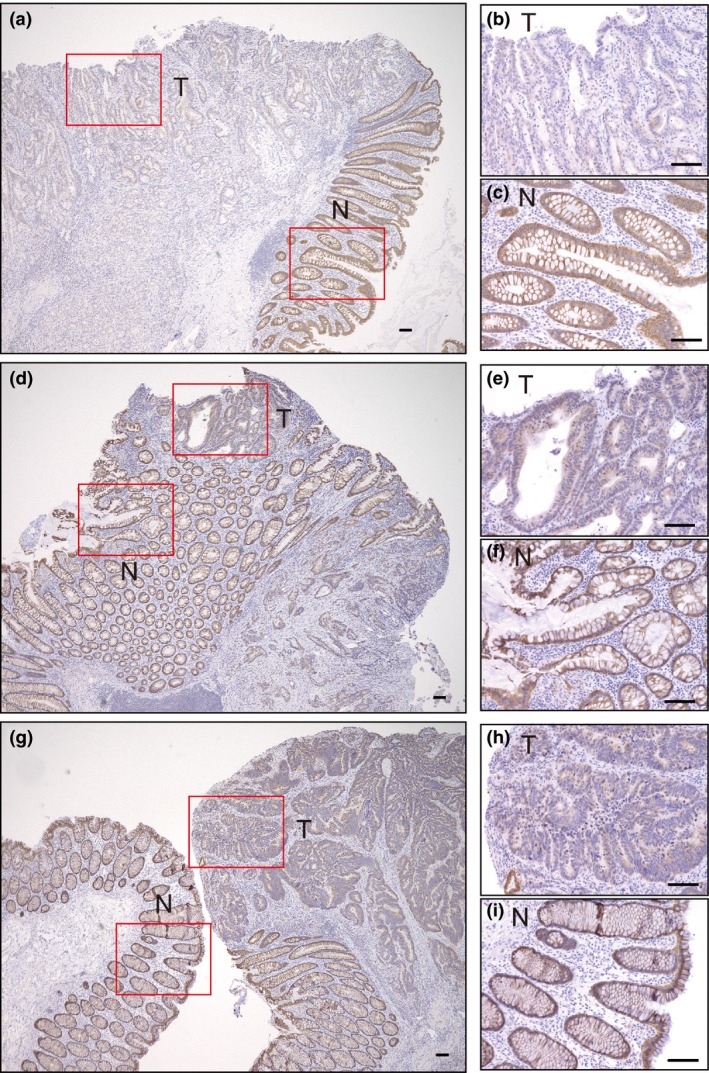
Immunohistochemical staining of ABCC3 in colon cancer and normal colon tissue. Tissue sections containing normal (N) and tumor (T) cells are from patients 1 (a–c), 2 (d–f), and 3 (g–i). Boxed regions in (a), (d), and (g) are shown at higher magnification in (b) and (c), (e) and (f), and (h) and (i), respectively. Scale bars, 100 μm.
Wnt signaling represses ABCC3 expression in colon cancer cell lines
To identify signaling pathways that regulate the expression of ABC transporters during colon carcinogenesis, we examined transporter expression in relation to the adenoma‐carcinoma progression. We found that the expression of genes regulated by Wnt signaling, including BIRC5 (survivin), CCND1 (cyclin D1), and MYC (c‐Myc), was markedly increased in the three colon cancer specimens compared with the paired control tissue (Table S3). We therefore examined whether Wnt signaling might regulate the expression of the five ABC transporters implicated in colon carcinogenesis.
We tested the effects of inhibition or activation of Wnt signaling on ABC transporter expression in the colon cancer cell lines HCT 116, HCT‐15, HT‐29, and SW620. COLO 205 cells were excluded from such analysis because of a low transfection efficiency. Transcription factor 7‐like 2 (TCF7L2) and β‐catenin (CTNNB1) are transcriptional regulators in Wnt signaling. HCT 116 cells harbor an activating mutation in CTNNB1 but are wild type for the adenomatous polyposis coli gene (APC), and they therefore manifest constitutive activation of TCF7L2 (Table S4). The other three cell lines studied are wild type for CTNNB1 but harbor loss‐of‐function mutations in APC, and they also manifest constitutive activation of TCF7L2 (Table S4).
We depleted the colon cancer cell lines of TCF7L2 or β‐catenin by RNAi (Fig. 4a and Figs S2a,S3a). Depletion of either TCF7L2 or β‐catenin resulted in an increase in the abundance of ABCC3 mRNA in all four cell lines (Fig. 4b and Fig. S3b). In contrast, although the expression of ABCB1, ABCC1, ABCC2, and ABCG2 differed between tumor and normal tissue, depletion of TCF7L2 or β‐catenin did not consistently affect these genes, suggesting that their expression is not directly regulated by Wnt signaling (Fig. S2b). Depletion of TCF7L2 or β‐catenin also increased the amount of ABCC3 protein in HT‐29 cells (Fig. 4a), although no such increase was apparent in the other cell lines (Fig. 4a and Fig. S3a), possibly because of the lower expression level of the ABCC3 gene in these cell lines (Fig. 4c).12
Figure 4.
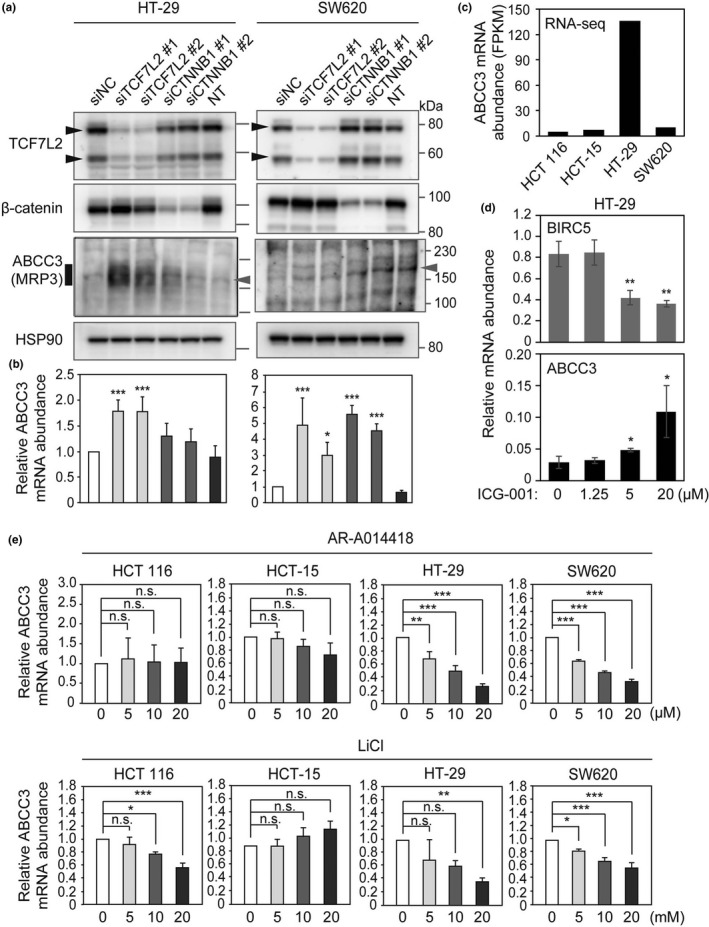
Effects of inhibition or activation of Wnt signaling on ABCC3 expression in colon cancer cell lines. (a) Immunoblot analysis of HT‐29 and SW620 cells transfected or not (NT) with negative control (NC), TCF7L2, or β‐catenin (CTNNB1) siRNAs. Black arrowheads indicate two bands of TCF7L2 protein translated from mRNA splice variants. The vertical bold line indicates specific ABCC3 smear signals in HT‐29. Gray arrowheads indicate likely nonspecific bands. (b) RT‐qPCR analysis of cells transfected as in (a). Data are expressed relative to the corresponding value for cells transfected with siNC and are means ± SD (n = 4). *P < 0.05, **P < 0.01, ***P < 0.001 versus the corresponding value for cells transfected with siNC (Dunnett's test). (c) Abundance of ABCC3 mRNA in colon cancer cell lines determined by RNA‐seq. (d and e) RT‐qPCR analysis of colon cancer cells exposed to ICG‐001 (d) or to AR‐A014418 or LiCl (e). Data in (e) are expressed relative to the corresponding value for cells not exposed to inhibitor. All data are means ± SD (n = 3). *P < 0.05, **P < 0.01, ***P < 0.001 (two‐tailed Student's t‐test); n.s., not significant.
Consistent with the results of RNAi, inhibition of Wnt signaling with a chemical inhibitor, ICG‐001, significantly increased the amount of ABCC3 mRNA, whereas it reduced that of BIRC5 mRNA, in a concentration‐dependent manner in both HT‐29 and HCT 116 cells (Fig. 4d and Fig. S4a). ICG‐001 also induced a slight increase in ABCC3 expression in HCT‐15 and SW620 cells, although this effect was not statistically significant (Fig. S4b,c). In addition, the amount of ABCC3 protein was increased by ICG‐001 treatment in HT‐29 cells (Fig. S4d). Together, these results revealed that inhibition of Wnt signaling increases ABCC3 expression.
We next examined whether activation of Wnt signaling represses ABCC3 expression. To activate Wnt signaling, we treated colon cancer cell lines with two inhibitors (AR‐A014418 and LiCl) of glycogen synthase kinase–3β (GSK‐3β). AR‐A014418 or LiCl downregulated the amount of ABCC3 mRNA in HT‐29 and SW620 cells in a concentration‐dependent manner (Fig. 4e). These agents also increased ABCC1 expression in HT‐29 cells as well as reduced that of ABCC2 in HCT 116 cells and of ABCG2 in HT‐29 cells (Fig. S5). Together, these results suggested that activation of Wnt signaling represses ABCC3 expression at least in HT‐29 and SW620 cells.
Binding of TCF7L2 to the ABCC3 locus
To examine whether TCF7L2 binds to the ABCC3 locus and thereby regulates its expression, we performed ChIP‐qPCR. Inspection of ChIP‐seq data for TCF7L2 in HCT 116 cells13 revealed nine TCF7L2 binding regions at the ABCC3 locus (Fig. 5a). ChIP‐qPCR revealed that TCF7L2 was associated with putative TCF7L2 binding regions A, B, and C, but not with negative control regions D or E, in HCT 116 cells (Fig. 5b). No specific binding was detected in HCT 116 cells depleted of TCF7L2 (Fig. 5b).
Figure 5.
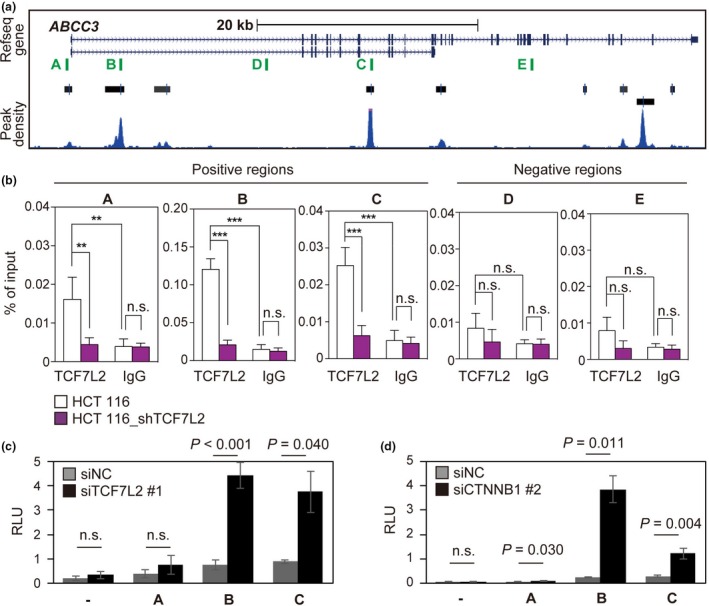
Binding of TCF7L2 to the ABCC3 locus. (a) The ABCC3 locus as depicted in the UCSC genome browser. Peaks called (black bars) and peak density plots (blue) for TCF7L2‐enriched regions are from ChIP‐seq data.13 Vertical green lines (A to E) indicate regions analyzed in (b) to (d). (b) ChIP‐qPCR analysis with antibodies to TCF7L2 or control IgG in HCT 116 cells depleted (HCT 116_shTCF7L2) or not of TCF7L2. Regions A, B, and C are putative TCF7L2 binding sites identified in the ChIP‐seq data, and regions D and E are not. Data are expressed as percent enrichment compared with input and are means ± SD (n = 4). **P < 0.01, ***P < 0.001 (two‐tailed Student's t‐test). (c and d) Luciferase reporter assays in SW620 cells. Cells were transfected with reporter vectors containing [or not (–)] ABCC3 regions A, B, or C and with siRNAs for TCF7L2 (c) or for β‐catenin (d). Relative light units (RLU) were calculated by dividing firefly luciferase activity by Renilla luciferase activity. Data are means ± SD (n = 3). P‐values were determined with the two‐tailed Student's t‐test.
To investigate whether TCF7L2 binding at these regions represses ABCC3 transcription, we performed luciferase reporter assays with DNA fragments encompassing regions A (500 bp), B (500 bp), and C (300 bp). The activities of intronic regions B and C, but not that of promoter region A or a control vector, increased significantly after knockdown of TCF7L2 in SW620 cells (Fig. 5c and Fig. S6a). Similar results were obtained after knockdown of β‐catenin (Fig. 5d and Fig. S6b), suggesting that regions B and C of the ABCC3 locus contain repressor elements.
Relation of ABCC3 expression to anticancer drug sensitivity
We examined whether inhibition of Wnt signaling with ICG‐001 might reduce the sensitivity of colon cancer cells to anticancer drugs through upregulation of ABCC3 expression. Given that ABCC3 expression was previously shown to confer resistance to etoposide or teniposide in ovarian carcinoma cells,14 we treated HT‐29, SW620, HCT 116 and HCT‐15 cells with these anticancer agents. Although ICG‐001 appeared to reduce the sensitivity of colon cancer cells to both drugs (Fig. S7a–d, data not shown), ICG‐001 itself markedly suppressed cell growth (data not shown), rendering its effect on drug sensitivity unclear.
To analyze directly the effect of ABCC3 on the sensitivity of colon cancer cells to these agents, we generated HT‐29 and SW620 cells that overexpress ABCC3 at the cell surface (Fig. 6a,b, Fig. S7e). We found that overexpression of ABCC3 reduced the sensitivity of both cell lines to both drugs (Fig. 6c–f).
Figure 6.
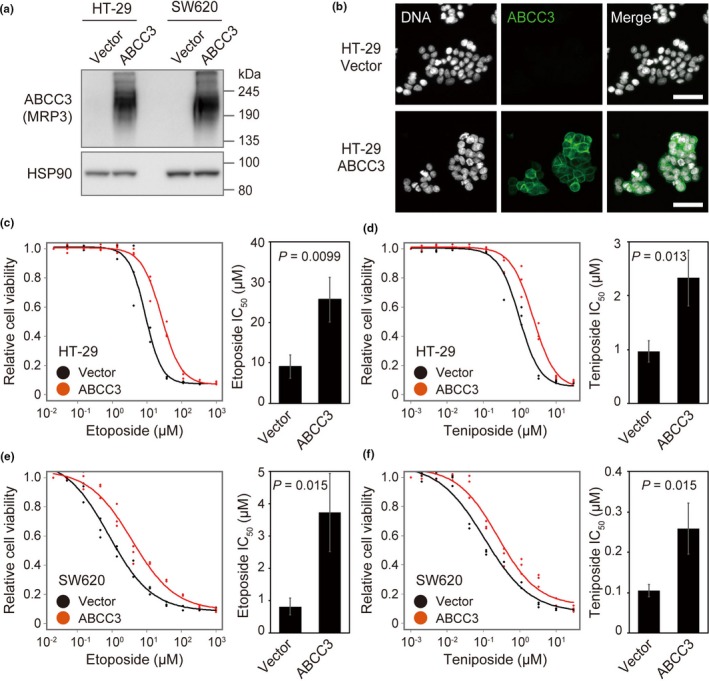
Relation of ABCC3 expression level to anticancer drug sensitivity in colon cancer cell lines. (a) Immunoblot analysis of HT‐29 and SW620 cells overexpressing ABCC3 or transfected with the empty vector. (b) Immunofluorescence analysis of HT‐29 cells transfected as in (a). DNA was stained with 4′,6‐diamidino‐2‐phenylindole. Scale bars, 50 μm. (c to f) Growth inhibition curves (left panels) as well as IC 50 values (right panels) for etoposide (c and e) or teniposide (d and f) in HT‐29 (c and d) or SW620 (e and f) cells transfected as in (a). Data are for three biological replicates (left panels) or means ± SD (n = 3) (right panels). P‐values were determined with the two‐tailed Student's t‐test.
Discussion
Repression of ABCC3 expression by Wnt signaling
Mutations in APC and CTNNB1 that result in activation of Wnt signaling are associated with the early stage of the adenoma‐carcinoma sequence for CRC.15 We found that activation of Wnt signaling by GSK‐3β inhibitors downregulated the abundance of ABCC3 mRNA in colon cancer cell lines. However, this effect was not observed in all the cell lines tested. Effects on the expression of other transporter genes were largely restricted to a single inhibitor or a single cell line. These differences may reflect differences in GSK‐3β activity or gene mutations among the cell lines.
TCF7L2 has been thought to act as a transcriptional repressor in the absence of β‐catenin and as an activator in its presence.16 However, a recent study suggested that TCF7L2 acts as both a repressor and activator irrespective of β‐catenin activity17: Among 149 genes directly regulated by TCF7L2 in rat H4IIE hepatoma cells, the expression of 94 genes (63.1%) was downregulated and that of 55 genes (36.9%) was upregulated after knockdown of TCF7L2.
Our ChIP‐qPCR and previous ChIP‐seq analyses showed that TCF7L2 and β‐catenin bound to the ABCC3 locus in colon cancer cells.13, 18, 19 In addition, we found that two intronic TCF7L2 binding regions showed repressor activity in a luciferase assay. These results suggest that TCF7L2 binds to intronic regions to repress ABCC3 transcription. It has been suggested that GATA3 tethers TCF7L2 to chromatin at sites where both GATA3 and TCF7L2 bind, and that TCF7L2 represses gene expression when tethered to chromatin via GATA3.13 TCF7L2 may therefore act as a repressor at the ABCC3 locus through binding to other transcription factors such as GATA3.
Role of ABCC3 expression in colon carcinogenesis
We have found that ABCC3 expression is downregulated in colon cancer. This change is likely associated with oncogenesis itself rather than being induced by administration of anticancer drugs, given that the specimens examined in this study were derived from chemotherapy‐naive patients. Bile acids were previously shown to be exported by ABCC3 and to promote tumorigenesis in the colonic epithelium through activation of the MAPK signaling pathway.20 Downregulation of ABCC3 expression may therefore promote colon carcinogenesis as a result of the intracellular accumulation of secondary bile acids.
We found that inhibition of Wnt signaling increased ABCC3 mRNA abundance and that overexpression of ABCC3 was sufficient to reduce the sensitivity of HT‐29 and SW620 cells to etoposide and teniposide. These results suggest that Wnt signaling may affect the sensitivity of colon cancer cells to anticancer agents through regulation of ABCC3 expression. However, we were able to detect an increase in ABCC3 protein abundance in response to inhibition of Wnt signaling only in HT‐29 cells. Moreover, we were not able to determine whether inhibition of Wnt signaling reduces drug sensitivity in colon cancer cells. The role of regulation of ABCC3 expression by Wnt signaling in drug sensitivity thus remains unclear.
Both etoposide and teniposide have been shown to be substrates of ABCC3,14 although these drugs are not in clinical use for chemotherapy in patients with CRC. The sensitivity of the colon cancer cell lines HT‐29 and SW480 to 5‐FU, which is the most widely used drug in the treatment of CRC,1, 2 was found to be increased by RNAi‐mediated depletion of ABCC3.21 Moreover, a previous microarray analysis showed that the abundance of ABCC3 mRNA was increased in 5‐FU‐resistant HCT 116 cells (Fig. S8).22 These results thus suggest that ABCC3 plays a role in 5‐FU resistance in colon cancer cells. However, we found that overexpression of ABCC3 did not significantly affect 5‐FU sensitivity in HT‐29 and SW620 cells (data not shown). Further studies are required to determine whether ABCC3 is responsible for acquired resistance to 5‐FU–based chemotherapy.
In conclusion, we found that Wnt signaling regulates ABCC3 expression in colon cancer cells, with the ABCC3 locus being a target of the transcription factors TCF7L2 and β‐catenin. Further studies are warranted both to investigate the possible role of downregulation of ABCC3 expression during colon carcinogenesis and to develop effective ABCC3‐targeted drugs for the potential reversal of acquired resistance to 5‐FU in colon cancer.
Disclosure Statement
The authors have no conflict of interest to declare.
Supporting information
Appendix S1. Supporting methods.
Fig. S1. Heat map and cluster analysis of gene expression profiles determined by RNA‐seq analysis.
Fig. S2. Efficiency of RNAi and its effects on ABC transporter gene expression.
Fig. S3. Effects of depletion of TCF7L2 or β‐catenin on ABCC3 expression in HCT116 and HCT‐15 cells.
Fig. S4. Effects of ICG‐001 on ABCC3 expression in colon cancer cell lines.
Fig. S5. Effects of GSK‐3β inhibitors on β‐catenin and ABC transporter gene expression.
Fig. S6. Luciferase reporter assay in SW620 cells.
Fig. S7. Effects of ICG‐001 on drug sensitivity as well as immunofluorescence analysis of ABCC3 overexpressed in colon cancer cell lines.
Fig. S8. Expression level of ABCC3 mRNA in 5‐FU–resistant HCT 116 cells.
Table S1. Oligonucleotide sequences and antibodies used in this study.
Table S2. Read numbers for RNA‐seq analysis.
Table S3. Gene expression profiles for 48 ABC transporters and Wnt signaling‐related proteins as determined by RNA‐seq analysis.
Table S4. Mutation status of CTNNB1, APC, and TCF7L2 in colon cancer cell lines.
Acknowledgments
We thank H. Miyoshi for providing the CSII lentiviral vector; F. Fujishima for technical assistance with immunohistochemistry; Y. Nagasawa, K. Kuroda, M. Tsuda, M. Kikuchi, and M. Nakagawa for general technical assistance; T. Konishi for help in preparation of the manuscript; other laboratory members for discussion; and the Biomedical Research Core of Tohoku University Graduate School of Medicine for technical support. This work was supported by JSPS KAKENHI grant numbers JP26293059, JP26830064, and JP16K07107.
Cancer Sci 107 (2016) 1776–1784
Funding Information
This work was supported by JSPS KAKENHI grant numbers JP26293059, JP26830064, and JP16K07107.
References
- 1. Andre T, Louvet C, Maindrault‐Goebel F et al CPT‐11 (irinotecan) addition to bimonthly, high‐dose leucovorin and bolus and continuous‐infusion 5‐fluorouracil (FOLFIRI) for pretreated metastatic colorectal cancer. Eur J Cancer 1999; 35: 1343–7. [DOI] [PubMed] [Google Scholar]
- 2. Maindrault‐Goebel F, de Gramont A, Louvet C et al Evaluation of oxaliplatin dose intensity in bimonthly leucovorin and 48‐hour 5‐fluorouracil continuous infusion regimens (FOLFOX) in pretreated metastatic colorectal cancer. Ann Oncol 2000; 11: 1477–83. [DOI] [PubMed] [Google Scholar]
- 3. Cheng Y, Yang H, Chen G, Zhang Z. Molecularly targeted drugs for metastatic colorectal cancer. Drug Des Devel Ther 2013; 7: 1315–22. [DOI] [PMC free article] [PubMed] [Google Scholar]
- 4. Schrag D. The price tag on progress‐chemotherapy for colorectal cancer. N Engl J Med 2004; 351: 317–19. [DOI] [PubMed] [Google Scholar]
- 5. Gottesman MM, Fojo T, Bates SE. Multidrug resistance in cancer: role of ATP‐dependent transporters. Nat Rev Cancer 2002; 2: 48–58. [DOI] [PubMed] [Google Scholar]
- 6. Dean M, Rzhetsky A, Allikmets R. The human ATP‐binding cassette (ABC) transporter superfamily. Genome Res 2001; 11: 1156–66. [DOI] [PubMed] [Google Scholar]
- 7. Hopper‐Borge E, Xu X, Shen T, Shi Z, Chen ZS, Kruh GD. Human multidrug resistance protein 7 (ABCC10) is a resistance factor for nucleoside analogues and epothilone B. Cancer Res 2009; 69: 178–84. [DOI] [PMC free article] [PubMed] [Google Scholar]
- 8. Chen KG, Sikic BI. Molecular pathways: regulation and therapeutic implications of multidrug resistance. Clin Cancer Res 2012; 18: 1863–9. [DOI] [PMC free article] [PubMed] [Google Scholar]
- 9. Hlavata I, Mohelnikova‐Duchonova B, Vaclavikova R et al The role of ABC transporters in progression and clinical outcome of colorectal cancer. Mutagenesis 2012; 27: 187–96. [DOI] [PubMed] [Google Scholar]
- 10. Hosogane M, Funayama R, Nishida Y, Nagashima T, Nakayama K. Ras‐induced changes in H3K27me3 occur after those in transcriptional activity. PLoS Genet 2013; 9: e1003698. [DOI] [PMC free article] [PubMed] [Google Scholar]
- 11. Sheffer M, Bacolod MD, Zuk O et al Association of survival and disease progression with chromosomal instability: a genomic exploration of colorectal cancer. Proc Natl Acad Sci USA 2009; 106: 7131–6. [DOI] [PMC free article] [PubMed] [Google Scholar]
- 12. Scheffer GL, Kool M, de Haas M et al Tissue distribution and induction of human multidrug resistant protein 3. Lab Invest 2002; 82: 193–201. [DOI] [PubMed] [Google Scholar]
- 13. Frietze S, Wang R, Yao L et al Cell type‐specific binding patterns reveal that TCF7L2 can be tethered to the genome by association with GATA3. Genome Biol 2012; 13: R52. [DOI] [PMC free article] [PubMed] [Google Scholar]
- 14. Kool M, van der Linden M, de Haas M et al MRP3, an organic anion transporter able to transport anti‐cancer drugs. Proc Natl Acad Sci USA 1999; 96: 6914–19. [DOI] [PMC free article] [PubMed] [Google Scholar]
- 15. Fearon ER, Vogelstein B. A genetic model for colorectal tumorigenesis. Cell 1990; 61: 759–67. [DOI] [PubMed] [Google Scholar]
- 16. Hrckulak D, Kolar M, Strnad H, Korinek V. TCF/LEF transcription factors: an update from the internet resources. Cancers (Basel) 2016; 8: E70. [DOI] [PMC free article] [PubMed] [Google Scholar]
- 17. Norton L, Chen X, Fourcaudot M, Acharya NK, DeFronzo RA, Heikkinen S. The mechanisms of genome‐wide target gene regulation by TCF7L2 in liver cells. Nucleic Acids Res 2014; 42: 13646–61. [DOI] [PMC free article] [PubMed] [Google Scholar]
- 18. Bottomly D, Kyler SL, McWeeney SK, Yochum GS. Identification of β‐catenin binding regions in colon cancer cells using ChIP‐Seq. Nucleic Acids Res 2010; 38: 5735–45. [DOI] [PMC free article] [PubMed] [Google Scholar]
- 19. Watanabe K, Biesinger J, Salmans ML et al Integrative ChIP‐seq/microarray analysis identifies a CTNNB1 target signature enriched in intestinal stem cells and colon cancer. PLoS One 2014; 9: e92317. [DOI] [PMC free article] [PubMed] [Google Scholar]
- 20. Centuori SM, Martinez JD. Differential regulation of EGFR‐MAPK signaling by deoxycholic acid (DCA) and ursodeoxycholic acid (UDCA) in colon cancer. Dig Dis Sci 2014; 59: 2367–80. [DOI] [PMC free article] [PubMed] [Google Scholar]
- 21. Yu Z, Zhang C, Wang H et al Multidrug resistance‐associated protein 3 confers resistance to chemoradiotherapy for rectal cancer by regulating reactive oxygen species and caspase‐3‐dependent apoptotic pathway. Cancer Lett 2014; 353: 182–93. [DOI] [PubMed] [Google Scholar]
- 22. Boyer J, Allen WL, McLean EG et al Pharmacogenomic identification of novel determinants of response to chemotherapy in colon cancer. Cancer Res 2006; 66: 2765–77. [DOI] [PubMed] [Google Scholar]
Associated Data
This section collects any data citations, data availability statements, or supplementary materials included in this article.
Supplementary Materials
Appendix S1. Supporting methods.
Fig. S1. Heat map and cluster analysis of gene expression profiles determined by RNA‐seq analysis.
Fig. S2. Efficiency of RNAi and its effects on ABC transporter gene expression.
Fig. S3. Effects of depletion of TCF7L2 or β‐catenin on ABCC3 expression in HCT116 and HCT‐15 cells.
Fig. S4. Effects of ICG‐001 on ABCC3 expression in colon cancer cell lines.
Fig. S5. Effects of GSK‐3β inhibitors on β‐catenin and ABC transporter gene expression.
Fig. S6. Luciferase reporter assay in SW620 cells.
Fig. S7. Effects of ICG‐001 on drug sensitivity as well as immunofluorescence analysis of ABCC3 overexpressed in colon cancer cell lines.
Fig. S8. Expression level of ABCC3 mRNA in 5‐FU–resistant HCT 116 cells.
Table S1. Oligonucleotide sequences and antibodies used in this study.
Table S2. Read numbers for RNA‐seq analysis.
Table S3. Gene expression profiles for 48 ABC transporters and Wnt signaling‐related proteins as determined by RNA‐seq analysis.
Table S4. Mutation status of CTNNB1, APC, and TCF7L2 in colon cancer cell lines.


