

Abstract
The metabolism in tumor cells shifts from oxidative phosphorylation to glycolysis even in an aerobic environment. This phenomenon is known as the Warburg effect. This effect is regulated mainly by polypyrimidine tract‐binding protein 1 (PTBP1), which is a splicer of the mRNA for the rate‐limiting enzymes of glycolysis, pyruvate kinase muscle 1 and 2 (PKM1 and PKM2). In the present study, we demonstrated that miR‐133b reduced PTBP1 expression at translational level and that the expression levels of miR‐133b were significantly downregulated in gastric cancer clinical samples and human cell lines, whereas the protein expression level of PTBP1 was upregulated in 80% of the 20 clinical samples of gastric cancer examined. Ectopic expression of miR‐133b and knockdown of PTBP1 in gastric cancer cells inhibited cell proliferation through the induction of autophagy by the switching of PKM isoform expression from PKM2‐dominant to PKM1‐dominant. The growth inhibition was partially canceled by an autophagy inhibitor 3‐MA or a reactive oxygen species scavenger N‐acetylcysteine. These findings indicated that miR‐133b acted as a tumor‐suppressor through negative regulation of the Warburg effect in gastric cancer cells.
Keywords: Gastric cancer, MiR‐133b, PTBP1, pyruvate kinase, Warburg effect
Gastric cancer is the fourth most common cancer and second most common cause of cancer‐related deaths worldwide. Approximately 700 000 deaths are attributed to gastric cancer annually.1, 2, 3 Although the number of gastric cancer patients diagnosed in the early stage is increasing owing to improvements in early diagnosis,1 many cases are still found in the advanced stage.2
Chemotherapy was first used in the 1950s for gastric cancer patients who had experienced recurrence and were in the advanced stage,3 but advanced gastric one is still considered to be a fatal disease.2 Thus, there is a need for the identification of the molecular therapeutic targets and novel biomarkers for early diagnosis and individualized therapy.
MicroRNAs (miRNAs) are endogenous small non‐coding RNA molecules (18‐25 nucleotides)4, 5, 6, 7, 8, 9 that bind to the 3′‐untranslated region (3′‐UTR) of target mRNA and induce silencing of protein expression.4, 5, 6, 8, 9 MiRNA play important roles in a variety of biological processes such as cell proliferation, apoptosis and cell development.4, 5, 10, 11 Dysregulation of miRNA is involved in many diseases.5 Most miRNA act as tumor suppressor genes in various kinds of cancers,4, 5, 6, 7, 8 such as lung, breast, hepatic, pancreatic and gastric cancer. Although the aberrant expression of plural miRNA has been observed in gastric cancer, the mechanism of carcinogenesis has not yet been determined.
MiR‐133b was initially considered to be a muscle‐specific miRNA,10, 12, 13, 14 which is involved in myoblast differentiation, myogenic‐related disease and development of skeletal muscle.12, 13, 14 However, recent studies report a broader expression pattern of miR‐133b in diverse tissues. MiR‐133b plays an important role in non‐muscle‐related disease such as cardiac failure, cardiac hypertrophy, Parkinson's disease and cancer.14 Expression of miR‐133b is downregulated in many types of cancers, such as head/neck/oral, esophageal squamous cell, non‐small‐cell lung and colorectal cancer.10
The metabolism in tumor cells shifts from oxidative phosphorylation to glycolysis, which is known as the Warburg effect.11, 15, 16 In this system, pyruvate kinase is one of the important molecules for aerobic glycolysis.15, 16, 17 This enzyme has four isoforms: PKM1, PKM2, PKL and PKR.15, 16, 17, 18 PTBP1 regulates alternative splicing of pyruvate kinase, and dominantly selects exon 10, resulting in PKM2, which plays a central role in the metabolism of cancer cells.11, 19 This isoform is expressed in a broad range of human cancers.10, 15, 16, 19, 20
In the present study, to investigate the expression level of miR‐133b, we performed real‐time PCR analysis. The expression levels of miR‐133b were significantly downregulated in clinical gastric cancer samples. However, there was no significant relationship between the expression levels of miR‐133b and the clinco‐pathological characteristics (Table 1). Similarly, the expression levels of miR‐133b were downregulated in human gastric cancer cell lines. The result of a luciferase reporter assay showed that miR‐133b directly targeted PTBP1. The ectopic expression of miR‐133b in human gastric cancer cell lines inhibited cell growth through induction of autophagy by shifting from PKM2 to PKM1.
Table 1.
Patient characteristics
| Case number | Sex | Age (year) | Location | Borrmann type | T stage | N stage | M stage | Stage | Tumor size (mm) | miR133b | PTBP1 |
|---|---|---|---|---|---|---|---|---|---|---|---|
| Case 1 | M | 77 | U | 3 | T4a (SE) | N3b | M0 | IIIC | 100 | 0.0962931 | 20.5 |
| Case 2 | M | 71 | L | 3 | T3 (SS) | N0 | M0 | IIA | 60 | 0.0119731 | 16 |
| Case 3 | F | 91 | L | 2 | T4b (SI) | N2 | M0 | IIIC | 50 | 0.1077284 | 13.7 |
| Case 4 | M | 72 | L | 3 | T4a (SE) | N3a | M0 | IIIC | 70 | 0.5433701 | 0.9 |
| Case 5 | M | 83 | L | 2 | T3 (SS) | N0 | M0 | IIA | 48 | 0.0342941 | 3.8 |
| Case 6 | M | 77 | U | 3 | T3 (SS) | N1 | M0 | IIB | 125 | 0.0045811 | 95.3 |
| Case 7 | F | 66 | L | 1 | T2 (MP) | N2 | M0 | IIB | 40 | 0.1881811 | 4.6 |
| Case 8 | M | 84 | M | 3 | T4a (SE) | N3 | M0 | IIIC | 148 | 0.0076245 | 24.5 |
| Case 9 | F | 85 | M | 2 | T3 (SS) | N0 | M0 | IIA | 64 | 0.2085234 | 1.3 |
| Case 10 | M | 72 | M | 1 | T1b2 (SM) | N0 | M0 | IA | 60 | 0.0395168 | 6.4 |
| Case 11 | M | 64 | U | 1 | T3 (SS) | N0 | M0 | IIA | 55 | 0.0445525 | 7 |
| Case 12 | M | 78 | L | 2 | T4b (SI) | N3b | M0 | IIIC | 105 | 0.1299548 | 0.01 |
| Case 13 | F | 64 | U | 2 | T3 (SS) | N0 | M0 | IIA | 63 | 0.66367 | 0.1 |
| Case 14 | M | 73 | M | 1 | T1a (M) | N0 | M0 | IA | 21 | 0.14723 | 4 |
| Case 15 | F | 85 | M | 3 | T2 (MP) | N2 | M0 | IIB | 83 | 0.0550226 | 0.05 |
| Case 16 | M | 73 | L | 4 | T4a (SE) | N3a | M0 | IIIC | 110 | 1.4682963 | 5.8 |
| Case 17 | M | 80 | U | 2 | T3 (SS) | N0 | M0 | IIA | 54 | 0.0612736 | 8.1 |
| Case 18 | M | 94 | M | 3 | T4a (SE) | N0 | M0 | IIB | 54 | 0.3808007 | 1.6 |
| Case 19 | F | 65 | L | 2 | T2 (MP) | N0 | M0 | IB | 48 | 0.3093426 | 3.8 |
| Case 20 | F | 74 | U | 3 | T4a (SE) | N3a | M0 | IIIC | 65 | 0.2276456 | 1.1 |
These data indicated that miR‐133b acted as a tumor suppressor in gastric cancer through the silencing of PTBP1 and influencing the Warburg effect.
Materials and Methods
Clinical samples
Gastric cancer tissues, adjacent non‐tumor tissues and gastric mucosal epithelial cells were obtained from surgery patients with gastric cancer at the Department of Surgery, Gifu University Hospital (Gifu, Japan). All samples were histopathologically confirmed by H&E staining. The pathologic tumor staging was determined according to the Japanese Gastric Cancer Association (2011)21 (Table 1). All samples were immediately snap‐frozen in liquid nitrogen and stored at −80°C until RNA extraction could be performed.
Cell lines and culture
Human gastric cancer cell lines MKN‐1, MKN‐45 and KATO‐III were cultured in RPMI‐1640 (Wako Pure Chemical Industries, Osaka, Japan) supplemented with 8% FBS (Sigma‐Aldrich, St. Louis, MO, USA). Cell cultures were maintained at 37°C in 5% CO2 humidified atmosphere.
Inhibitors
For inhibition autophagy, 3‐methyladenine (3‐MA) (Calbiochem, San Diego, CA, USA) was pretreated in the cells for 8 h before transfection with miR‐133b. Free radical scavenger N‐acetylcysteine (NAC) was treated in the cells 24 h after transfection with miR‐133b. The final concentration of 3‐MA (100 and 200 μM) and NAC (1 and 2 mM) had no significant effect on cell growth (data not shown). Viable cell numbers were measured by performing the trypan‐blue dye‐exclusion test.
Cell transfection
Cell transfection was performed with Lipofectamine RNAiMAX Reagent (Invitrogen, Carlsbad, CA, USA) by following the manufacturer's procedures. MiR‐133b mimic (mirVana miRNA mimic) was purchased from Ambion (Foster City, CA, USA). Negative‐control mimic was purchased from HSS (Hokkaido, Japan). MiRNA mimics were used at a final concentration of 40 nM.
RNA extraction
Total RNA was isolated from tissues and cells by using TriPure Isolation Reagent (Roche Diagnostics GmbH, Mannheim, Germany) and a NucleoSpin miRNA Isolation Kit (TaKaRa, Otsu, Japan) according to the manufacturer's procedures. The concentration and purity of the total RNA were evaluated by ultraviolet spectrophotometry. Total RNA was stored at −80°C until analysis could be performed.
Reverse transcription and quantitative RT PCR
cDNA was synthesized using a TaqMan MicroRNA Reverse Transcription Kit (Applied Biosystems) from 25 ng of total RNA by following the manufacturer's procedures. Quantitative RT‐PCR was performed in a Thermal cycler Dice Real Time System II (TaKaRa) using TagMan Probes (Applied Biosystems) according to the manufacturer's procedures. PCR amplifications were performed in triplicate by using THUNDERBIRD probe qPCR Mix (Toyobo, Osaka, Japan) by following the manufacturer's procedures. The ΔΔC t method was used for relative quantification. The data were normalized by using endogenous control U6 (RNU6B).
Dual luciferase reporter assay
Luciferase reporter assays were performed with MKN‐1 cells. MKN‐1 cells were plated at 0.5 × 10⁴ cells/well in 96‐well plates 24 h prior to co‐transfection. In each well, 0.01 g pMIR/PTBP‐1/wild type (Applied Biosystems) or pMIR/PTBP‐1/mutant (Applied Biosystems), pRL‐TK Luciferase Reporter vector (Promega), 20 nM miR‐133b or nonspecific control siRNA (Dharmacon, Tokyo, Japan), along with LipofectamineRNAiMAX reagent (Invitrogen), were used for co‐transfection of the cells. Luciferase activities were determined using the Dual‐Glo Luciferase Assay System (Promega) and a GLOMAX 20/20 LUMINOMETER (Promega) 24 h after co‐transfection. The firefly luciferase activity was normalized by co‐transfected Renilla luciferase activity for determining co‐transfection efficiency.
Western blotting analysis
MKN‐1 and MKN‐45 cells were plated in six‐well plates (0.5 × 10⁵cells/well). Cells were collected for western blotting analysis 72 h after transfection with miRNA mimics. All cells and clinical samples were lysed for 20 min on ice with lysis buffer containing 1% Protease Inhibitor Cocktail (Sigma‐Aldrich). The protein lysis buffer consisted of 10 mM Tris–HCl (pH 7.4), 1%NP4O, 0.1% deoxycholic acid, 0.1% SDS, 150 mM NaCl and 1 mM EDTA. Proteins were separated on 10% and 12.5% polyacrylamide gels (Wako) by SDS PAGE and then transferred to PVDF membranes (Perkin Elmer Life Sciences, Boston, MA, USA). The membranes were thereafter blocked with 5% nonfat dry milk (Cell Signaling Technology, Danvers, MA, USA) and incubated with the desired primary antibody at 4°C overnight.
Primary antibodies against the following immunogens were used: PTBP1 (Cell Signaling Technology), PKM1 (Novus Biologicals, Liteleton, CO, USA), PKM2 (Novus Biologicals, Liteleton, CO, USA), β‐actin (Sigma‐Aldrich), LC3B (Cell Signaling Technology), PARP (Cell Signaling Technology) and p62 (Cell Signaling Technology). The protein levels were normalized to β‐actin (Cell Signaling Technology).
Electron microscopic observation
MKN‐1 cells transfected with miR‐133b (20 nM) were harvested and rinsed with PBS. Cells were fixed for 2 h with 2% paraformaldehyde and 2.5% glutaraldehyde in 0.2 M phosphate buffer (pH 7.4), rinsed in phosphate buffer, and postfixed in 2% osmium tetraoxide for 2 h. After having been washed with phosphate buffer, the cells were progressively dehydrated in a 10% graded series of 30–100% ethanol and then cleared in QY‐1 (Nissin EM, Tokyo, Japan). Thereafter they were embedded in Epon 812 resin (TAAB Laboratories Equipment, Reading, UK), and thin sections (70 nm thickness) were prepared, after which they were stained with uranyl acetate and lead citrate and examined by transmission electron microscopy with a Hitachi‐7650 (Hitachi, Tokyo, Japan), operating at 80 kV.
Determination of intracellular lactate after the transfection with either miR‐133b or siR‐PTBP1
The cells were collected 72 h after the transfection. Lactate was measured with an l‐Lactate Assay Kit according to the manufacturer's instructions (Cayman Chemical Company, Ann Arbor, MI, USA). Lactate production was normalized to the number of cells.
3‐D spheroid proliferation/viability assay
MKN‐1 cells were seeded at 0.5 × 10⁴ cells/well in 96‐well plates 24 h prior to transfection. MKN‐1 cells were collected for the spheroid proliferation/viability assay 24 h after transfection with miR‐133b or PTBP1 siRNA,. MKN‐1 cells were replated at 3.0 × 10³ cells/well with 5 μL of TRZ 10× Spheroid Formation Matrix (Trevigen, Gaithersburg, MD, USA) in 96‐well spheroid formation plates. After centrifugation (200 g, 3 min), the cells were incubated at 37°C in a 5% CO2 humidified atmosphere. At 96 h post‐transfection, 5 μL of MTT Reagent was added to each well, following by 50 μL of MTT Detergent Reagent at 120 h post‐transfection. At 144 h post‐transfection, the absorbance at 570 nm was determined using an iMark Microplate Reader (Bio Rad, Hercules, CA, USA).
Statistical analysis
Significant differences between two groups were evaluated using Student's t‐test (two‐tailed). A P‐value < 0.05 was considered statistically significant.
Results
Expression levels of miR‐133b were downregulated in gastric cancer cell lines and in clinical tumor samples from patients
To analyze the expression levels of miR‐133b in gastric cancer cells, we performed qRT‐PCR using TaqMan probes. First, we examined the expression of miR‐133b in three human gastric cancer cell lines (MKN‐1, MKN‐45 and KATO‐ΙΙΙ) and human adjacent normal gastric epithelial samples. The expression levels of miR‐133b in the three gastric cancer cell lines were significantly downregulated compared with those of gastric non‐tumorous mucosal epithelial cells (Fig. 1a). Subsequently, we measured the expression levels of miR‐133b in 20 pairs of gastric tumor tissues from the patients and adjacent non‐tumorous gastric mucosal tissues. The expression levels of miR‐133b were significantly downregulated in tumor tissues compared with those of adjacent normal gastric mucosal tissues (P < 0.05, Fig. 1b). These data showed that the expression level of miR‐133b was significantly downregulated in gastric cancer cells. However, there was no significant relationship between the expression levels of miR‐133b and the clinico‐pathological characteristics (Table 1).
Figure 1.
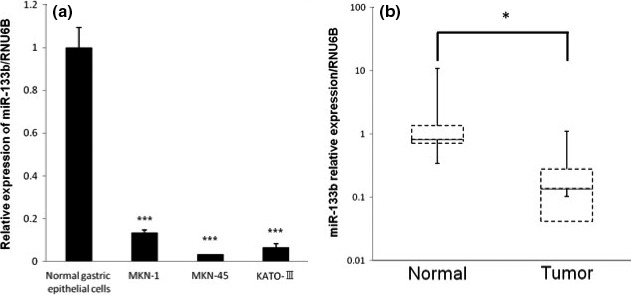
Mir‐133b expression in human gastric cell lines (a) and gastric cancer clinical samples (b). (a) Expression level of miR‐133b in three gastric cancer cell lines (KATO‐III, MKN‐1 and MKN‐45) and in a human normal gastric epithelial cell. (b) Relative expression of miR‐133b in 20 pairs of gastric cancer tissues and their adjacent normal gastric mucosal tissues. The levels of controls are indicated as “1.” Results are presented as the mean ± SD; *P < 0.05; **P < 0.01; ***P < 0.001.
Ectopic expression of miR‐133b inhibited growth in gastric cancer cell lines
To examine the role of miR‐133b in the carcinogenesis of gastric cancer, we transfected two gastric cancer cell lines (MKN‐1 and MKN‐45) with miR‐133b and found that the number of viable transfected cells was significantly reduced (Fig. 2a). These results indicated that miR‐133b functioned as a tumor suppressor miRNA in gastric cancer cells.
Figure 2.
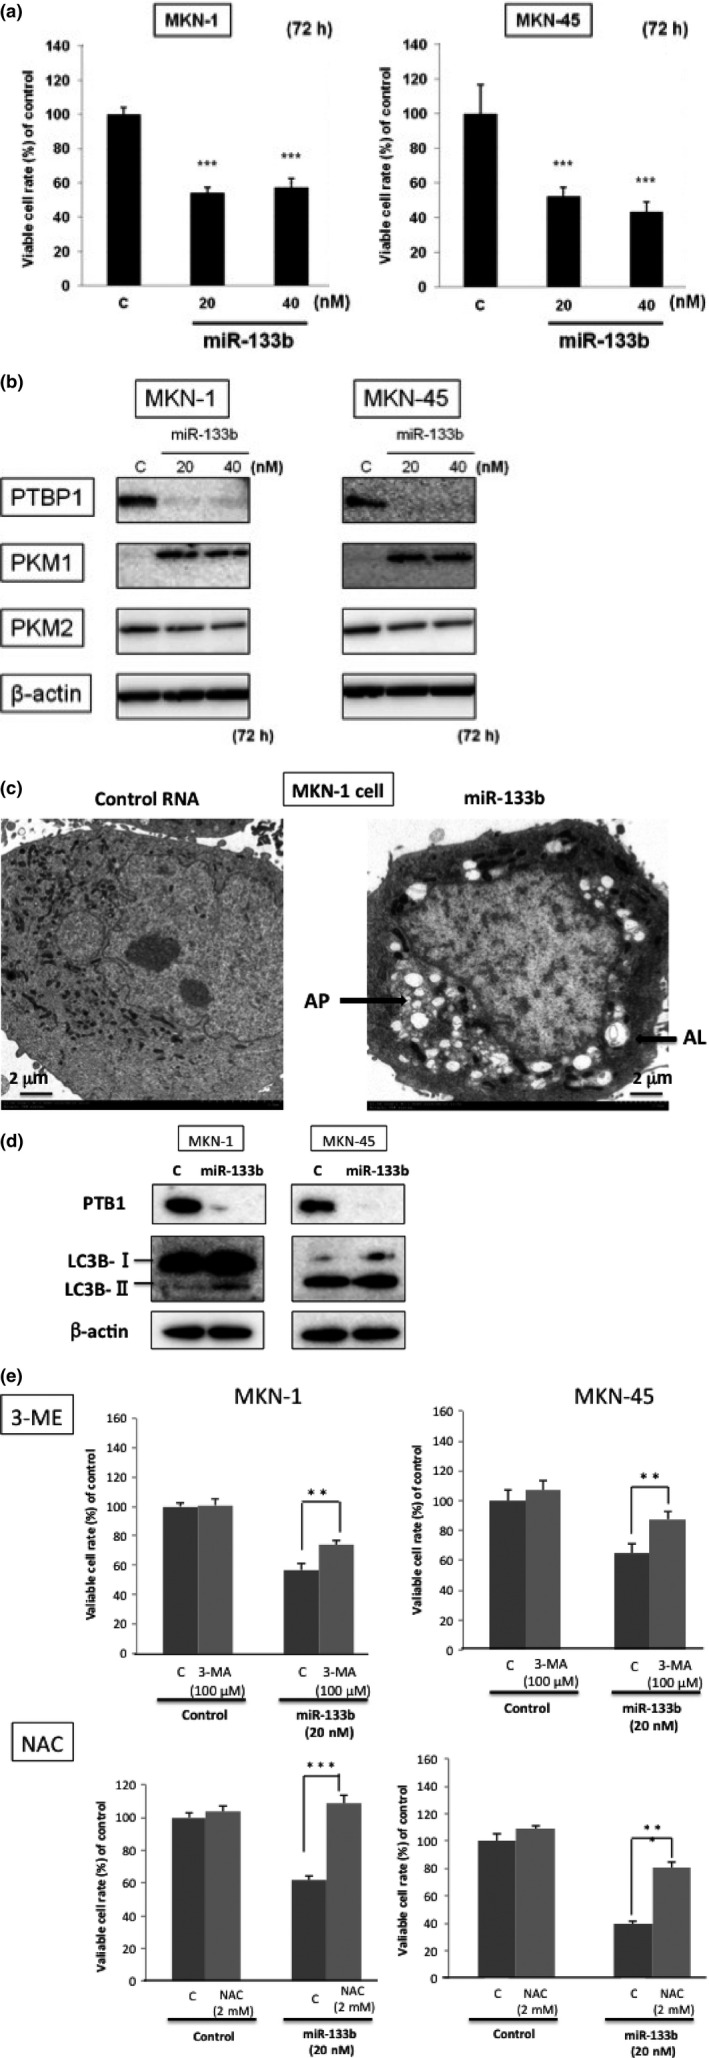
Ectopic expression of miR‐133b in gastric cancer cells. (a) Cell viability at 72 h after transfection of MKN‐1 and MKN‐45 cells with miR‐133b (control miRNA; 40 nM). (b) Western blot analysis of PTBP1 and PKM isoform expression in MKN‐1 and MKN‐45 cells transfected with control or miR‐133b. (c) Morphological examination by EM in the transfected cells with control RNA (left film) and miR‐133b (20 nM; right film). AL, autolysosome; AP, autophagosome (indicated by an arrow). (d) Western blot analysis of autophagy‐related protein LC3B. (e) Effects of 3‐ME and N‐acetylcysteine (NAC) on growth inhibition by the ectopic expression with miR‐133b. The evaluation was performed at 72 h after the transfection. The concentrations of 3‐ME and NAC were determined by examination of growth inhibition. Results are presented as the mean ± SD; *P < 0.05; **P < 0.01; ***P < 0.001.
Transfection of gastric cancer cell lines with miR‐133b‐induced downregulation of PTBP1 expression and switching of pyruvate kinase muscle isoform expression
To investigate the effect of miR‐133b on the Warburg effect in gastric cancer cells, we examined the Warburg effect‐related protein expression by performing western blot analysis after the transfection of MKN‐1 and MKN‐45 with miR‐133b. As a result, the ectopic expression of miR‐133b in both cell lines induced downregulation of PTBP1 and switching of PKM isoform expression from PKM2 to PKM1 72 h after the transfection (Fig. 2b).
Thus, the ectopic expression of miR‐133b clearly induced the switching of PKM isoform expression from PKM2 to PKM1 through the downregulation of PTBP1 expression in gastric cancer cells. Morphologically, electron microscopy (EM) study revealed the typical autophagic findings, such as many autophagosomes and autolysosomes in miR‐133b‐transfected MKN‐1 cells (Fig. 2c). To ascertain autophagy elicited by miR‐133b, we examined the protein expression of autophagy‐related molecule LC3B by western blot analysis. As shown in Figure 2(d), increased expression of LC3B‐I and the transition of LC3B‐I to LC3B‐II were observed in miR‐133b‐transfected MKN‐1 cells. Functionally, an inhibitor of autophagy 3‐MA partially canceled the reduction in the viable cell rate elicited by the ectopic expression of miR‐133b in both cells (Fig. 2e). In addition, NAC, a scavenger of reactive oxygen species (ROS), significantly canceled the reduction in the viable cell rate (Fig. 2e), which indicated ROS production in part by the shift from glycolysis to oxidative phosphorylation and the contribution of ROS to the induction of autophagy.
Expression of PTBP1 was upregulated in clinical gastric cancer samples
To examine the expression of PTBP1 in clinical samples from gastric tumors of the patients, we conducted western blot analysis. The expression levels of PTBP1 were markedly upregulated in the tumor tissues compared with those in the adjacent normal gastric mucosa (Fig. 3a). Out of the 20 cases examined, 16 cases showed increased expression of PTBP1 in the tumor samples. Based on such results, we examined the PKM1 and PKM2 expression in the same samples (Fig. S1). PTBP1 overexpressed cases were dominantly co‐expressed with PKM2 (Fig. 3b). Thus, PTBP1 overexpression was positively correlated with PKM2‐dominant expression profiles.
Figure 3.
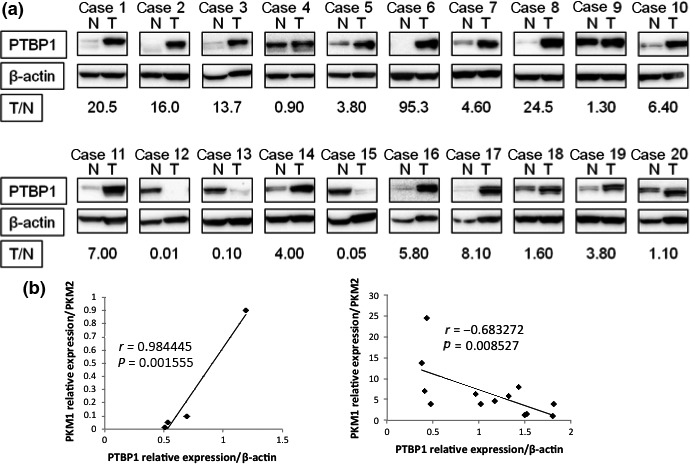
Expression of PTBP1 in gastric cancer clinical samples. (a) Western blot analysis of PTBP1 expression in 20 pairs of gastric cancer tissues and their adjacent normal gastric mucosal tissues. T/N value was calculated by densitometric analysis. (b) Correlation between the relative expression levels of PTBP1 and PKM isoforms. Statistically, Pearson correlation coefficient was used.
PTBP1 is a target gene of miR‐133b
Next we investigated how miR‐133b functioned as a tumor suppressor in gastric cancer cells. MiR‐133b has been reported to target PTBP1,18 which is involved in alternative splicing of PKM mRNA in colorectal cancer. However, it is unclear whether miR‐133b played a role as a tumor suppressor through the silencing of PTBP1 in gastric cancer. To confirm that miR‐133b targeted PTBP1, we performed luciferase reporter and anti‐sense transfection assays. First, using the online computational search tools (Target Scan Human), we predicted that miR‐133b could bind to the 3′ UTR of PTBP1 mRNA (Fig. 4a). We performed a luciferase reporter assay to confirm the interaction between miR‐133b and the predictive binding site in 3′ UTR of PTBP1. Luciferase reporters were constructed containing either wild‐type full‐length PTBP1 3′ UTR (pMIR/PTBP1/wild) or mutated PTBP1 3′ UTR (pMIR/PTBP1/mut). MKN‐1 cells were co‐transfected with luciferase reporters and miR‐133b or control RNA. The relative luciferase activity of the pMIR/PTBP‐1/wild type was suppressed by 34.0% compared with that of the pMIR/PTBP1/mut in a miR‐133b‐dependent manner (Fig. 4b). This result indicated that miR‐133b bound to a region in the 3′ UTR of PTBP1. Second, we performed an experiment using the anti‐miR‐133b. MKN‐1 cells were transfected with miR‐133b or co‐transfected with it and anti‐miR‐133b or control RNA. Co‐transfection with anti‐miR‐133b significantly restored the cell growth (Fig. 4c) and reversed the downregulation of the PTBP1 expression induced by the ectopic expression of miR‐133b (Fig. 4d). These data clearly showed that miR‐133b directly targeted PTBP1.
Figure 4.
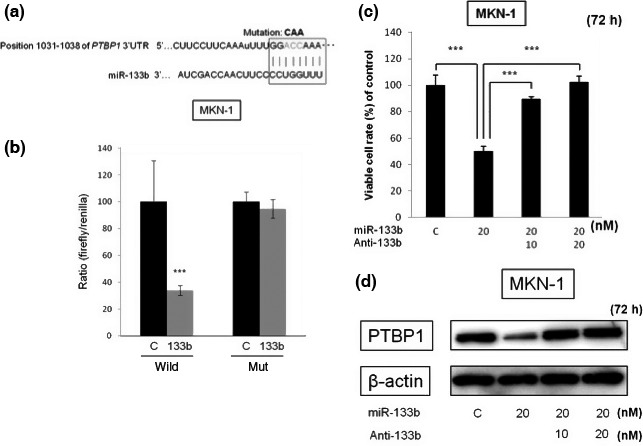
Binding of miR‐133b to the region in 3′UTR of PTBP1 mRNA. (a) Sequence of the PTBP1 3′ UTR showing the miR‐133b binding region and its seed region (box). (b) Relative luciferase activities of wild‐type and mutant (mut)‐type PTBP1 reporters for miR‐133b in MKN‐1 cells. (c) Viability of MKN‐1 cells at 72 h after co‐transfection with miR‐133b and its anti‐miR‐133b (Anti‐133b). (d) Western blot analysis of PTBP1 expression in MKN‐1 cells transfected with miR‐133b or co‐transfected with its anti‐miR‐133b (Anti‐133b). Results are presented as the mean ± SD; *P < 0.05; **P < 0.01; ***P < 0.001.
Knockdown of PTBP1 inhibited cell growth through the switching of PKM isoform expression in gastric cancer cell lines
The results relating to the PTBP1 expression in the clinical samples strongly suggested that the Warburg effect was regulated mainly by the PKM‐splicer PTBP1. To investigate the role of PTBP1 in cell proliferation in gastric cancer, we knocked down PTBP1 in MKN‐1 and MKN‐45 cells by using siR‐PTBP1. At 72 h after the knockdown of PTBP1, the number of viable cells was significantly reduced, even at the concentration of 1 nM (Fig. 5a).
Figure 5.
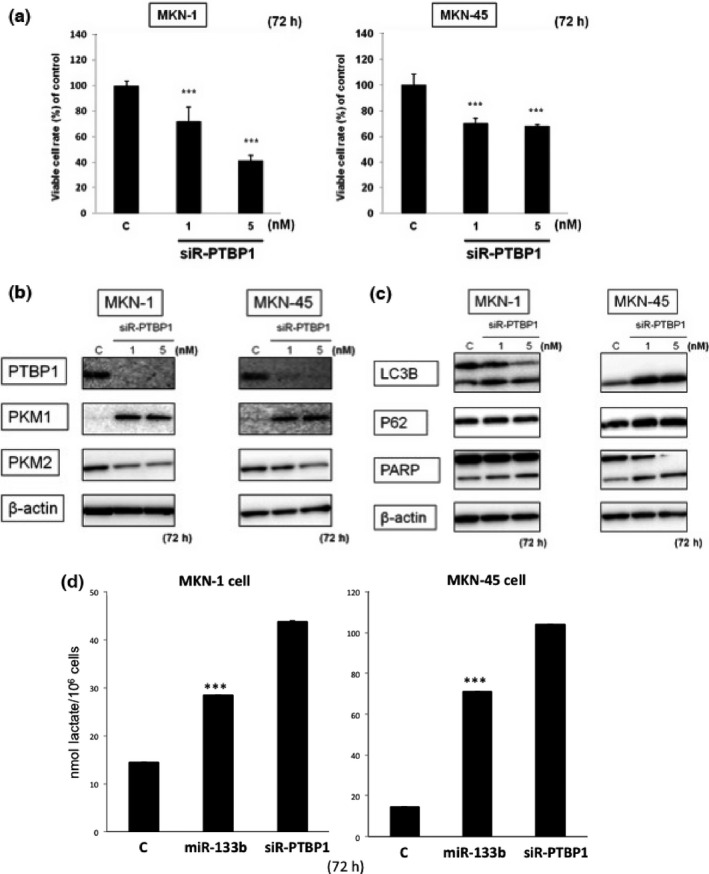
(a) Cell viability at 72 h after knockdown of PTBP1 in MKN‐1 and MKN‐45 cells determined using its siRNA. (b) Western blot analysis of PTBP1 and PKM isoform expression in MKN‐1 and MKN‐45 cells transfected with control or siR‐PTBP1. (c) Western blot analysis of LC3B, p62 and PARP expression in MKN‐1 and MKN‐45 cells transfected with control or siR‐PTBP1. (d) Intracellular lactate level in miR‐133b (20 nM) or siR‐PTBP1 (5 nM) transfected cells. Results are presented as the mean ± SD; *P < 0.05; **P < 0.01; ***P < 0.001.
Knockdown of PTBP1 in gastric cancer cell lines induced the switching of PKM isoform expression from PKM2 to PKM1
To examine the impact of the knockdown of PTBP1 on the Warburg effect, we performed western blot analysis after the transfection of MKN‐1 and of MKN‐45 cells with siR‐PTBP1. We confirmed that this siR silenced PTBP1 expression in MKN‐1 and MKN‐45 cells (Fig. 5b). As expected, the protein expression level of PKM2 was reduced and that of PKM1 was increased (Fig. 5b). This silencing of PTBP1 might have caused autophagy, because of the transition of LC3B‐I to LC3B‐II (Fig. 5c) and the vacuole formation (data not shown) in the siR‐PTBP1‐transfected cells. These results taken together indicated that the increased expression of miR‐133b induced the switching of PKM isoform expression from PKM2 to PKM1 through the downregulation of PTBP1 expression in the gastric cancer cells. To certify the metabolic switch, we examined the intracellular lactate level after the transfection in both cell lines (Fig. 5d). As a result, the levels were increased in either miR‐133b or siR‐PTBP1‐transfected cells.
Transfection with miR‐133b and knockdown of PTBP1 in gastric cancer cells suppressed 3‐D tumor growth
We examined the inhibition of tumor growth by using the in vitro 3‐D spheroid proliferation/viability assay instead of an in vivo model mouse. The growth of 3‐D spheroid tumors formed by MKN‐1 cells was significantly suppressed by either miR‐133b or siR‐PTBP1, as estimated by performing the MTT assay (Fig. 6). This result showed that transfection with miR‐133b or knockdown of PTBP1 in gastric cancer cell lines suppressed the tumor growth.
Figure 6.
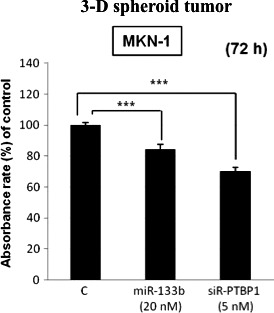
3‐D spheroid proliferation/viability assay at 72 h after transfection. The relative absorbance at 570 nm (MTT assay) is shown for non‐transfected MKN‐1 cells or those transfected with miR‐133b (20 nM) or siR‐PTBP1 (5 nM). Results are presented as the mean ± SD; *P < 0.05; **P < 0.01; ***P < 0.001.
Discussion
Much evidence indicates that the aberrant expression of miRNA is involved in carcinogenesis in many kinds of cancers, including gastric cancer. Upregulated miRNA that inactivate anti‐oncogenes act as onco‐mirs, whereas downregulated miRNA that inactivate oncogenes function as tumor‐suppressor miRNA.4, 5, 6, 7, 8
In gastric cancer, miR‐21 and miR‐106a are referred to as upregulated miRNA, and let‐7, miR‐101, miR‐148 and miR‐133b as downregulated miRNA.4 Although miR‐133b was initially considered to be a muscle‐specific miRNA,10, 12, 13, 14 it was later shown to act as a tumor‐suppressor miRNA in various types of cancers.10
In our study, we investigated the role of miR‐133b in carcinogenesis and the relationship between miR‐133b and the Warburg effect in gastric cancer cells. In the present study, we examined the expression levels of miR‐133b in human gastric cancer cell lines and clinical samples. MiR‐133b was significantly downregulated both in cell lines and in gastric cancer tumor tissues compared with its levels in the normal gastric epithelial cells and the adjacent normal tissues, respectively. In most of PTBP1‐overexpressed cases, the ratios of PKM2/PKM1 were increased. These findings suggest that PTBP1 expression is regulated at least in part by miR‐133b. Furthermore, the ectopic expression of miR‐133b markedly inhibited cell proliferation through the induction of autophagy. These findings indicate that miR‐133b acts as a tumor‐suppressor miRNA through the perturbation of Warburg effect in gastric cancer cells.
Pyruvate kinase (PK) is a rate‐limiting enzyme of glycolysis;11, 19, 20 and it has four isoforms (PKM1 in muscle and brain, PKM2 in embryonic and tumor cells, PKL in liver and kidney and PKR in red blood cell).15, 16, 17, 18 The Warburg effect is characteristic of energy metabolism in cancer cells, with metabolism shifts from oxidative phosphorylation to aerobic glycolysis.10, 15, 16, 19, 20 The switching of PKM isoform from PKM1 to PKM2 causes the Warburg effect. PKM2 is reported to be essential to use the aerobic glycolysis mainly in intracellular metabolism.15 In tumor tissues, the expression of PKM2 is strikingly upregulated and PKM2 plays a central role in their metabolism. Alternative splicing of PKM mRNA is caused mainly by PTBP1, which belongs to the hnRNP family, and it leads to switching of the PKM isoform from PKM1 to PKM2 (Fig. 7).10, 15, 16 In gastric cancer cell lines transfected with miR‐133b, the expression of PTBP1 was markedly downregulated, and PKM isoform expression was switched from PKM2 to PKM1 for a short duration. It was earlier reported that miR‐133b targets several genes, such as FSCN1, FGFR1, Gli1, Sp1 and CDC42, in gastric cancer cells.22, 23, 24, 25, 26 Earlier, based on experiments using the luciferase reporter assay and the anti‐sense RNA transfection assay, we reported that PTBP1 is a target gene of miR‐133b.11 Knockdown of PTBP1 in gastric cancer cell lines by use of siR‐PTBP1 inhibited cell proliferation and switched PKM isoform expression from PKM2 to PKM1.
Figure 7.
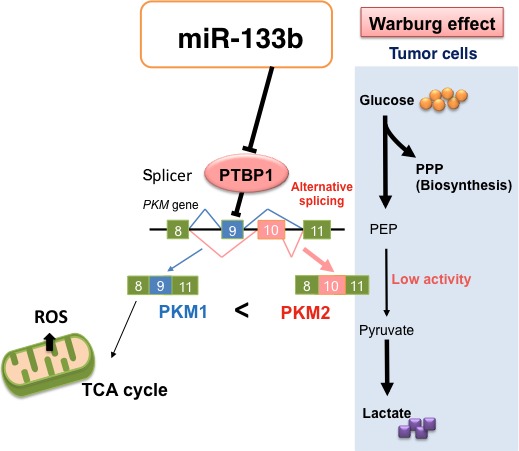
Schematic representation of the role of miR‐133b in the Warburg effect. The ectopic expression of miR‐133b‐induced downregulation of PTBP1 and switching from PKM2 to PKM1 for a short duration, which caused an abrupt increase in the intracellular reactive oxygen species (ROS). PEP, pentose phosphate pathway; PPP, phosphoenolpyruvic acid.
We measured the intracellular lactate level, which is a final product of glycolysis, in gastric cancer cell lines transfected with miR‐133b or siR‐PTBP1 and found that it tended to be higher in these cells compared with that in cells transfected with control RNA. We understand that the elevated lactate levels may reflect the further promotion of glycolysis even in the decreased levels of PKM2 for surviving. In addition, it was reported that knockdown of PKM2 expression and replacing it with PKM1 reduces the ability of tumor cells to form tumors in nude mouse.15 Furthermore, we examined the inhibition of tumor growth by using the in vitro 3‐D spheroid proliferation/viability assay. Either the ectopic expression of miR‐133b or the knockdown of PTBP1 in gastric cancer cell lines suppressed the 3‐D spheroid tumor growth.
We examined the expression of molecules related to apoptosis and autophagy to elucidate the machinery underlying the inhibition of cell proliferation. As expected, knockdown of PTBP1 or the ectopic expression of miR‐133b showed the transition of LC3B‐I to LC3B‐III and autolysosome formation morphologically in gastric cancer cells, which might have caused autophagy in the cells. The cell growth inhibition elicited by miR‐133b was canceled by the treatment with an autophagy inhibitor 3‐MA and a ROS scavenger NAC, respectively. Thus, the switching of PKM isoforms from PKM2 to PKM1 triggered the use of oxidative phosphorylation in the TCA cycle for a short duration, resulting in an abrupt increase in the intracellular ROS concentration that probably led to autophagic cell death.
Thus, perturbation of the Warburg effect by the silencing of PTBP1, which strongly contributed to cell proliferation, suggests that PTBP1 would be a critical target molecule for the development of anti‐cancer drugs (Fig. 7).
In this study, we showed that miR‐133b was frequently downregulated in gastric cancer cells and acted as a tumor‐suppressor miRNA. MiR‐133b switched the PKM isoform expression from PKM2 to PKM1 through the silencing of PTBP1, which is an alternative splicer of PKM, leading to growth suppression through the induction of autophagy in part by the metabolic switching from glycolysis to oxidative phosphorylation for a short period of time.
Disclosure Statement
The authors have no conflict of interest to declare.
Supporting information
Fig. S1. Expression of PKM1 and PKM2 in gastric cancer clinical samples.
Acknowledgments
This work was supported by a grant‐in‐aid for scientific research from the Ministry of Education, Science, Sports, and Culture of Japan. We thank Dr Ito for the EM study.
Cancer Sci 107 (2016) 1767–1775
Funding Information
The work was supported by a grant‐in‐aid for scientific research from the Ministry of Education, Science, Sports, and Culture of Japan grant number 24659157.
References
- 1. Jemal A, Bray F, Center MM, Ferlay J, Ward E, Forman D. Global cancer statistics. CA Cancer J Clin 2011; 61: 69–90. [DOI] [PubMed] [Google Scholar]
- 2. Parkin DM, Bray F, Ferlay J, Pisani P. Global cancer statistics, 2002. CA Cancer J Clin 2005; 55: 74–108. [DOI] [PubMed] [Google Scholar]
- 3. Meyer HJ, Wilke H. Treatment strategies in gastric cancer. Dtsch Arztebl Int 2011; 108: 698–705. [DOI] [PMC free article] [PubMed] [Google Scholar]
- 4. Ishiguro H, Kimura M, Takeyama H. Role of microRNAs in gastric cancer. World J Gastroenterol 2014; 20: 5694–9. [DOI] [PMC free article] [PubMed] [Google Scholar]
- 5. Alvarez‐Garcia I, Miska EA. MicroRNA functions in animal development and human disease. Development 2005; 132: 4653–62. [DOI] [PubMed] [Google Scholar]
- 6. Stahlhut Espinosa CE, Slack FJ. The role of microRNAs in cancer. Yale J Biol Med 2006; 79: 131–40. [PMC free article] [PubMed] [Google Scholar]
- 7. Esquela‐Kerscher A, Slack FJ. Oncomirs – microRNAs with a role in cancer. Nat Rev Cancer 2006; 6: 259–69. [DOI] [PubMed] [Google Scholar]
- 8. Zhang B, Pan X, Cobb GP, Anderson TA. MicroRNAs as oncogenes and tumor suppressors. Dev Biol 2007; 302: 1–12. [DOI] [PubMed] [Google Scholar]
- 9. Farazi TA, Hoell JI, Morozov P, Tuschl T. MicroRNAs in human cancer. Adv Exp Med Biol 2013; 774: 1–20. [DOI] [PMC free article] [PubMed] [Google Scholar]
- 10. Nohata N, Hanazawa T, Enokida H, Seki N. microRNA‐1/133a and microRNA‐206/133b clusters: dysregulation and functional roles in human cancers. Oncotarget 2012; 3: 9–21. [DOI] [PMC free article] [PubMed] [Google Scholar]
- 11. Taniguchi K, Ito Y, Sugito N et al Organ‐specific PTB1‐associated microRNAs determine expression of pyruvate kinase isoforms. Sci Rep 2015; 5: 8647. [DOI] [PMC free article] [PubMed] [Google Scholar]
- 12. Koutsoulidou A, Mastroyiannopoulos NP, Furling D, Uney JB, Phylactou LA. Expression of miR‐1, miR‐133a, miR‐133b and miR‐206 increases during development of human skeletal muscle. BMC Dev Biol 2011; 11: 34. [DOI] [PMC free article] [PubMed] [Google Scholar]
- 13. Chen JF, Mandel EM, Thomson JM et al The role of microRNA‐1 and microRNA‐133 in skeletal muscle proliferation and differentiation. Nat Genet 2006; 38: 228–33. [DOI] [PMC free article] [PubMed] [Google Scholar]
- 14. Townley‐Tilson WH, Callis TE, Wang D. MicroRNAs 1, 133, and 206: critical factors of skeletal and cardiac muscle development, function, and disease. Int J Biochem Cell Biol 2010; 42: 1252–5. [DOI] [PMC free article] [PubMed] [Google Scholar]
- 15. Christofk HR, Vander Heiden MG, Harris MH et al The M2 splice isoform of pyruvate kinase is important for cancer metabolism and tumour growth. Nature 2008; 452: 230–3. [DOI] [PubMed] [Google Scholar]
- 16. Mazurek S. Pyruvate kinase type M2: a key regulator of the metabolic budget system in tumor cells. Int J Biochem Cell Biol 2011; 43: 969–80. [DOI] [PubMed] [Google Scholar]
- 17. Kwon OH, Kang TW, Kim JH et al Pyruvate kinase M2 promotes the growth of gastric cancer cells via regulation of Bcl‐xL expression at transcriptional level. Biochem Biophys Res Commun 2012; 423: 38–44. [DOI] [PubMed] [Google Scholar]
- 18. Lim JY, Yoon SO, Seol SY et al Overexpression of the M2 isoform of pyruvate kinase is an adverse prognostic factor for signet ring cell gastric cancer. World J Gastroenterol 2012; 18: 4037–43. [DOI] [PMC free article] [PubMed] [Google Scholar]
- 19. Taniguchi K, Sugito N, Kumazaki M et al MicroRNA‐124 inhibits cancer cell growth through PTB1/PKM1/PKM2 feedback cascade in colorectal cancer. Cancer Lett 2015; 363: 17–27. [DOI] [PubMed] [Google Scholar]
- 20. Taniguchi K, Sugito N, Kumazaki M et al Positive feedback of DDX6/c‐Myc/PTB1 regulated by miR‐124 contributes to maintenance of the Warburg effect in colon cancer cells. Biochim Biophys Acta 2015; 1852: 1971–80. [DOI] [PubMed] [Google Scholar]
- 21. Japanese Gastric Cancer Association . Japanese classification of gastric carcinoma: 3rd English edition. Gastric Cancer 2011; 14: 101–12. [DOI] [PubMed] [Google Scholar]
- 22. Guo L, Bai H, Zou D et al The role of microRNA‐133b and its target gene FSCN1 in gastric cancer. J Exp Clin Cancer Res 2014; 33: 99. [DOI] [PMC free article] [PubMed] [Google Scholar]
- 23. Zhao Y, Huang J, Zhang L et al MiR‐133b is frequently decreased in gastric cancer and its overexpression reduces the metastatic potential of gastric cancer cells. BMC Cancer 2014; 14: 34. [DOI] [PMC free article] [PubMed] [Google Scholar]
- 24. Cheng Z, Liu F, Wang G, Li Y, Zhang H, Li F. miR‐133 is a key negative regulator of CDC42‐PAK pathway in gastric cancer. Cell Signal 2014; 26: 2667–73. [DOI] [PubMed] [Google Scholar]
- 25. Wen D, Li S, Ji F et al miR‐133b acts as a tumor suppressor and negatively regulates FGFR1 in gastric cancer. Tumour Biol 2013; 34: 793–803. [DOI] [PubMed] [Google Scholar]
- 26. Qiu T, Zhou X, Wang J et al MiR‐145, miR‐133a and miR‐133b inhibit proliferation, migration, invasion and cell cycle progression via targeting transcription factor Sp1 in gastric cancer. FEBS Lett 2014; 588: 1168–77. [DOI] [PubMed] [Google Scholar]
Associated Data
This section collects any data citations, data availability statements, or supplementary materials included in this article.
Supplementary Materials
Fig. S1. Expression of PKM1 and PKM2 in gastric cancer clinical samples.