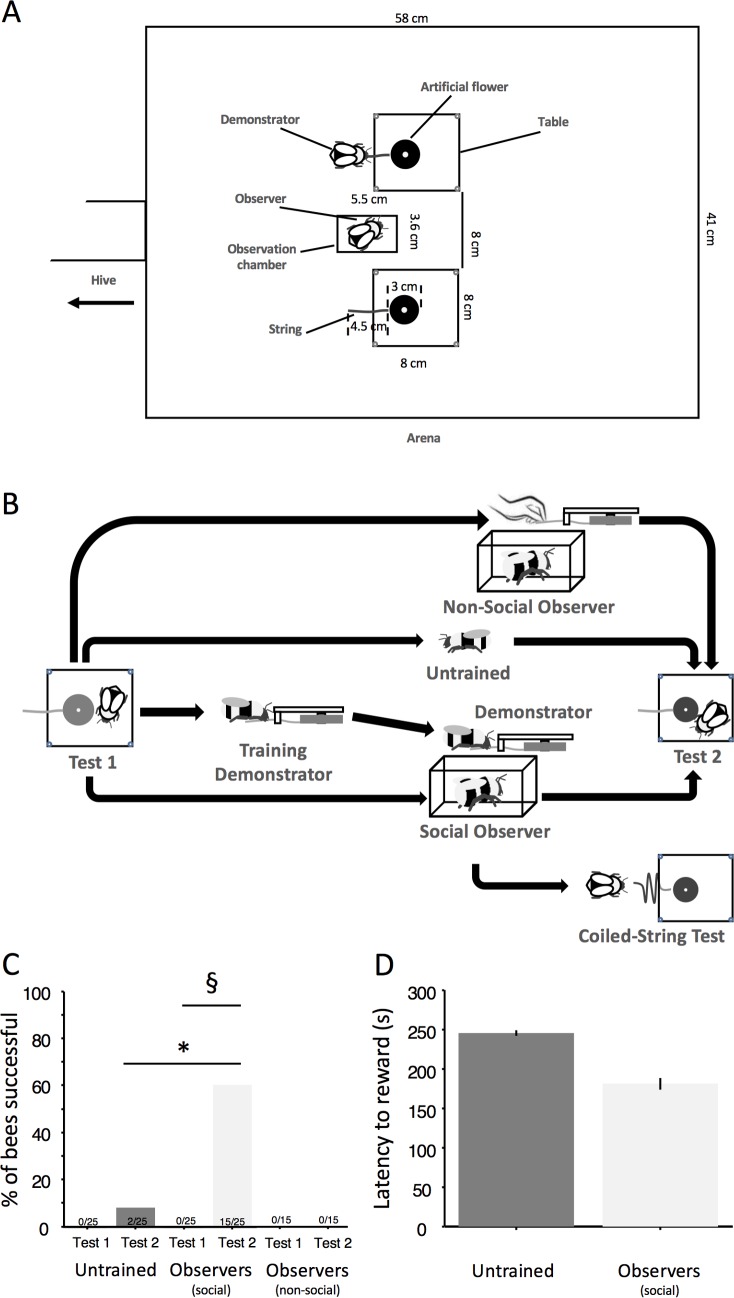
In Fig 2C, both Test 2 bars for Untrained and Observer (social) bees are slightly higher than they should be. Although the number inserts within the bars are correct (2/25 and 15/25) and the information within the manuscript text is reported accurately, the bars themselves are incorrect and should be at heights indicating 8% and 60%, respectively, as reported in the main text. There are no changes to the figure legend and the corrected figure has been provided here.
Fig 2. Social transmission of string pulling.
(A) Arena set up for the observation of string pulling. (B) The various testing procedures. Tests 1 and 2 were identical and consisted of giving 5 min to individual bees to solve the string pulling task. After having been trained to forage from blue artificial flowers, bees were tested a first time (Test 1). Then, demonstrators were trained (see Fig 1) and used to display string pulling (two instances, straight strings) during each of five foraging bouts to individual observers (n = 52) placed in a transparent Plexiglas cage. After the observation phase, 25 observers were tested again with the straight-string task (Test 2) and 27 with the coiled-string task. Fifteen different bees observed the flower moving without visible actor so that a forager could then obtain the sucrose solution (“Ghost control”) and, where tested, with the straight-string task subsequently. Untrained bees (n = 25) were also tested a second time with string pulling. (C) Percentage of successful untrained, social, and nonsocial observer bees in Tests 1 and 2. Asterisk: Fisher’s exact test, p ≤ 0.0001. Double S: McNemar test, χ21 = 13.067, p < 0.001. (D) Mean ± s.e. (s) latency in accessing the reward in untrained and observer bees. Observers’ latency was not different from that of the two “innovators” (Mann–Whitney U test, U15 = 6, p = 0.205), (see S1 Data).
Secondly, we report an incorrect value (N = 57) for the control colony #11 in Table 4 of the manuscript file and in the Results section, under the heading “The Spread of String Pulling in a Transmission Chain Experiment” (page 10 of the PDF). Fig 5 shows the correct number of nodes indicating the colony size (N = 66) and all related data analyses use the correct value.
Table 4. Experiment Summary Table.
Summary of all experiments, including name, number of colony or colonies used, sample size, and success rate of observed individuals.
| Experiment | Colony | Success rate N |
|---|---|---|
| String-Pulling Training | 1 | 23/40 |
| Solution of String Pulling by Untrained Bees (Test 1) | 1–11 | 0/291 |
| Solution of String Pulling by Untrained Bees (Test 2) | 1, 9–11 | 2/135 |
| Perceptual feedback in demonstrators with little experience | 2 | 2/15 |
| Perceptual feedback in demonstrators with extensive experience | 2 | 11/15 |
| Social Observation | 1 | 15/25 |
| “Ghost Control” | 3 | 0/15 |
| Stimulus Enhancement | 4 | 0/14 |
| Coiled-String Experiment in Observers | 5 | 0/27 |
| Coiled-String Experiment in Trained Demonstrators | 5 | 3/8 |
| Transmission Chain Experiment (with seeded demonstrator) | 6 | 25/47 |
| 7 | 17/29 | |
| 8 | 12/28 | |
| Transmission Chain, Control (without seeded demonstrator) | 9 | 0/51 |
| 10 | 0/58 | |
| 11 | 0/66 |
The corrected text and Table 4 can be found here.
“After only 150 paired foraging bouts, a large proportion of each of the test colonies’ forager population (Colony 6: n = 25/47, Colony 7: n = 17/29, Colony 8: n = 12/28) learnt to string pull, whereas none of the control colony foragers (Colony 9, 10, 11: n = 51, 58, 66) learnt to pull the string (Fig 5, Materials and Methods, S13–S18 Videos).”
These corrections do not change the results or conclusions of the paper.
Reference
- 1.Alem S, Perry CJ, Zhu X, Loukola OJ, Ingraham T, Søvik E, et al. (2016) Associative Mechanisms Allow for Social Learning and Cultural Transmission of String Pulling in an Insect. PLoS Biol 14(10): e1002564 doi:10.1371/journal.pbio.1002564 [DOI] [PMC free article] [PubMed] [Google Scholar]


