Abstract
Organisms use circadian clocks to generate 24‐h rhythms in gene expression. However, the clock can interact with other pathways to generate shorter period oscillations. It remains unclear how these different frequencies are generated. Here, we examine this problem by studying the coupling of the clock to the alternative sigma factor sigC in the cyanobacterium Synechococcus elongatus. Using single‐cell microscopy, we find that psbAI, a key photosynthesis gene regulated by both sigC and the clock, is activated with two peaks of gene expression every circadian cycle under constant low light. This two‐peak oscillation is dependent on sigC, without which psbAI rhythms revert to one oscillatory peak per day. We also observe two circadian peaks of elongation rate, which are dependent on sigC, suggesting a role for the frequency doubling in modulating growth. We propose that the two‐peak rhythm in psbAI expression is generated by an incoherent feedforward loop between the clock, sigC and psbAI. Modelling and experiments suggest that this could be a general network motif to allow frequency doubling of outputs.
Keywords: circadian clock, cyanobacteria, mathematical modelling, network motifs, single‐cell time‐lapse microscopy
Subject Categories: Network Biology, Quantitative Biology & Dynamical Systems
Introduction
Most organisms have evolved a circadian clock to anticipate the earth's cycles of light and dark (Doherty & Kay, 2010). The clock can drive downstream gene expression throughout the day and night with a 24‐h rhythm. In mammals, the clock modulates multiple processes from sleep/wake activity to feeding cues (Mohawk et al, 2012). In plants, the clock can control photosynthesis, leaf movement and hypocotyl elongation (McClung, 2006; Millar, 2015). Eukaryotic and prokaryotic algae have also evolved a circadian clock to coordinate downstream processes (Cohen & Golden, 2015; Noordally & Millar, 2015).
Circadian clocks can generate rhythms with periods other than 24 h. Recent work has revealed two peaks of activation per circadian cycle in a subset of genes in the mammalian suprachiasmatic nucleus (Pembroke et al, 2015). 12‐h oscillations have also been observed in peripheral mammalian tissues, including the liver (Hughes et al, 2009; Cretenet et al, 2010), bone marrow (Chen et al, 2000) and testis (Liu et al, 2007) in mice. The circadian clock also appears to play a role in generating the approximately 12‐h circa‐tidal rhythm observed in some marine animals (Wilcockson & Zhang, 2008; Zhang et al, 2013). Computational analysis has suggested that joint regulation by two circadian factors with distinct phases could enable frequency doubling, with an over‐representation of predicted binding sites for pairs of circadian factors found in the promoters of genes that display 12‐h oscillations in mammals (Westermark & Herzel, 2013). Indeed, the product of pairs of circadian sinusoidal terms yields 12‐h harmonics when the amplitudes of the two inputs are similar and their phases meet certain conditions (Korenčič et al, 2012; Westermark & Herzel, 2013). However, it remains unclear how gene circuitry couples with the circadian clock to generate 12‐h rhythms in vivo.
The circadian clock circuit in the cyanobacterium Synechococcus elongatus PCC 7942 is an ideal model system to address the question of how the clock can generate such complex downstream gene expression. The core clock network is compact and well characterised (Johnson et al, 2011). Although simple, the clock coordinates key cellular processes throughout the day and night (Markson et al, 2013), including cell division (Dong et al, 2010), metabolism (Pattanayak et al, 2014; Diamond et al, 2015) and photosynthesis (Markson et al, 2013; Cohen & Golden, 2015). Nearly all transcripts in Synechococcus elongatus oscillate with a circadian rhythm (Liu et al, 1995; Ito et al, 2009). An additional advantage of this model system is that clock activity can be quantitatively analysed at the level of individual cells, using time‐lapse microscopy of fluorescent reporters (Chabot et al, 2007; Dong et al, 2010; Teng et al, 2013).
The key components of the circadian clock in cyanobacteria have already been elucidated. The core network consists of just three proteins (KaiA, KaiB and KaiC) that generate a 24‐h oscillation in KaiC phosphorylation (Ito et al, 2007; Rust et al, 2007; Cohen & Golden, 2015). This oscillation has even been reconstituted in vitro (Nakajima et al, 2005). The phase of the clock is transmitted to downstream gene expression by the global regulator RpaA (Markson et al, 2013). Global analysis of target genes of the clock has revealed populations of genes that peak at dawn or dusk (Vijayan et al, 2009). However, it remains unclear what range of circadian gene expression profiles can be generated in cyanobacteria and by what mechanisms.
Synechococcus elongatus and other cyanobacteria have multiple group 2 sigma factors (Gruber & Gross, 2003), which have been suggested to provide a mechanism for modulating clock target gene expression. For example, the key photosynthesis gene psbAI has been shown to be regulated by both the clock and the alternative sigma factor sigC (Nair et al, 2002). psbAI encodes one form of the protein D1 (D1:1), which is essential for the initiation of photosynthesis and lies at the core of the photosystem II complex (Golden, 1995). A sigC deletion was shown to cause period lengthening of psbAI rhythms, but not of the KaiC oscillator, suggesting the possibility of multiple oscillators in one cell (Nair et al, 2002).
In this work, we examine a reporter for psbAI activity at the single‐cell level through time. We reveal a doubling of the frequency of peaks in psbAI expression compared to the circadian clock, going from one to two peaks per circadian cycle. This two‐peak oscillation was likely obscured in previous studies due to bulk averaging effects. We also observe two peaks of elongation rate per day, suggesting a physiological role in controlling growth for the frequency doubling. We go on to show through a combination of experiment and modelling that this two‐peak oscillation is driven by an incoherent feedforward loop between the KaiC oscillator and sigC. We show that this network allows modulation of psbAI expression levels in low light conditions, and also find another gene, rpoD6, whose behaviour is modulated by the same network. Our work suggests that the cyanobacterial clock can couple with multiple downstream gene circuits to enable the generation of complex gene regulation.
Results
Time‐lapse movies of psbAI expression reveal two‐peak circadian oscillations
To analyse psbAI expression dynamics, we constructed a reporter strain incorporating a yellow fluorescent reporter (yfp) for psbAI expression and used quantitative time‐lapse microscopy to examine PpsbAI‐YFP levels in single cells. The yfp was tagged with a degradation tag (LVA) to enable tracking of fast cellular dynamics (Chabot et al, 2007). We first measured psbAI expression dynamics under constant 15 μE m−2 s−1 light conditions (Materials and Methods). Our time‐lapse movies revealed that PpsbAI‐YFP expression oscillates with a double‐peak oscillation at the single‐cell level (Figs 1A and EV1, and Movie EV1). Our single‐cell approach was critical in revealing the double peak. Due to desynchronisation between cells, if we averaged all traces from three experiments (10 movies in total) the double peak was obscured (Fig 1A, red dashed trace).
Figure 1. psbAI expression shows two peaks per circadian cycle.
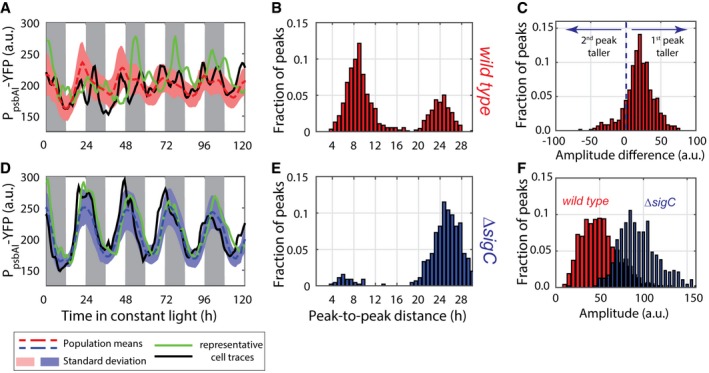
- Time traces of PpsbAI‐YFP reporter grown under constant low light (ca. 15 μE m−2 s−1 cool white light). Individual lineages (black and green lines) show the existence of a second peak following the first (dusk timed) peak of expression. Owing to cell‐to‐cell desynchronisation, this second peak is often hidden when expression is measured at the population level (dashed red line, with pink shades representing one standard deviation from the mean). The white and grey shades represent subjective day and subjective night, respectively. 1,319 cells from 10 movies (with up to 419 cells per time point) were collected.
- Measure of the distance between the first peak in each circadian cycle and the following peak. The majority of peak pairs occur in the same circadian cycle, with a mean peak‐to‐peak distance of ca. 9 h within this subpopulation.
- Distribution of the difference in peak amplitudes between the first and second peaks in a circadian cycle (for cycles where a double peak is present). The second peak is, on average, smaller in amplitude than the first peak.
- Neither single‐cell traces nor a population average of psbAI expression shows a double peak in a sigC deletion strain (lines and shades as in A). 1,088 cells from eight movies (with up to 419 cells per time point) were collected.
- Measure of the distance between the first peak in each circadian cycle and the following peak shows that the vast majority of lineages have one peak of expression per day.
- Distribution of peak amplitudes in wild‐type and sigC deletion strains shows that sigC negatively regulates psbAI expression.
Source data are available online for this figure.
Figure EV1. Single‐cell lineages from two movies of psbAI expression show two‐peak oscillations.
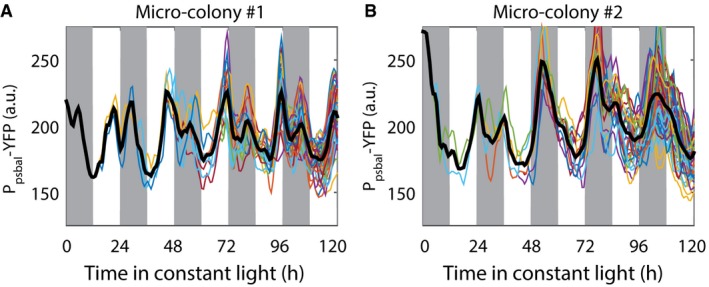
- Time traces of PpsbAI‐YFP reporter strains grown under low light (ca. 15 μE m−2 s−1 cool white light). Individual lineages show the existence of a secondary peak following the main (dusk timed) peak of expression. Cells remain synchronised, allowing double peak to be observed in the mean trace (black line).
- In a different movie, due to desynchronisation, the double peak is less apparent in the mean trace (black line).
We next examined the nature of the second peak in more detail. We carried out an analysis of peak‐to‐peak distances within each lineage. A distance of ca. 24 h represents a single peak per circadian cycle. However, we observe that a second peak of PpsbAI‐YFP expression often occurs approximately 9 h after the first peak, although there is variability from cell to cell (Fig 1B). We also found that the second peak is, on average, smaller in amplitude than the first (Fig 1C).
sigC is required for two‐peak oscillations of psbAI expression
Previous work has shown that as well as being regulated by the circadian clock, psbAI is regulated by the alternative sigma factor sigC (Nair et al, 2002). To test whether sigC is responsible for the two‐peak oscillation in psbAI expression that we observed, we generated a PpsbAI‐YFP reporter in a sigC deletion background and repeated our time‐lapse analysis. In this mutant background, we observe a single circadian oscillation in psbAI expression (Fig 1D). The single‐cell traces display similar dynamics to the average trace from all experiments (Fig 1D, blue dashed, black and green lines), and peaks of expression occur on average 24 h apart in the majority of single cells (Fig 1E). The amplitude of the PpsbAI‐YFP oscillations increased in the sigC deletion background, consistent with sigC negatively regulating psbAI expression (Fig 1F; Nair et al, 2002).
Double peaks of psbAI expression are correlated with double peaks in cellular growth
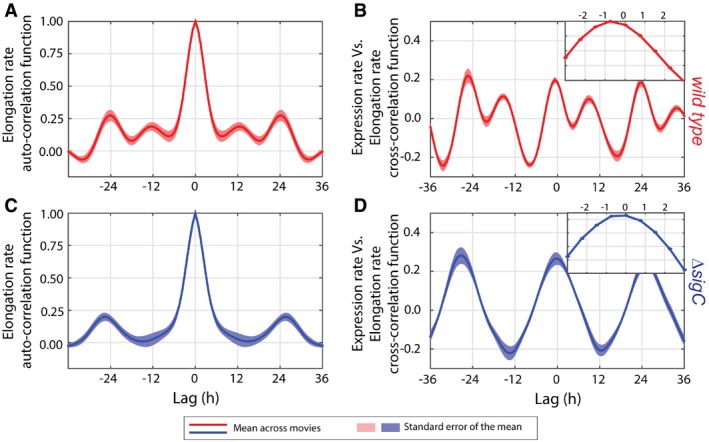
We next asked whether we could observe any physiological effect of the double peak of psbAI expression. psbAI encodes the D1:1 form of the photosystem II reaction centre protein D1, which is the dominant form of the photosystem under the light levels used in this study (Clarke et al, 1993). As the D1:1 protein is unstable (Clarke et al, 1993), we hypothesised that two peaks of psbAI expression could result in two peaks of D1:1, and so correlate with two peaks in growth per circadian cycle. To test this, we calculated instantaneous single‐cell elongation rates in both wild‐type and sigC deletion backgrounds (Materials and Methods). Synechococcus elongatus cells are rod shaped, growing essentially only in one direction, and so the elongation rate is a good proxy for the cellular growth rate. Although variable, the mean elongation rate for each movie shows evidence of sigC‐dependent double peaks in growth (Appendix Fig S1). To investigate this further, we computed the auto‐correlation function of the single‐cell elongation rates for each movie. The auto‐correlation function peaks at lags of ca. ± 24 h, and also at lags of ± 12 h in the wild‐type background (Fig 2A), providing evidence of two peaks of circadian growth per day. However, in the sigC deletion background, the auto‐correlation function only peaks at lags of ± 24 h (Fig 2C), showing that there is a single peak of growth per circadian cycle.
Figure 2. Two‐peak circadian oscillations in growth can be observed in wild‐type cells.
-
AMean auto‐correlation function of the elongation rate from nine movies (we removed one movie from the analysis as it ended after just 80 h) of the strain carrying the PpsbAI‐YFP reporter in a wild‐type background shows daily double peaks.
-
BMean cross‐correlation function between expression rate of PpsbAI‐YFP and elongation rate shows daily double peaks and a ca. 1‐h delay of the elongation rate relative to the expression rate (inset with zoom‐in of the mean trace between lags of −3 h and 3 h).
-
C, DBoth the mean auto‐correlation function of the elongation rate (C) and the cross‐correlation function between expression rate and elongation rate (D) from eight movies in a sigC deletion background show a single peak per circadian cycle. However, the elongation rate has a similar delay of ca. 1 h relative to the expression rate (D, inset).
To further understand the link between psbAI expression and growth, we computed the cross‐correlation function (Dunlop et al, 2008) between the expression rate (obtained by differentiating the PpsbAI‐YFP signal) and the elongation rate. We focus on the expression rate to be able to examine correlations on a fast timescale without the confounding factor of the degradation rate of the YFP reporter. The cross‐correlation function peaks twice per circadian cycle and is near symmetrical in the wild type, showing the expression rate of psbAI and the elongation rate are positively correlated with only a very small lag (Fig 2B). The cross‐correlation function peaks about 1 h before the origin (zero lag), implying significant changes in psbAI expression are reflected in changes in the growth rate 1 h later (Fig 2B, inset). We observe a similar pattern of temporal correlation between the two rates in a sigC deletion background, but only one peak per circadian cycle is present (Fig 2D). This suggests that two‐peak oscillations in psbAI expression could play a functional role by tuning downstream processes that affect elongation rate.
sigC shows a single circadian peak of expression at the single‐cell level
Due to sigC's role in generating the second peak in psbAI expression, we asked whether double peaks are already present at the level of sigC expression. We constructed a reporter for sigC expression (PsigC‐YFP) and repeated our analysis at the single‐cell level. This reporter was also tagged with a degradation tag (LVA) (Chabot et al, 2007). We found that PsigC‐YFP expression oscillates with a single circadian peak, and with single‐cell traces that display similar dynamics to the average trace from all experiments (Fig 3A, red dashed, black and green lines, Appendix Fig S2 and Movie EV2). Peaks in sigC expression occur 24 h apart (Fig 3B). We also examined PsigC‐YFP dynamics in a sigC deletion background. Again, we observed a single circadian peak, the amplitude of which was approximately 3.5 times larger than in the wild‐type case (Figs 3C and D, and EV2A). This fold change implies that SigC negatively regulates its own expression, reducing the amplitude of the PsigC‐YFP oscillation.
Figure 3. sigC single‐cell traces do not show a double peak, but show that sigC is negatively auto‐regulated.
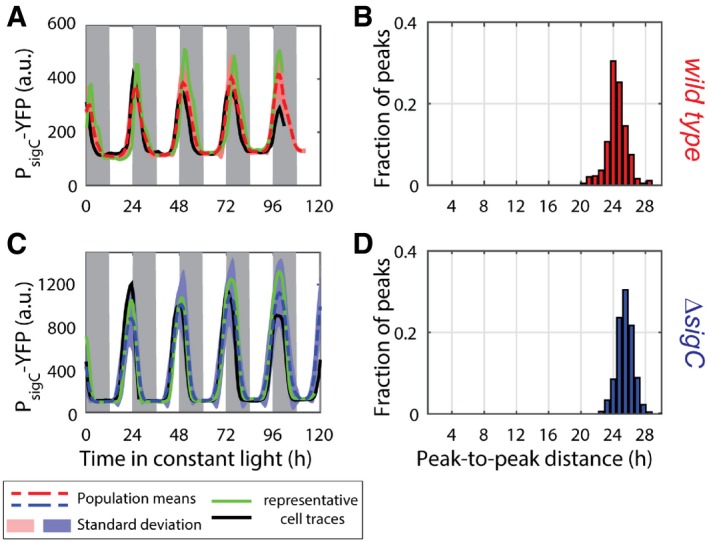
- Neither single‐cell traces nor a population average of a reporter for sigC, PsigC‐YFP, shows a double peak of expression. 664 cells from nine movies (with up to 213 cells per time point) were collected.
- Measure of the distance between the first peak in each circadian cycle and the following peak confirms that there is only one peak per circadian cycle.
- The amplitude in sigC expression is raised by 3.5‐fold in a sigC knock‐out strain, consistent with a sigC‐negative auto‐regulation. 1,084 cells from six movies (with up to 352 cells per time point) were collected.
- Measurement of the distance between the first peak in each circadian cycle and the next peak confirms that there is only one peak per circadian cycle.
Figure EV2. PsigC‐YFP levels are upregulated in high light, suggesting a reduced functionality of SigC in higher light conditions.
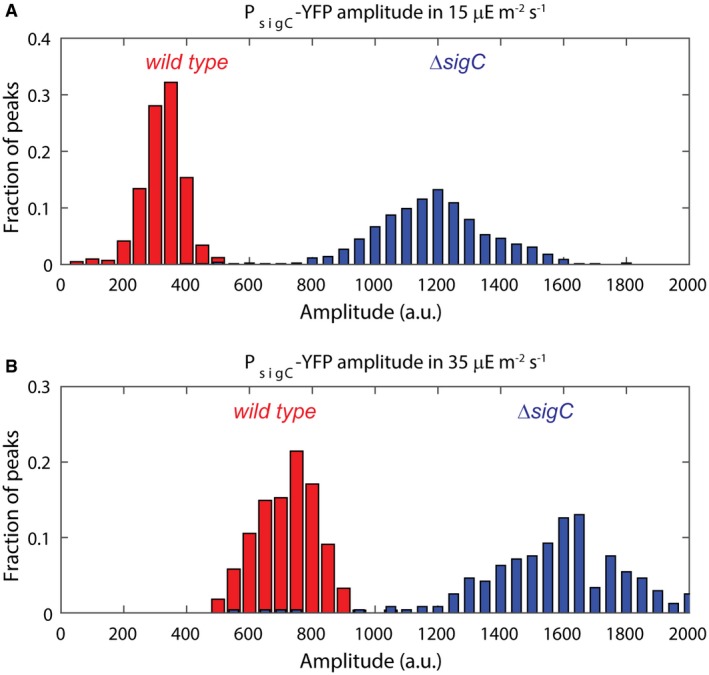
- Histogram of PsigC‐YFP expression in wild‐type (red) and sigC deletion mutant (blue) under ca. 15 μE m−2 s−1 cool white light. For the wild type, 664 cells from nine movies were collected, whereas for the sigC deletion strain, 1,084 cells from six movies were collected.
- Histogram of PsigC‐YFP expression in wild‐type (red) and sigC deletion mutant (blue) under ca. 35 μE m−2 s−1 cool white light. PsigC‐YFP in wild type is upregulated by twofold between light conditions. A smaller fold change of 1.2 is seen in the sigC deletion mutant. In the higher light condition, 1,003 cells from two movies were collected for the wild‐type strain, whereas 920 cells from two movies were collected for the sigC deletion strain.
Source data are available online for this figure.
To test whether our observed dynamics of psbAI are solely due to sigC and the circadian clock, we next examined PpsbAI‐YFP dynamics in a clock deletion background, and in a clock‐sigC double deletion background. Clock deletion strains were generated by disrupting the kaiBC operon, which encodes the proteins KaiB and KaiC. No oscillation remains in mean PpsbAI‐YFP levels in these lines (Appendix Fig S3A), suggesting that the dominant regulation of psbAI is through sigC and the clock. However, we do observe desynchronised fluctuations in psbAI expression in the kaiBC deletion backgrounds at the single‐cell level (Appendix Fig S3B and C). The fluctuations of psbAI expression in clock deletion backgrounds are due to a dip of expression around the time of cell division (Appendix Fig S4). This suggests that the circadian clock can either damp or override cell cycle‐related fluctuations in gene expression.
An oscillatory feedforward loop generates two‐peak oscillations in psbAI expression
Based on our perturbation experiments, we hypothesised that an oscillatory feedforward loop between sigC and the circadian clock could be generating the observed dynamics (Fig 4A). The clock regulates both psbAI (Appendix Fig S3) and the intermediate factor SigC (Fig 3A), which also regulates psbAI (Fig 1D–F). The two arms of this joint regulation have opposite signs—the clock promotes psbAI expression whilst sigC inhibits it—thus forming an incoherent feedforward loop (Milo et al, 2002). Previous theoretical work has suggested that similar motifs, based on regulation by two factors, could enable frequency doubling of expression peaks in outputs of the circadian clock (Westermark & Herzel, 2013). We asked, with a simple mathematical model, whether a circuit consisting of an oscillatory feedforward loop between sigC and the clock and an autoregulatory feedback loop on sigC (Fig 3) could generate the observed dynamics of psbAI expression. To do this, we constructed a minimal phenomenological model of the system. The model consisted of a sinusoidal curve representing the output of the circadian clock,
| (1) |
(where b is the basal level of the clock signal, A is its maximum, and ω is the angular frequency), and Hill equation terms for the activation dynamics of sigC and psbAI (Fig 4A). The ordinary differential equations for these two species take the general form
| (2) |
where ϒ is the dilution‐degradation rate and f x is the production rate, which is defined as
| (3) |
Figure 4. A minimal mathematical model, containing an incoherent feedforward loop modulated by an oscillatory signal, reproduces the experimental observations.
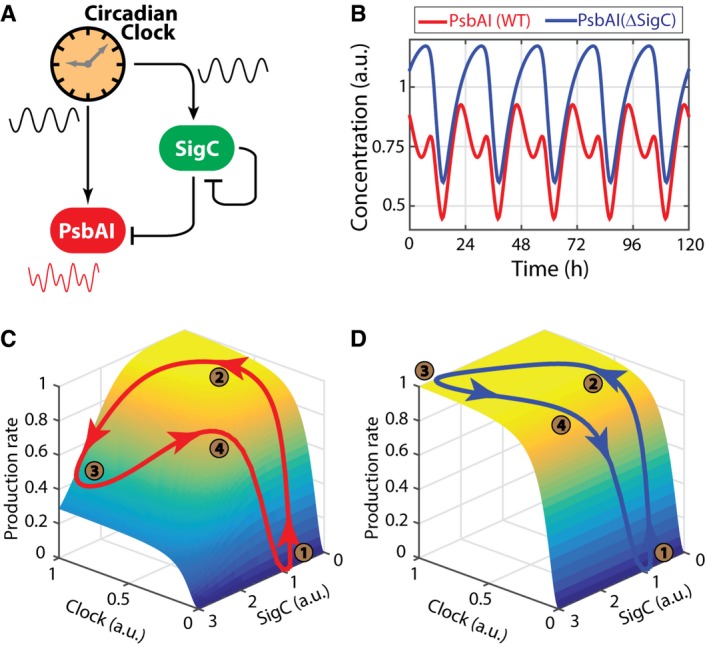
- Schematics of the proposed regulatory network. The circadian clock regulates both PsbAI and SigC, and SigC represses both PsbAI and itself. Since the circadian clock regulates PsbAI through two separate branches of opposite signs, one of which is mediated by an intermediate gene, this network contains an incoherent feedforward loop motif.
- Numerical simulations of the wild‐type network show double peaks of expression (red line), and numerical simulations of a SigC knock‐out model (in which the terms representing the regulation of PsbAI by SigC are set to zero) show only single‐peaked oscillations (blue line).
- The trajectory of the normalised production rate of PsbAI in the wild‐type (red line) simulation shows the dependence of the double peak on the states of the clock and SigC. The surface represents the two‐input production rate function. When the levels of both the clock and SigC are low, the production rate is also low (time point 1, brown circle). As the state of the clock rises, the production rate follows and reaches a plateau (time point 2, which corresponds to the main peak of PsbAI in panel B). However, SigC also rises, crossing a threshold and overcoming the clock, thus imposing a trough in the production rate (time point 3). Later, SigC drops low enough to relieve its negative regulatory activity, and the production rate reaches a second peak (time point 4).
- In the SigC deletion simulation (the terms representing the regulation of PsbAI by SigC are set to zero, but SigC expression is tracked for reference), the production rate of PsbAI only responds to the clock, which is a single‐peak oscillation, and so the trajectory of the production rate (blue line) only has a single peak itself (the plateau where time points 2, 3 and 4 lie).
In equation (3), V x is the maximal production rate, u 1 and u 2 are regulatory inputs, and h 1 and h 2 are Hill coefficients. In the model, we assume that the negative regulation of sigC on psbAI and on itself is direct through an active form of SigC (see Section II in Appendix for full details of the model), although it is likely that there are intermediate steps given that sigma factors normally positively regulate transcription. The model was able to produce the qualitative behaviour seen in experiments, for both wild‐type and mutant backgrounds (Fig 4B–D). We next tested what role the sigC auto‐regulatory feedback loop plays in the dynamics. Unlike the regulation of SigC on psbAI, in our model the feedback of sigC on itself is not required to generate the two‐peak oscillation (Section III in Appendix), but it adds an extra level of control to the circuit, allowing it to generate double peaks of expression more easily (Appendix Fig S5).
Light levels modulate the strength of the second peak in psbAI expression
We next examined whether environmental conditions affect the double peak in PpsbAI‐YFP, and whether this could be accounted for by the model. We examined the behaviour of our single‐cell reporters for psbAI and sigC under higher constant light conditions (ca. 35 μE m−2 s−1), and again tracked single‐cell behaviour. We found that under these higher light conditions the psbAI waveform was closer to a single‐peak rather than a two‐peak oscillation (Fig 5A). We carried out an analysis of peak‐to‐peak distances within each lineage and found the dominant mode was one peak per circadian cycle (Fig 5B). The sigC deletion had little effect on the dynamics of psbAI expression under these conditions (Fig 5C and D). This suggests that the regulation of psbAI by sigC is attenuated at higher light levels, resulting in single‐peak oscillations.
Figure 5. The double peak in expression of psbAI is largely lost at higher light conditions.
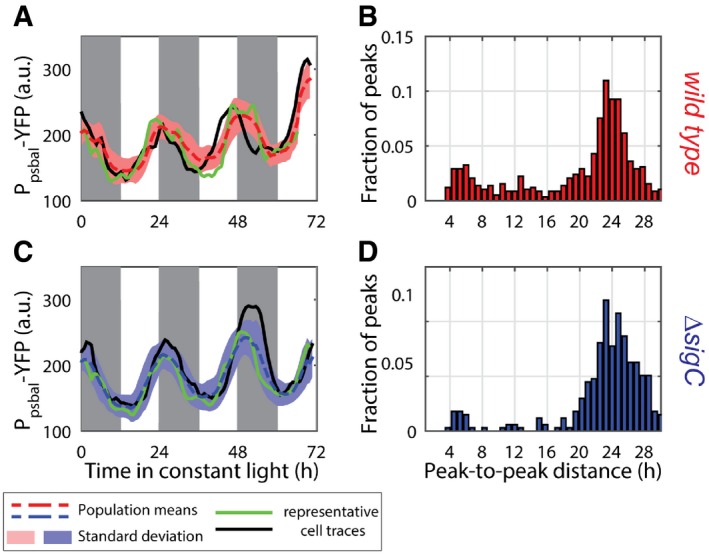
- Time traces of PpsbAI‐YFP reporter grown under ca. 35 μE m−2 s−1 cool white light. Most individual lineages (black and green lines) show one circadian peak of gene expression. 2,601 cells from eight movies (with up to 776 cells per time point) were collected.
- Measure of the distance between the first peak in each circadian cycle and the following peak shows a single peak per day is the dominant mode.
- Time traces of PpsbAI‐YFP reporter in a sigC deletion background look similar to the wild type. 2,306 cells from five movies (with up to 623 cells per time point) were collected.
- Measure of peak‐to‐peak distance shows a single circadian peak.
We also observed that the expression of PsigC‐YFP is increased under these light levels (Fig EV2), consistent with a reduction in the repressive activity of sigC. If we model a reduction in SigC activity in our simple model, we also observe a reduction in the strength of the second peak in psbAI (Fig EV3). This suggests that the balance between the two arms of the incoherent feedforward loop can set the strength of the two‐peak oscillation. To confirm that the two‐peak oscillation in psbAI is not specific to 15 μE m−2 s−1, we also carried out time‐lapse microscopy of PpsbAI‐YFP at lower light levels of ca. 10 μE m−2 s−1. Again, we observed a double peak in psbAI expression (Appendix Fig S6). Our work suggests that the multi‐frequency oscillation in psbAI expression could allow sensitive regulation of photosynthesis at low light levels.
Figure EV3. Simulations of reduced SigC activity at high light qualitatively match experimental data.
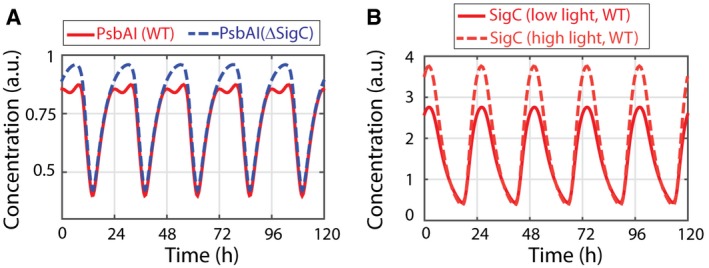
- Increasing the deactivation rate of SigC by two orders of magnitude produces only a minor double peak in PsbAI expression. This is comparable to that observed experimentally in higher light conditions (Fig 5A).
An oscillatory feedforward loop can be a general motif to allow control of complex downstream gene expression
Our simulations suggest that the oscillatory feedforward motif should be able to generate a range of output dynamics, from 24‐h single‐peak oscillations to 12‐h two‐peak oscillations of near equal size (Appendix Fig S7). Between these two extremes, the simulations suggest that the strength of the double peak can be modulated by varying regulatory parameters, such as the thresholds and degrees of cooperativity in transcriptional activation. These parameters may therefore vary between different promoters. To test the generality of the motif, we examined the single‐cell dynamics of the other group 2 sigma factors in cyanobacteria to test for signs of a two‐peak oscillation. We chose the group 2 sigma factors as a starting point because sigma factors are known to cross‐regulate (Nair et al, 2002; Imamura & Asayama, 2009). We observed double peaks in the expression dynamics of one of the group 2 sigma factors, rpoD6 (using a PrpoD6‐YFP reporter line with the fast degradation LVA tag), at the single‐cell level (Fig 6A). However, when compared to the double peak in psbAI expression (Fig 1A), the second peak in rpoD6 expression was weaker (Fig EV4), often degenerating into a single‐peak oscillation with a shoulderlike feature. These dynamics can be captured in our model by changing a parameter that affects only the interaction between the clock and rpoD6 (Fig 6C). We repeated our analysis in a sigC deletion strain, and again observed that the multi‐peak modulation is sigC dependent (Fig 6B and C). This suggests that the oscillatory feedforward loop motif can be a general mechanism for peak modulation and frequency doubling in circadian clocks.
Figure 6. The clock‐sigC circuit represents a general mechanism to generate multi‐peak oscillations in oscillatory networks.
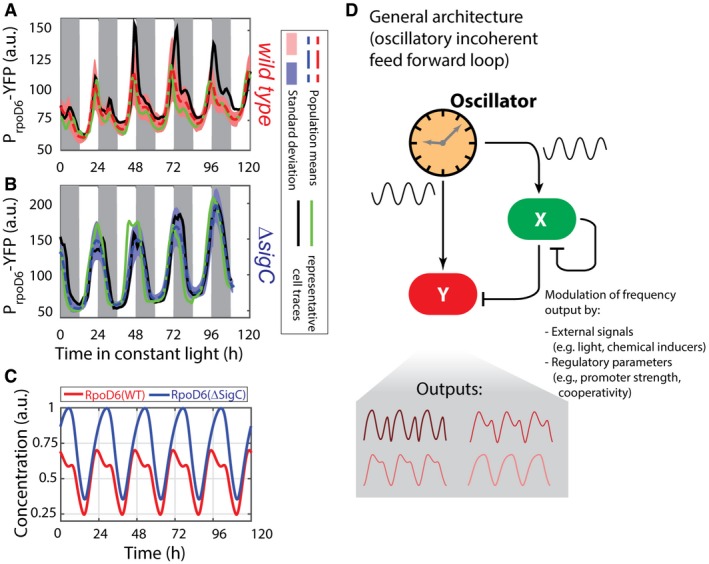
- Time traces of PrpoD6‐YFP reporter grown under low light conditions (ca. 15 μE m−2 s−1 cool white light). Individual lineages (black and green lines) show the existence of a shoulder or a secondary peak of reduced prominence when compared to PpsbAI‐YFP. 947 cells from 12 movies (with up to 272 cells per time point) were collected. Pink shades represent one standard deviation from the mean.
- Time traces of PrpoD6‐YFP reporter in a sigC deletion background show only a smooth single‐peaked oscillation. 1,352 cells from seven movies (with up to 502 cells per time point) were collected. Light blue shades represent one standard deviation from the mean.
- Numerical simulations of the RpoD6 wild‐type network show a shoulder of expression trailing the main peak (red line). All the parameters describing the clock and SigC are as in Fig 4B, and only the threshold of activation of the rpoD6 promoter by the clock was modified. Numerical simulations of a SigC knock‐out model (in which the terms representing the regulation of RpoD6 by SigC are set to zero) show only single‐peaked oscillations (blue line).
- The incoherent feedforward loop circuit that regulates rpoD6 and psbAI is capable of generating diverse oscillatory dynamics in vivo and in silico. Networks where a target gene (Y) is co‐regulated by an oscillator and another regulator (X, which itself is regulated by the oscillator) may represent a general mechanism for generating multi‐peak oscillations.
Figure EV4. Double peaks in PrpoD6‐YFP expression are dependent on sigC .
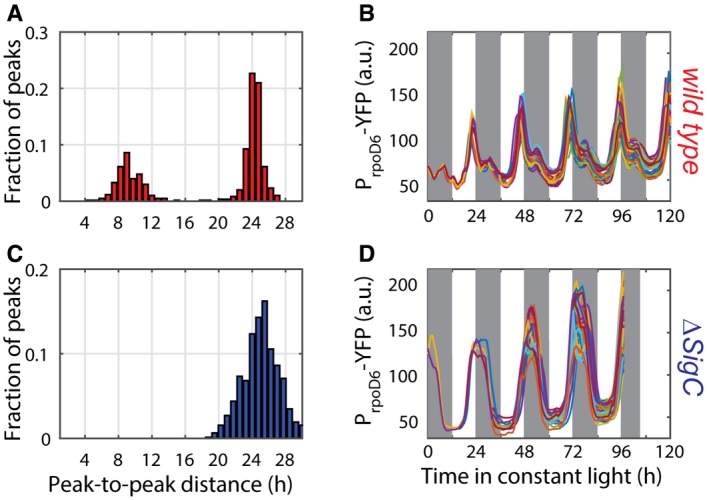
- Measure of the distance between the first peak in each circadian cycle and the following peak shows only a subfraction of cells display a double peak. 947 cells from 12 movies (with up to 272 cells per time point) were collected.
- Single‐cell lineages of a representative movie show that all lineages show either a second peak, or a shoulderlike feature, in PrpoD6‐YFP levels.
- In the sigC deletion mutant, the two‐peak oscillations are abolished. 1,352 cells from seven movies (with up to 502 cells per time point) were collected.
- Single‐cell lineages of a representative movie show a single peak of PrpoD6‐YFP.
Source data are available online for this figure.
Discussion
Here, we report a novel dynamic behaviour of the cyanobacterial circadian clock, frequency doubling of outputs, and reveal a surprisingly simple and general mechanism for generating it. Using quantitative single‐cell microscopy and a fluorescent reporter for psbAI expression, we found that psbAI is expressed with a two‐peak circadian oscillation under constant low light conditions (Fig 1). This type of modulation of clock frequency has been observed in downstream outputs of the more complex mammalian circadian clock, although the mechanism remains elusive (Hughes et al, 2009; Westermark & Herzel, 2013; Pembroke et al, 2015). At the population level, these dynamics can be obscured due to desynchronisation, emphasising the value of examining gene circuit dynamics at the single‐cell level (Martins & Locke, 2015; Fig 1A). We observe two circadian peaks of growth (Fig 2), as well as psbAI expression, showing a physiological effect of the frequency doubling in gene expression.
The complex gene regulation of psbAI can be generated by a simple gene circuit motif (Fig 4). An oscillatory incoherent feedforward loop between the circadian clock, sigC and psbAI allows the 24‐h oscillator to generate a two‐peak circadian oscillation in its output genes. The incoherent feedforward loop is one of the most common network motifs, appearing hundreds of times in bacteria and yeast (Milo et al, 2002; Shen‐Orr et al, 2002). Under a steplike input, the incoherent feedforward motif has been shown to generate a pulse in downstream gene expression (Mangan & Alon, 2003; Basu et al, 2004). It can also enable fold change detection in gene regulation (Goentoro et al, 2009). Although these functions of feedforward loops have been analysed, the role of feedforward loops as modulators of oscillations is less explored, and only suggested theoretically (Cerone & Neufeld, 2012). In this work, we identified experimentally a new function for the incoherent feedforward loop in enabling frequency doubling. It will be exciting to see the range of uses cells can make for this and related motifs in an oscillatory context.
The two‐peak oscillation in psbAI expression is modulated by light conditions (Fig 5), becoming more apparent under low light. Previous single‐cell bioluminescence studies using a luciferase reporter driven by the psbAI promoter displayed single‐peak oscillations under higher light conditions (100 μE m−2 s−1) (Mihalcescu et al, 2004), similar to what we observe under 35 μE m−2 s−1 light. However, in bioluminescence assays the signal for each data point is integrated over long windows during which ambient illumination is turned off (leading to lights being off for a large fraction of the day), so the conditions are not directly comparable to ours. The dynamic behaviours of the sigC‐clock motif appear therefore to be tuned not just by regulatory interactions, but also by the external environment. Further work should be carried out to understand how the motif is modulated by light. One hypothesis is that a reduction in SigC activity at higher light results in a reduction in the double peak. This idea is supported by experiments and our model (Figs EV2 and EV3), but requires further validation. Interestingly, light levels much higher than those used in our study resulted in the degradation of psbAI transcripts (Kulkarni et al, 1992). It will be important to observe how the clock‐sigC circuit interacts with other genetic and environmental modifiers of psbAI (Nair et al, 2002; Thomas et al, 2004).
Our observation that wild‐type cells can show two‐peak circadian oscillations in growth (Fig 2A and B) suggests a functional significance of frequency doubling, as the clock‐sigC circuit could enable tuning of growth under different environmental conditions. The circadian clock has been shown to have an adaptive benefit under light–dark cycles (Woelfle et al, 2004). Although our work focuses on the general mechanism of how frequency doubling of expression peaks can be generated, in future it will also be important to examine any possible adaptive benefit of the two‐peak oscillation in psbAI expression, under both varying levels of constant light and light–dark cycles.
psbAI encodes one form of the photosystem II reaction centre protein D1 (D1:1). Currently, it is difficult to probe D1:1 protein dynamics in single cells due to the perturbative effects of fusing reporter proteins to proteins of interest and the lack of single‐cell proteomics techniques in cyanobacteria. However, our observation of two peaks of circadian growth in the wild‐type background suggests that double peaks in D1:1 levels, as well as psbAI transcripts, could be possible in individual cells, particularly in the light of reports that the D1:1 protein is unstable, with a measured half‐life of approximately 50–60 min at 50 μE m−2 s−1 light (Clarke et al, 1993).
A simple mathematical model can recapture the dynamics observed (Fig 4). It suggests that modulation of some parameters, such as the production rate of the target gene, can modify the output oscillations of the feedforward loop from a two peak to a shoulder of gene expression (Fig 6D). Support for this model is provided by the fact that we can observe these two types of dynamics experimentally: two peaks in psbAI (Fig 1) and shoulder like in rpoD6 (Figs 6 and EV4), both dependent on sigC (Figs 1B and 6C). A synthetic approach where we tune, for example, the production rate of a target gene by modifying its promoter sequence, and verify whether we can switch between the two dynamic behaviours, would be a further test of the model.
An expansion of the model may, however, be required in order to understand published reports of period lengthening in sigC knock‐out strains (Nair et al, 2002). We also observed a small period lengthening effect in the sigC knock‐out strain. In the wild‐type background, we measured average peak‐to‐peak distances of 24.07 h for the single frequency mode of PpsbAI‐YFP (Fig 1B) and 24.43 h for PsigC‐YFP (Fig 3B). In the sigC knock‐out background, these average distances increase to, respectively, 25.66 h (Fig 1E) and 25.47 h (Fig 3D). This suggests there may be a feedback of SigC onto the clock. However, bulk measurements of expression of the KaiBC operon did not reveal period lengthening (Clerico et al, 2009) in sigC knock‐out backgrounds. Additionally, both KaiBC and sigC were recently found to be a direct target of RpaA, a global circadian regulator that is one of the major outputs of the clock (Markson et al, 2013). If feedback from sigC onto the clock exists, then it must operate downstream of RpaA, and extra components in the clock‐sigC‐psbAI circuit wait to be revealed. These extra components will not affect the mechanism of frequency doubling we describe here, as the incoherent feedforward loop will still be embedded in the circuit and drive two‐peak oscillations.
The cyanobacterial clock is seemingly much simpler than that of higher eukaryotes, which consists of multiple transcriptional and translational feedback loops (Bell‐Pedersen et al, 2005). Our work suggests that although the core of the cyanobacterial clock consists of just three interacting proteins, the clock couples with other pathways to generate complex downstream gene expression. SigC is one of at least nine alternative sigma factors in Synechococcus elongatus (Imamura & Asayama, 2009). It will be interesting to observe whether the other alternative sigma factors couple with the clock to produce specific dynamics in downstream targets. It will also be important to test whether higher eukaryotic clocks use similar network motifs to generate frequency doubling of peaks of expression in downstream targets.
Increasingly, oscillations in gene regulation are being observed in diverse cellular processes, with a wide range of regularity and periods. These include pulses in stress response genes, from sigB in B. subtilis (Locke et al, 2011) to p53 in mammals (Batchelor et al, 2011), and deterministic oscillations in genes, such as ERK, with nucleus to cytoplasm oscillations of 15 min (Shankaran et al, 2009). Understanding the rules of oscillatory gene regulation will become increasingly important. It will be interesting to observe whether other oscillatory circuits use similar circuit designs to modulate output frequency.
Materials and Methods
Bacterial strains, plasmids and DNA manipulations
Synechococcus elongatus strains were derived from the ATCC strain (ATCC® 33912™). Strains and plasmids used in this study are described in Tables 1 and 2, respectively. Briefly, a 500‐bp upstream region of psbAI's coding sequence, and 1,000‐bp upstream regions of both sigC's and rpoD6's coding sequences were amplified using primers that incorporated restriction enzyme sites compatible for cloning into a NS1 targeting vector, pAM2314 (a kind gift from Prof. Susan Golden). The promoter regions were put upstream of an SsrA(LVA)‐tagged YFP protein (Andersen et al, 1998; Chabot et al, 2007), which was constructed by adding a consensus LVA tag to the YFP coding region from plasmid pAM3685 (a kind gift from Prof. Susan Golden). Clock deleted versions of these reporter strains were generated by insertion of a gentamicin resistance cassette into the ORF of the kaiBC operon (the plasmid was a kind gift from Prof. Erin O'Shea). The plasmid carrying the interrupted gene with the antibiotic marker was transformed into the reporter strains. Complete allele replacement on all the chromosomal copies was checked through PCR. Deletion of sigC was achieved in a similar manner using a kanamycin resistance cassette from the vector pUC19. Reporter strains carrying both inactivated sigC and kaiBC were generated by sequential disruption of these genes through homologous recombination, and verified through PCR. The antibiotic levels used for the culturing of strains were as follows: 2 μg ml−1 spectinomycin/streptomycin for NS1‐based pAM2314 inserts, 5 μg ml−1 kanamycin for the sigC deletion mutants and 2 μg ml−1 gentamicin for kaiBC deletion mutants.
Table 1.
Strains used in this study
| Synechococcus elongatus strain | Genetic background | Reporter (Integration site) | Antibiotic resistance | Source |
|---|---|---|---|---|
| 7942_A1 | WT | None | None | ATCC |
| 7942_S19 | WT | PpsbAI::YFP_LVA (NS1) | Spr,Str | This study |
| 7942_A50 | ΔsigC | PpsbAI::YFP_LVA (NS1) | Spr,Str,Kanr | This study |
| 7942_A52 | ΔkaiBC | PpsbAI::YFP_LVA (NS1) | Spr,Str,Gentr | This study |
| 7942_A51 | ΔsigC,ΔkaiBC | PpsbAI::YFP_LVA (NS1) | Spr,Str,Kanr,Gentr | This study |
| 7942_A4 | WT | PsigC::YFP_LVA (NS1) | Spr,Str | This study |
| 7942_A57 | ΔsigC | PsigC::YFP_LVA (NS1) | Spr,Str,Kanr | This study |
| 7942_A10 | WT | PrpoD6::YFP_LVA (NS1) | Spr,Str | This study |
| 7942_A60 | ΔsigC | PrpoD6::YFP_LVA (NS1) | Spr,Str,Kanr | This study |
Table 2.
Plasmids used in this study
| Plasmid | Description | Antibiotic resistance | References |
|---|---|---|---|
| pAM2314 | Cyanobacterial cloning vector with NS1 integration sequence | Spr,Str | Ditty et al (2005) |
| pAM3685 | Ptrc::kaiA‐YFP | Spr,Str | Dong et al (2010) |
| pLA35 | PpsbAI::YFP_LVA in pAM2314 | Spr,Str | This study |
| pAD03 | PsigC::YFP_LVA in pAM2314 | Spr,Str | This study |
| pAD09 | PrpoD6::YFP_LVA in pAM2314 | Spr,Str | This study |
| pUC18‐kaiBC‐Gent | kaiBC deleted by the insertion of gentamicin cassette within the ORF | Gentr | Teng et al (2013) |
| pAD35 | sigC inactivated by insertion of kanamycin cassette within the ORF. | Kanr | This study |
In the time‐lapse experiments, under conditions of low light (ca. 15 μE m−2 s−1), we measured a mean cell cycle time of 19.5 ± 4.6 h, which is similar to what has previously been measured in other single‐cell studies (Dong et al, 2010), and a mean cell elongation rate of 0.031 ± 0.004 h−1. Cells grown under higher light (ca. 35 μE m−2 s−1) had a mean cell cycle time of 9.3 ± 2.7 h and a mean cell elongation rates of 0.07 ± 0.01 h−1. Finally, cells grown under very low light (ca. 10 μE m−2 s−1) had a mean cell cycle time of 25.2 ± 5.8 h and a mean cell elongation rate of 0.025 ± 0.004 h−1.
Growth conditions
The strains were grown in BG‐11 M media at 30°C under photoautotrophic conditions with constant rotation, supplemented with appropriate antibiotics. Light conditions were maintained at approximately 25 μE m−2 s−1 by cool fluorescent light sources. Before the start of each movie acquisition, the cultures were entrained by subjecting the cells to two 12‐h light:12‐h dark cycles (12:12LD).
Microscopy and sample preparation
A Nikon Ti‐E inverted microscope equipped with the Nikon Perfect Focus System module was used to acquire images of Synechococcus elongatus reporter strains. 2 μl of entrained cultures in exponential phase was diluted to an OD750 of 0.15 and applied to agarose pads. The protocol followed was modified from Young et al (2012). The agarose pads were dried and placed inside a two‐chambered cover glass (Labtek Services, UK). The microscopy set‐up includes a custom‐built circular cool white light LED array (Cairn Research, UK), attached around the condenser lens. Data acquisition was controlled through the software Metamorph (Molecular Devices, California). The samples were set in the microscope and further entrained for an additional LD cycle before starting data acquisition. The cells were kept under constant light conditions throughout the acquisition, except whilst taking fluorescent images. Epi‐illumination was provided by a solid‐state white light source (Lumencor, Oregon). Filter sets 41027 (Calcium Crimson) and 49003 (ET‐YFP) by Chroma Technology, Vermont, were used. Following best practice in the field, we minimised fluorescent exposure time and intensity, and as frequencies of imaging faster than once every half hour are generally discouraged (Yokoo et al, 2015), phase contrast and fluorescent images were acquired every 45 min using a CoolSNAP HQ2 camera (Photometrics, Arizona). All experiments used a 100× objective.
Quantification of fluorescence
The images were processed and analysed using custom‐made software in MATLAB (The MathWorks, Massachusetts) adapted from Young et al (2012), for segmentation and single‐cell tracking. Mean fluorescence per cell is defined as the average of the intensities of all pixels within the segmented area of each cell. For each movie, all single‐cell traces were smoothed by a moving average filter spanning five data points (3 h). Whenever the range of the filter window is not contained within the range of a cell cycle (i.e. when the filter is centred in one of the first two or in one of the last two data points of each individual cell cycle), single‐cell traces are padded with data from the mother (on the left) and the average of the two daughters (on the right), provided data for these cells have been acquired.
Quantitative analysis
Peak‐to‐peak measurements
For each micro‐colony, we extracted all single‐cell lineages and detrended the data by subtracting a second‐order polynomial fit. We then fitted a sinusoid to each lineage using a cosinor method (Nelson et al, 1979) constrained to the range [21 h, 27 h]. This fit finds the best single‐period sinusoid for the time series, and we use it to define the characteristic circadian windows of each lineage. For lineage i, we therefore obtain a sinusoidal fit F i such that
| (4) |
We then compute the troughs (minima) of F i and the time points t i,j when they occur. Next, we extract the mean fluorescence signal Y i,[j,j + 1] between each pair t i,j and t i,j + 1. We loop through all Y i,[j,j + 1] sub‐series and obtain candidate peaks of expression using the standard function “findpeaks” in MATLAB. We impose all peaks must be at least 3 h apart and have a width of at least 2 h at full width half maximum. Additionally, if there is at least one peak remaining, we discard all other peaks with heights lower than 25% and prominences lower than 10% of the major peak, as well as those pairs with width differences greater than 5 h. This filtering is intended to eliminate spurious fluctuations and maintain only clear independent peaks. Peak‐to‐peak distances are then defined as the distance between two consecutive peaks within each Y i,[j,j + 1] sub‐series. However, if there is only one peak in the sub‐series, then we measure the distance to the first peak in the next sub‐series instead. We do not consider any peak‐to‐peak distances greater than 36 h. Finally, and because many sub‐series are repeated in different lineages, we loop through all peak‐to‐peak pairs and discard all non‐unique pairs.
Elongation rate
Due to being rod‐shaped, cell length in S. elongatus is a good proxy for cell volume, and so elongation rates are correlated with single‐cell growth rates. For each micro‐colony, we extracted single‐cell lengths across all frames. For each cell, we smooth the length traces and use a moving window to fit cell lengths to an exponential function. The width of the window is one‐third of the average cell cycle duration in the micro‐colony. When fitting for windows centred in early and late points in the cell cycle, we stitch the progenitor and offspring length traces, but normalising lengths to maintain continuity and obtain a monotonic length profile. In this way, we can average across division events and obtain a continuous function for the elongation rate, which is not interrupted at the end of each cell cycle. The instantaneous elongation rate at each time point is the exponent in the fitted function. Next, we averaged the single‐cell traces across all cells for each micro‐colony.
Auto‐correlations and cross‐correlations
We used the method developed by Dunlop et al (2008), which quantifies cross‐correlation functions for tree‐structured data by subtracting the contributions of data points that are common to more than one single‐cell lineage. Briefly, we first extract all single‐cell lineages in each movie. These lineages trace the time evolution of the variables of interest (YFP expression, elongation rate) across all cells within a lineage, from the beginning of the movie until its end. The normalised cross‐correlation function between two variables, x and y, is given by
| (5) |
where τ is the lag between the two variables. The standard definition of S x.y (τ) is
| (6) |
where and are the two variables rescaled to have zero mean.
Next, the cross‐correlations of all individual lineages within a movie are averaged. However, because two sister cells branch out from the same data point and, prior to this branching, they share the same time series, the cross‐correlation functions are modified to discard all repeated data points. This ensures each pair of points for the two variables we are cross‐correlating is only weighed once. The modified cross‐correlations are given by
| (7) |
Here is the number of cells in the movie, N t is the number of data points, and d i are the branching points (i.e. the times of cell division events) (Dunlop et al, 2008).
Finally, the cross‐correlation functions of all movies are averaged, with all movies carrying the same weight.
Mathematical model
A minimal phenomenological ODE model of the incoherent feedforward loop circuit was constructed using a sinusoidal curve as a representation of the circadian clock, and Hill equation kinetics for sigC and psbAI. Equations were solved numerically using the stiff ode23s solver in MATLAB. The model is provided in SBML code (Code EV1). See Appendix Table S1 for model parameters, and section II in Appendix for further details of the modelling approach and assumptions.
Data availability
The model is provided in SBML code as Code EV1 and is also available at the JWS Online model database (https://jjj.bio.vu.nl/models/martins2/).
Author contributions
BMCM, AKD and JCWL conceived and designed the study, analysed and interpreted the data, and wrote the article. BMCM and AKD performed the experiments. AKD and LA constructed strains. BMCM developed the mathematical model.
Conflict of interest
The authors declare that they have no conflict of interest.
Supporting information
Appendix
Expanded View Figures PDF
Movie EV1
Movie EV2
Code EV1
Source Data for Expanded View
Review Process File
Source Data for Figure 1
Source Data for Figure 3
Source Data for Figure 5
Acknowledgements
We wish to thank Niall Murphy for help with converting the mathematical model into the sbml format and Chao Ye for help with setting experiments. We thank Susan Golden and Erin O'Shea for strains. We thank Pau Formosa‐Jordan, Om Patange, Katie Abley, Michael Elowitz and Henrik Jönsson for critical reading of the manuscript and useful suggestions. This research was made possible by the award of a European Research Council under the European Union's Seventh Framework Programme (FP/2007‐2013)/ERC Grant Agreement 338060. The work in the Locke laboratory is further supported by a fellowship from the Gatsby Foundation (GAT3272/GLC) and a Fellowship from the Human Frontier Science Program (CDA00068/2012).
Mol Syst Biol. (2016) 12: 896
References
- Andersen JB, Sternberg C, Poulsen LK, Bjørn SP, Givskov M, Molin S (1998) New unstable variants of green fluorescent protein for studies of transient gene expression in bacteria. Appl Environ Microbiol 64: 2240–2246 [DOI] [PMC free article] [PubMed] [Google Scholar]
- Basu S, Mehreja R, Thiberge S, Chen M‐T, Weiss R (2004) Spatiotemporal control of gene expression with pulse‐generating networks. Proc Natl Acad Sci USA 101: 6355–6360 [DOI] [PMC free article] [PubMed] [Google Scholar]
- Batchelor E, Loewer A, Mock C, Lahav G (2011) Stimulus‐dependent dynamics of p53 in single cells. Mol Syst Biol 7: 488 [DOI] [PMC free article] [PubMed] [Google Scholar]
- Bell‐Pedersen D, Cassone VM, Earnest DJ, Golden SS, Hardin PE, Thomas TL, Zoran MJ (2005) Circadian rhythms from multiple oscillators: lessons from diverse organisms. Nat Rev Genet 6: 544–556 [DOI] [PMC free article] [PubMed] [Google Scholar]
- Cerone L, Neufeld Z (2012) Differential gene expression regulated by oscillatory transcription factors. PLoS ONE 7: e30283 [DOI] [PMC free article] [PubMed] [Google Scholar]
- Chabot JR, Pedraza JM, Luitel P, van Oudenaarden A (2007) Stochastic gene expression out‐of‐steady‐state in the cyanobacterial circadian clock. Nature 450: 1249–1252 [DOI] [PubMed] [Google Scholar]
- Chen Y‐G, Mantalaris A, Bourne P, Keng P, Wu JD (2000) Expression of mPer1 and mPer2, two mammalian clock genes, in murine bone marrow. Biochem Biophys Res Commun 276: 724–728 [DOI] [PubMed] [Google Scholar]
- Clarke AK, Soitamo A, Gustafsson P, Oquist G (1993) Rapid interchange between two distinct forms of cyanobacterial photosystem II reaction‐center protein D1 in response to photoinhibition. Proc Natl Acad Sci USA 90: 9973–9977 [DOI] [PMC free article] [PubMed] [Google Scholar]
- Clerico EM, Cassone VM, Golden SS (2009) Stability and lability of circadian period of gene expression in the cyanobacterium Synechococcus elongatus . Microbiology 155: 635–641 [DOI] [PMC free article] [PubMed] [Google Scholar]
- Cohen SE, Golden SS (2015) Circadian Rhythms in Cyanobacteria. Microbiol Mol Biol Rev 79: 373–385 [DOI] [PMC free article] [PubMed] [Google Scholar]
- Cretenet G, Le Clech M, Gachon F (2010) Circadian clock‐coordinated 12 hr period rhythmic activation of the IRE1α pathway controls lipid metabolism in mouse liver. Cell Metab 11: 47–57 [DOI] [PubMed] [Google Scholar]
- Diamond S, Jun D, Rubin BE, Golden SS (2015) The circadian oscillator in Synechococcus elongatus controls metabolite partitioning during diurnal growth. Proc Natl Acad Sci USA 112: E1916–E1925 [DOI] [PMC free article] [PubMed] [Google Scholar]
- Ditty JL, Canales SR, Anderson BE, Williams SB, Golden SS (2005) Stability of the Synechococcus elongatus PCC 7942 circadian clock under directed anti‐phase expression of the kai genes. Microbiology 151: 2605–2613 [DOI] [PubMed] [Google Scholar]
- Doherty CJ, Kay SA (2010) Circadian control of global gene expression patterns. Annu Rev Genet 44: 419–444 [DOI] [PMC free article] [PubMed] [Google Scholar]
- Dong G, Yang Q, Wang Q, Kim YI, Wood TL, Osteryoung KW, van Oudenaarden A, Golden SS (2010) Elevated ATPase activity of KaiC applies a circadian checkpoint on cell division in Synechococcus elongatus . Cell 140: 529–539 [DOI] [PMC free article] [PubMed] [Google Scholar]
- Dunlop MJ, Cox RS III, Levine JH, Murray RM, Elowitz MB (2008) Regulatory activity revealed by dynamic correlations in gene expression noise. Nat Genet 40: 1493–1498 [DOI] [PMC free article] [PubMed] [Google Scholar]
- Goentoro L, Shoval O, Kirschner MW, Alon U (2009) The incoherent feedforward loop can provide fold‐change detection in gene regulation. Mol Cell 36: 894–899 [DOI] [PMC free article] [PubMed] [Google Scholar]
- Golden SS (1995) Light‐responsive gene expression in cyanobacteria. J Bacteriol 177: 1651–1654 [DOI] [PMC free article] [PubMed] [Google Scholar]
- Gruber TM, Gross CA (2003) Multiple sigma subunits and the partitioning of bacterial transcription space. Annu Rev Microbiol 57: 441–466 [DOI] [PubMed] [Google Scholar]
- Hughes ME, DiTacchio L, Hayes KR, Vollmers C, Pulivarthy S, Baggs JE, Panda S, Hogenesch JB (2009) Harmonics of circadian gene transcription in mammals. PLoS Genet 5: e1000442 [DOI] [PMC free article] [PubMed] [Google Scholar]
- Imamura S, Asayama M (2009) Sigma factors for cyanobacterial transcription. Gene Regul Syst Bio 3: 65–87 [DOI] [PMC free article] [PubMed] [Google Scholar]
- Ito H, Kageyama H, Mutsuda M, Nakajima M, Oyama T, Kondo T (2007) Autonomous synchronization of the circadian KaiC phosphorylation rhythm. Nat Struct Mol Biol 14: 1084–1088 [DOI] [PubMed] [Google Scholar]
- Ito H, Mutsuda M, Murayama Y, Tomita J, Hosokawa N, Terauchi K, Sugita C, Sugita M, Kondo T, Iwasaki H (2009) Cyanobacterial daily life with Kai‐based circadian and diurnal genome‐wide transcriptional control in Synechococcus elongatus . Proc Natl Acad Sci USA 106: 14168–14173 [DOI] [PMC free article] [PubMed] [Google Scholar]
- Johnson CH, Stewart PL, Egli M (2011) The cyanobacterial circadian system: from biophysics to bioevolution. Annu Rev Biophys 40: 143–167 [DOI] [PMC free article] [PubMed] [Google Scholar]
- Korenčič A, Bordyugov G, Rozman D, Goličnik M, Herzel H (2012) The interplay of cis‐regulatory elements rules circadian rhythms in mouse liver. PLoS ONE 7: e46835 [DOI] [PMC free article] [PubMed] [Google Scholar]
- Kulkarni R, Schaefer M, Golden S (1992) Transcriptional and posttranscriptional components of psbA response to high light intensity in Synechococcus sp. strain PCC 7942. J Bacteriol 174: 3775–3781 [DOI] [PMC free article] [PubMed] [Google Scholar]
- Liu Y, Tsinoremas NF, Johnson CH, Lebedeva NV, Golden SS, Ishiura M, Kondo T (1995) Circadian orchestration of gene expression in cyanobacteria. Genes Dev 9: 1469–1478 [DOI] [PubMed] [Google Scholar]
- Liu S, Cai Y, Sothern RB, Guan Y, Chan P (2007) Chronobiological analysis of circadian patterns in transcription of seven key clock genes in six peripheral tissues in mice. Chronobiol Int 24: 793–820 [DOI] [PubMed] [Google Scholar]
- Locke JC, Young JW, Fontes M, Hernandez Jimenez MJ, Elowitz MB (2011) Stochastic pulse regulation in bacterial stress response. Science 334: 366–369 [DOI] [PMC free article] [PubMed] [Google Scholar]
- Mangan S, Alon U (2003) Structure and function of the feed‐forward loop network motif. Proc Natl Acad Sci USA 100: 11980–11985 [DOI] [PMC free article] [PubMed] [Google Scholar]
- Markson JS, Piechura JR, Puszynska AM, O'Shea EK (2013) Circadian control of global gene expression by the cyanobacterial master regulator RpaA. Cell 155: 1396–1408 [DOI] [PMC free article] [PubMed] [Google Scholar]
- Martins BM, Locke JC (2015) Microbial individuality: how single‐cell heterogeneity enables population level strategies. Curr Opin Microbiol 24: 104–112 [DOI] [PubMed] [Google Scholar]
- McClung CR (2006) Plant circadian rhythms. Plant Cell 18: 792–803 [DOI] [PMC free article] [PubMed] [Google Scholar]
- Mihalcescu I, Hsing W, Leibler S (2004) Resilient circadian oscillator revealed in individual cyanobacteria. Nature 430: 81–85 [DOI] [PubMed] [Google Scholar]
- Millar AJ (2015) The intracellular dynamics of circadian clocks reach for the light of ecology and evolution. Annu Rev Plant Biol 67: 595–618 [DOI] [PubMed] [Google Scholar]
- Milo R, Shen‐Orr S, Itzkovitz S, Kashtan N, Chklovskii D, Alon U (2002) Network motifs: simple building blocks of complex networks. Science 298: 824–827 [DOI] [PubMed] [Google Scholar]
- Mohawk JA, Green CB, Takahashi JS (2012) Central and peripheral circadian clocks in mammals. Annu Rev Neurosci 35: 445–462 [DOI] [PMC free article] [PubMed] [Google Scholar]
- Nair U, Ditty JL, Min H, Golden SS (2002) Roles for sigma factors in global circadian regulation of the cyanobacterial genome. J Bacteriol 184: 3530–3538 [DOI] [PMC free article] [PubMed] [Google Scholar]
- Nakajima M, Imai K, Ito H, Nishiwaki T, Murayama Y, Iwasaki H, Oyama T, Kondo T (2005) Reconstitution of circadian oscillation of cyanobacterial KaiC phosphorylation in vitro. Science 308: 414–415 [DOI] [PubMed] [Google Scholar]
- Nelson W, Tong YL, Lee J‐K, Halberg F (1979) Methods for cosinor‐rhythmometry. Chronobiologia 6: 305–323 [PubMed] [Google Scholar]
- Noordally ZB, Millar AJ (2015) Clocks in algae. Biochemistry 54: 171–183 [DOI] [PubMed] [Google Scholar]
- Pattanayak GK, Phong C, Rust MJ (2014) Rhythms in energy storage control the ability of the cyanobacterial circadian clock to reset. Curr Biol 24: 1934–1938 [DOI] [PMC free article] [PubMed] [Google Scholar]
- Pembroke WG, Babbs A, Davies KE, Ponting CP, Oliver PL (2015) Temporal transcriptomics suggest that twin‐peaking genes reset the clock. Elife 4: pii:e10518 [DOI] [PMC free article] [PubMed] [Google Scholar]
- Rust MJ, Markson JS, Lane WS, Fisher DS, O'Shea EK (2007) Ordered phosphorylation governs oscillation of a three‐protein circadian clock. Science 318: 809–812 [DOI] [PMC free article] [PubMed] [Google Scholar]
- Shankaran H, Ippolito DL, Chrisler WB, Resat H, Bollinger N, Opresko LK, Wiley HS (2009) Rapid and sustained nuclear‐cytoplasmic ERK oscillations induced by epidermal growth factor. Mol Syst Biol 5: 332 [DOI] [PMC free article] [PubMed] [Google Scholar]
- Shen‐Orr SS, Milo R, Mangan S, Alon U (2002) Network motifs in the transcriptional regulation network of Escherichia coli . Nat Genet 31: 64–68 [DOI] [PubMed] [Google Scholar]
- Teng SW, Mukherji S, Moffitt JR, de Buyl S, O'Shea EK (2013) Robust circadian oscillations in growing cyanobacteria require transcriptional feedback. Science 340: 737–740 [DOI] [PMC free article] [PubMed] [Google Scholar]
- Thomas C, Andersson CR, Canales SR, Golden SS (2004) PsfR, a factor that stimulates psbAI expression in the cyanobacterium Synechococcus elongatus PCC 7942. Microbiology 150: 1031–1040 [DOI] [PubMed] [Google Scholar]
- Vijayan V, Zuzow R, O'Shea EK (2009) Oscillations in supercoiling drive circadian gene expression in cyanobacteria. Proc Natl Acad Sci USA 106: 22564–22568 [DOI] [PMC free article] [PubMed] [Google Scholar]
- Westermark PO, Herzel H (2013) Mechanism for 12 hr rhythm generation by the circadian clock. Cell Rep 3: 1228–1238 [DOI] [PubMed] [Google Scholar]
- Wilcockson D, Zhang L (2008) Circatidal clocks. Curr Biol 18: R753–R755 [DOI] [PubMed] [Google Scholar]
- Woelfle MA, Ouyang Y, Phanvijhitsiri K, Johnson CH (2004) The adaptive value of circadian clocks: an experimental assessment in cyanobacteria. Curr Biol 14: 1481–1486 [DOI] [PubMed] [Google Scholar]
- Yokoo R, Hood RD, Savage DF (2015) Live‐cell imaging of cyanobacteria. Photosynth Res 126: 33–46 [DOI] [PubMed] [Google Scholar]
- Young JW, Locke JC, Altinok A, Rosenfeld N, Bacarian T, Swain PS, Mjolsness E, Elowitz MB (2012) Measuring single‐cell gene expression dynamics in bacteria using fluorescence time‐lapse microscopy. Nat Protoc 7: 80–88 [DOI] [PMC free article] [PubMed] [Google Scholar]
- Zhang L, Hastings MH, Green EW, Tauber E, Sladek M, Webster SG, Kyriacou CP, Wilcockson DC (2013) Dissociation of circadian and circatidal timekeeping in the marine crustacean Eurydice pulchra. Curr Biol 23: 1863–1873 [DOI] [PMC free article] [PubMed] [Google Scholar]
Associated Data
This section collects any data citations, data availability statements, or supplementary materials included in this article.
Supplementary Materials
Appendix
Expanded View Figures PDF
Movie EV1
Movie EV2
Code EV1
Source Data for Expanded View
Review Process File
Source Data for Figure 1
Source Data for Figure 3
Source Data for Figure 5
Data Availability Statement
The model is provided in SBML code as Code EV1 and is also available at the JWS Online model database (https://jjj.bio.vu.nl/models/martins2/).


