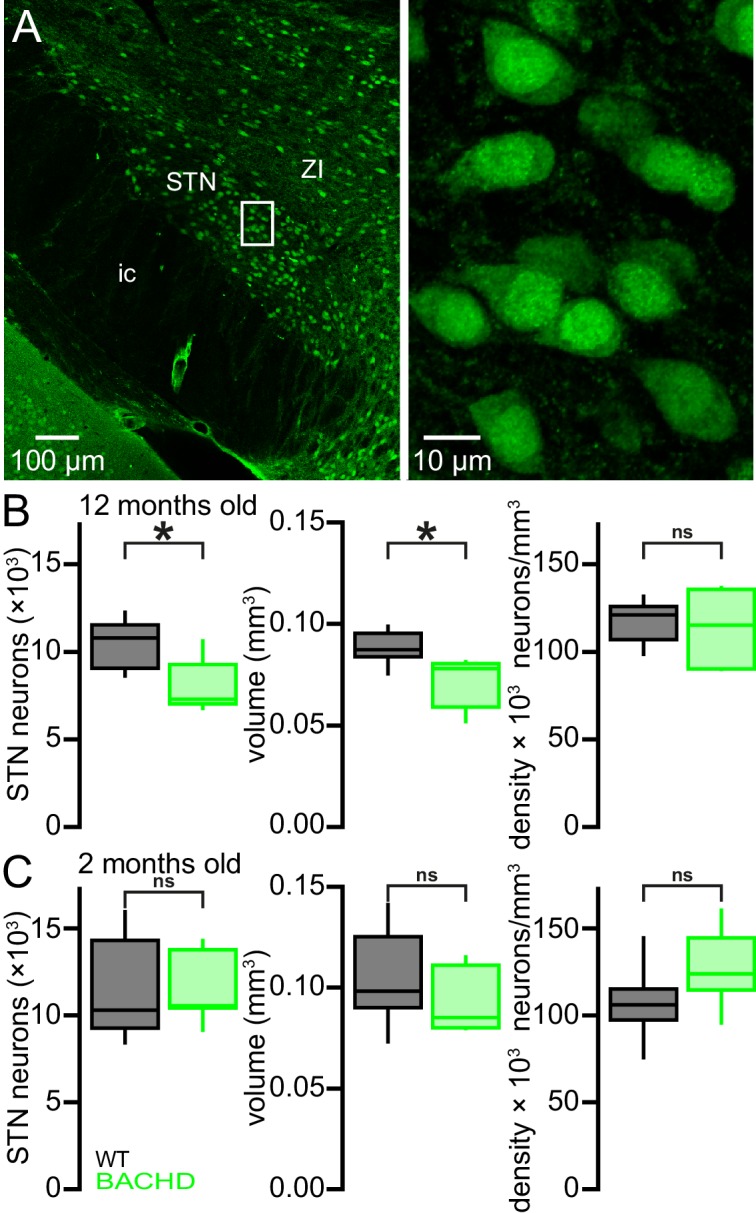
Figure 11. Degeneration of STN neurons in BACHD mice.

(A) Expression of NeuN in STN neurons in a BACHD mouse (ZI, zone incerta; ic, internal capsule). (B) Population data showing a 32.3% reduction in the median STN neuron number and a 10.3% reduction in STN volume at 12 months old. *p < 0.05. ns, not significant. (C) Population data showing no difference in STN neuron number, STN volume or density between WT and BACHD mice at 2 months old. Data for panels B–C provided in Figure 11—source data 1.
DOI: http://dx.doi.org/10.7554/eLife.21616.027
