

Abstract
Key points
Motor neurons are the output neurons of the central nervous system and are responsible for controlling muscle contraction.
When initially activated during voluntary contraction, firing rates of motor neurons increase steeply but then level out at modest rates.
Activation of an intrinsic source of excitatory current at recruitment onset may underlie the initial steep increase in firing rate in motor neurons.
We attempted to disable this intrinsic excitatory current by artificially activating an inhibitory reflex.
When motor neuron activity was recorded while the inhibitory reflex was engaged, firing rates no longer increased steeply, suggesting that the intrinsic excitatory current was probably responsible for the initial sharp rise in motor neuron firing rate.
Abstract
During graded isometric contractions, motor unit (MU) firing rates increase steeply upon recruitment but then level off at modest rates even though muscle force continues to increase. The mechanisms underlying such firing behaviour are not known although activation of persistent inward currents (PICs) might be involved. PICs are intrinsic, voltage‐dependent currents that activate strongly when motor neurons (MNs) are first recruited. Such activation might cause a sharp escalation in depolarizing current and underlie the steep initial rise in MU firing rate. Because PICs can be disabled with synaptic inhibition, we hypothesized that artificial activation of an inhibitory pathway might curb this initial steep rise in firing rate. To test this, human subjects performed slow triangular ramp contractions of the ankle dorsiflexors in the absence and presence of tonic synaptic inhibition delivered to tibialis anterior (TA) MNs by sural nerve stimulation. Firing rate profiles (expressed as a function of contraction force) of TA MUs recorded during these tasks were compared for control and stimulation conditions. Under control conditions, during the ascending phase of the triangular contractions, 93% of the firing rate profiles were best fitted by rising exponential functions. With stimulation, however, firing rate profiles were best fitted with linear functions or with less steeply rising exponentials. Firing rate profiles for the descending phases of the contractions were best fitted with linear functions for both control and stimulation conditions. These results seem consistent with the idea that PICs contribute to non‐linear firing rate profiles during ascending but not descending phases of contractions.
Keywords: firing rate, inhibition, motoneurones, motor unit, muscle contraction, persistent inward currents
Key points
Motor neurons are the output neurons of the central nervous system and are responsible for controlling muscle contraction.
When initially activated during voluntary contraction, firing rates of motor neurons increase steeply but then level out at modest rates.
Activation of an intrinsic source of excitatory current at recruitment onset may underlie the initial steep increase in firing rate in motor neurons.
We attempted to disable this intrinsic excitatory current by artificially activating an inhibitory reflex.
When motor neuron activity was recorded while the inhibitory reflex was engaged, firing rates no longer increased steeply, suggesting that the intrinsic excitatory current was probably responsible for the initial sharp rise in motor neuron firing rate.
Abbreviations
- CSP
cutaneous silent period
- IEMG
intramuscular electromyogram
- MN
motor neuron
- MU
motor unit
- MVC
maximum voluntary contraction
- PICs
persistent inward currents
- SSE
sum of squared errors
- TA
tibialis anterior
Introduction
Motor neurons (MNs) serve as the final stage of neural processing through which motor behaviours are enacted. Therefore, knowledge as to how synaptic inputs are transformed into spiking output by MNs is essential for understanding how the nervous system controls movements. Early studies showed that steady‐state firing rates in mammalian MNs increase linearly up to high rates (usually >50–70 impulses s−1) with injected current (Kernell, 1965; Granit et al. 1966; Schwindt & Calvin, 1972; Schwindt, 1973; Schwindt & Crill 1982). Because injected and synaptic currents have been considered to have similar effects on MN firing (Granit et al. 1966; Kernell, 1969, 2006; Kernell & Sjöholm, 1973; Schwindt & Calvin, 1973; Heckman & Binder, 1991; Powers et al. 1992), MNs have long been thought to generate spikes at rates in proportion to the net excitatory synaptic input received.
However, during the natural activity of MNs, for example, as recorded in human motor units (MUs) during voluntary muscle contraction, a marked non‐linearity is evident. As the strength of contraction increases, firing rates of individual MUs initially increase steeply with modest increases in isometric force but then level out at low rates (often <20 impulses s−1) even though force (and presumably synaptic drive) continues to increase. Such non‐linear firing rate behaviour (also referred to as firing rate saturation) is a common feature of MUs and has been observed in a wide variety of human muscles (e.g. Monster & Chan, 1977; De Luca et al. 1982; Moritz et al. 2005; Bailey et al. 2007; De Luca & Contessa, 2012).
Recently, we attempted to identify mechanisms that might contribute to this apparent non‐linearity between synaptic input and firing rate output. We first explored the possibility that the intensity of synaptic excitation delivered to individual MNs during graded isometric contractions may itself saturate rather than continue to increase (Fuglevand et al. 2015). We found, however, that augmenting descending excitatory drive to MNs with peripheral excitation mediated by tendon vibration had little effect on the discharge of MUs whose firing rates had already saturated, but robustly increased firing rates of the same units when active at lower rates (Fuglevand et al. 2015). Those results suggested that firing rate saturation is probably caused by mechanisms intrinsic to MNs.
We next investigated the possibility that a progressive reduction in cell input resistance associated with increased synaptic activity (but not during current injection) might limit the ability of MNs to increase firing rates to high levels. Accordingly, we compared, in the same MNs, maximal firing rates evoked by somatic current injection to that elicited by extracellular micro‐ejection of high concentration glutamate (Wakefield et al. 2016). Despite substantial reduction in input resistance associated with opening of ligand‐gated channels during glutamate application, the maximal firing rates achieved through the two methods were not different from one another. Therefore, reduction in input resistance associated with receptor‐mediated excitation does not appear to account for the restricted firing rate range of MNs observed during natural synaptic activity.
Another intrinsic mechanism that might contribute to non‐linear firing rate responses of MNs during voluntary activity is that associated with activation of persistent inward currents (PICs) (Crone et al. 1988; Hounsgaard et al. 1988; Kiehn & Eken, 1997; Hornby et al. 2002; Heckman et al. 2008; Heckman & Enoka, 2012; Powers, 2012). PICs are mediated by voltage‐activated dendritic channels (Hounsgaard & Kiehn, 1993; Lee & Heckman, 1996; Bennett et al. 1998; Carlin et al. 2000) that require monoamine neuromodulators, such as serotonin or noradrenaline (norepinephrine), to be enabled (Crone et al. 1988; Hounsgaard et al. 1988; Miller et al. 1996; Lee & Heckman, 2000; Heckman et al. 2009).
When neuromodulation is present, the channels mediating PICs activate near the spike threshold of MNs (Bennett et al. 1998). The depolarizing current provided by PICs can be substantial, as much as 3–5 times larger than that provided by synaptic activity alone (Bennett et al. 1998; Lee & Heckman, 1998, 2000). This additional sustained intrinsic current could sum with synaptic currents to yield a sharp rise in total somatic current when a MN is first recruited. This, in turn, might underlie the initial steep rise in firing rate seen in MUs during voluntary ramp contractions (Crone et al. 1988; Hounsgaard et al. 1988; Kiehn & Eken, 1997; Hornby et al. 2002; Heckman et al. 2009).
Because PICs can be markedly dampened by inhibitory inputs (Crone et al. 1988; Hounsgaard et al. 1988; Hultborn et al. 2003; Kuo et al. 2003; Hyngstrom et al. 2007; Bui et al. 2008), increased recurrent inhibition, reciprocal inhibition, and activity of various peripheral receptors (e.g. Golgi tendon organs) associated with increased contraction strength might progressively blunt the contribution of PICs. This, in turn, could lead to a levelling‐off of the total somatic current and contribute to the saturation in MU firing rates.
Therefore, to test this idea, we attempted to prevent activation of PICs altogether by artificially activating strong inhibitory inputs to human MNs prior to and throughout ramp contractions to the same force level as produced in the absence of such inhibition. We hypothesized that if the initial steep rise in firing rate were eliminated with added inhibition, then this would support the idea that PICs play a prominent role in shaping firing rate responses of MNs during natural voluntary behaviour.
Methods
Sixteen healthy human subjects participated in 27 experiments to record MU activity from the tibialis anterior (TA) in the presence and absence of cutaneous electrical stimulation intended to deliver inhibition to TA MNs. In accordance with the Declaration of Helsinki, the University of Arizona Internal Review Board approved all experimental procedures and every subject gave informed consent.
Experimental set‐up
Subjects were seated comfortably in a dental chair with their right foot secured to a custom‐built footplate with Velcro straps. The footplate rotated freely about an axis aligned approximately collinear with the talocrural joint of the ankle. Once the foot was secured, the footplate was rotated such that it held the ankle in near full plantar flexion (∼70 deg plantar flexion from neutral). An isometric force transducer (Grass FT‐10, Natus Neurology ‐ Grass, Warwick, RI, USA) was then attached to the distal end of the footplate, which resisted ankle dorsiflexion. Such a plantarflexed position helped minimize contributions of antagonist muscles to detected isometric forces (Fuglevand et al. 2006).
Electromyography recordings
Sterilized tungsten microelectrodes (Frederick Haer and Co., Bowdoinham, ME, USA; 1–5 μm tip diameter, 5–10 μm uninsulated length, 250 μm shaft diameter, <200 kΩ impedance at 1000 Hz after insertion) were inserted into the belly of TA to record motor unit action potentials. A surface electrode (4 mm diameter, Ag–AgCl) placed over the tibia served as the reference electrode. Intramuscular electromyographic (IEMG) signals were differentially amplified (×1000), band pass filtered (0.3–3 kHz, Grass Instruments), displayed on an oscilloscope and computer monitor, routed to an audio amplifier, and digitized at 25 kHz (Cambridge Electronic Design Ltd, Cambridge, UK). In addition, pairs of surface electrodes (aligned longitudinally, inter‐electrode spacing ∼5 cm) were placed over TA and over the central region of the triceps surae to monitor general muscle activity of agonists and antagonists, respectively, during dorsiflexion contractions. Surface EMG signals were differentially amplified (×1000), band pass filtered (0.03–1 kHz), displayed on computer monitor, and digitized at 2.5 kHz. The force transducer signal was amplified (×1000), displayed on computer monitor, and digitized at 1 kHz.
Sural nerve stimulation
In order to artificially engage inhibitory inputs to TA MNs, we stimulated the sural nerve with surface electrodes placed on the dorsal and lateral skin regions of the foot. Such stimulation can evoke clear suppression of ongoing TA EMG activity and is sometimes referred to as the cutaneous silent period (CSP) reflex (Floeter, 2003). The skin on the dorsal and lateral side of the foot and that posterior to the lateral malleolus were gently abraded using conductivity paste applied to gauze pads to decrease skin impedance. Current pulses (0.5 ms duration) generated by an isolated, constant current stimulator (Multichannel Systems, Reutlingen, Germany) were delivered through the skin to the sural nerve field by a hand‐held bipolar electrode (Dantec, Natus Neurology, Middleton, WI, USA) consisting of two saline‐soaked felt pads (2 cm inter‐electrode spacing, cathode proximal). Initially, the position of the stimulating electrode was adjusted while delivering low frequency, medium amplitude pulses (1 Hz, 3 mA) to identify the location that elicited the strongest sensation in skin of the foot as reported by the subject. The electrode was then secured in place with surgical tape. The stimulus current associated with perceptual threshold was then determined by delivering current pulses (1 Hz) that incremented from 0 mA in 0.1 mA steps until the subject first reported an evoked sensation.
Experimental protocol
Prior to placement of intramuscular electrodes and siting of the stimulating electrode, subjects performed three maximum voluntary contractions (MVCs) involving ankle dorsiflexion. For this task, custom‐built heavy‐duty springs were inserted into the housing of the Grass FT‐10 force transducer (sensitivity 0.072 mV kg−1). The peak force achieved by the subject during any contraction was defined as their MVC.
After the stimulating electrode was placed, subjects then maintained a weak contraction of ∼5% MVC while incrementing stimulus pulses (0.1 mA steps, 1 Hz) were delivered to the sural nerve beginning at perceptual threshold intensity. Each stimulus triggered a 200 ms sweep of a storage oscilloscope displaying the TA surface EMG signal. Stimulus intensity was increased until activation of the CSP reflex was clearly observed as a near‐complete silencing of the EMG signal at a latency of ∼60–80 ms and lasting for ∼40 ms. Once a CSP reflex was observed, we then delivered 60 stimuli (1 Hz) at the stimulus intensity associated with the CSP reflex while the subject maintained a weak contraction in order to evaluate the stability of the reflex. If a clear CSP was not observed even in response to the highest stimulus intensity available (15 mA), then the stimulating electrode was moved to a new location and the procedure was repeated. If after a few attempts a CSP reflex could not be evoked, the experimental session was terminated because we could not be confident that stimulation would cause significant inhibition of the TA MN pool.
If a site that elicited a CSP reflex was identified, then subjects performed a number of practice trials involving the production of triangularly shaped force trajectories. For this task, the springs in the FT‐10 force transducer were replaced with those allowing more sensitive measures of force (0.65 mV kg−1). Subjects were provided with an online template to guide force production. The target trajectory had a symmetric rate of rise and fall of force of 0.75% MVC s−1. The peak force was adjustable but typically was set at ∼4–8% MVC.
The microelectrode was then inserted into the TA and the position of the electrode manually adjusted while the subject exerted weak isometric contractions until clear MU action potentials could be discerned. Peak force for the ensuing experimental trials was then established based on the MU recruitment threshold as well as the clarity of the MU recording.
Subjects then performed a series of the triangular force contractions, usually four to five control contractions interleaved with four to five contractions during which repetitive sural nerve stimulation was delivered. At least 10 s elapsed between successive contractions in a series. Stimulation involved repetitive stimuli at 25 Hz using a stimulus intensity associated with the CSP reflex. At this frequency, a stimulus pulse was delivered every 40 ms, similar to the duration of inhibition arising during a CSP reflex. As such, the stimulation sequence should have led to a roughly continuous period of inhibition during the contraction. Stimulation was instigated just prior to and continued throughout the duration of the designated triangular contractions. After each series of contractions, subjects were given a few minutes of rest. The microelectrode position was then adjusted (which sometimes involved removal of the electrode and reinsertion at a new site) in order to sample from presumed different MUs and the procedures involving triangular contractions were repeated. Experimental sessions lasted no longer than 2 h.
Data analysis
In off‐line analysis, MU action potentials were identified in the IEMG signals using a template‐matching algorithm (Spike2, Cambridge Electronics Design). For each triangular contraction, instantaneous firing rates were calculated from the identified spike times of a MU. A five‐point moving average was then applied to the firing rate data to highlight the main trends. Force and firing rate data from each triangular contraction were then separated into two phases: that associated with the ascending phase and that associated with the descending force phase. Previously, we have shown that force and firing rate data for individual MUs during graded increases in isometric force are typically best fitted as a saturating function in the form of a rising exponential (Fuglevand et al. 2015). As such, we first fitted each phase of force–firing rate data for each trial with an equation of that form:
| (1) |
where R(F) represents the rate (R) of spiking as a function of muscle force (F), R max is the maximum rate of spiking, e is the base of the natural logarithms, F is normalized isometric force, F th is the threshold force at which a unit begins to discharge, and R min is the minimum rate of spiking at recruitment threshold. The parameter ϕ is a force constant that represents the amount of force increase associated with a 63% increase in firing rate.
We also fitted firing rate–force data for each phase of each trial with a linear function using linear regression. We then tested the hypothesis that the exponential (i.e. saturating) function provided a significantly better fit of firing rate data than the linear function. To do this, the sum of squared errors (SSE) associated with the exponential fit was compared to that of linear regression using the F statistic while taking into account differences in the number of parameters used to fit the data. The firing rate profile for each phase of a trial was then designated as exponential only if the F statistic indicated a significant (P < 0.05) improvement in fit over linear regression. Otherwise, the firing rate relation was deemed to be linear. If neither linear nor exponential regression provided a significant fit of the data, then no designation was applied to the firing rate profile.
For each MU, we then tallied the total number of trials best fitted by each function for each of the conditions (ascending control trials, descending control trials, ascending stimulation trials, descending stimulation trials). If the majority of trials for a given condition were best fitted by the exponential function, then MU firing was designated as exponential. Likewise, if the majority of trials were deemed to be linear, then the MUs firing for that condition were classified as linear. If equal numbers of trials were designated exponential and linear for a given condition, then that situation was designated as a tie.
Our main hypothesis was that for the ascending phase, a significant proportion of MUs have exponential firing rate–force profiles under control conditions and linear firing rate–force profiles during stimulation. To evaluate this hypothesis, the number of MUs designated as exponential relative to the total number of MUs were compared to the null prediction of a 0.5 probability using the binomial statistical test. The binomial test was also applied for the descending phases of control and stimulation conditions. Paired t tests were used to compare features of the force profiles (rate of force rise, rate of force descent, peak force) for control and stimulation conditions to determine whether task performance changed across conditions. The level of statistical significance was set at P < 0.05 and data are presented as means ± standard deviation.
Results
While we carried out 27 experiments on 16 subjects, we were only able to elicit clear CSP reflexes in four subjects. We suspect that the main reason for this low yield was that CSP reflex threshold was higher in most subjects than the maximum capacity of our stimulator. For the four subjects (ages 24–52 years, 2 male, 2 female), the current amplitude associated with perceptual threshold of stimulation was 1.0 ± 0.4 mA, and that used to elicit the CSP reflex was 11.2 ± 3.4 mA. Despite the low number of subjects, we were able to successfully follow the activities of 27 MUs during control and sural nerve stimulation trials across six experimental sessions. The data presented here are from those 27 MUs.
The numbers of MUs contributed per subject (and associated number of experimental sessions) were: 7 (2 sessions), 13 (2 sessions), 4 (1 session), and 3 (1 session), for each subject, respectively. The average number of triangular contractions analysed per MU was 4.4 ± 1.9 for the control condition and 3.1 ± 1.5 for the stimulation condition. The main reason for the lower number of trials involving stimulation was the inability in some cases to clearly identify MU potentials during stimulation because of excessive stimulus artifacts. In all cases where discrimination was possible, linear and/or exponential regression provided a significant fit to the force–firing rate data.
Figure 1 shows an example of a CSP reflex elicited in one subject. The subject maintained a low level of dorsiflexion force (∼5% MVC) while 60 stimuli (11 mA, 0.5 ms duration, 1 Hz) were delivered to the sural nerve. Figure 1 A shows an overlay of all 60 TA surface EMG traces triggered on stimulation (time 0 ms indicates time of stimulus delivery). Approximately 100 ms following the stimulus and for an ensuing period of about 40 ms, there was a near complete cessation of EMG activity. Figure 1 B depicts the associated stimulus‐triggered average of rectified EMG recorded during these 60 stimuli. From this trace, it is evident that inhibition of TA EMG began about 75 ms following the stimulus and persisted for a total duration of about 70 ms.
Figure 1. Example cutaneous silent period (CSP) reflex.
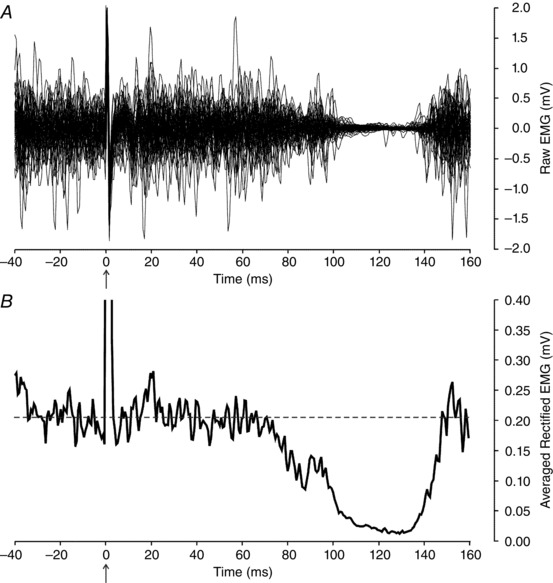
A, tibialis anterior surface EMG responses during sural nerve stimulation. Sixty traces superimposed, triggered on delivery of stimuli (1 Hz, 11 mA) to sural nerve field. Marked supression of EMG activity ∼100 ms following the delivery of the stimulus (arrow, at time 0 ms) indicative of CSP reflex. B, stimulus‐triggered average of the rectified EMG traces shown in A. Onset of inhibition associated with sural nerve stimulation begins ∼75 ms following stimulus and persists for a duration of about 70 ms.
Figure 2 shows a segment of an example run of trials involving triangular ramp contractions during which sural nerve stimulation was applied on the second and fourth trials. For trials without stimulation (first and third), the motor unit exhibited a saturating firing rate profile with firing rate increasing steeply at the outset of activity and then levelling off before peak force (indicated by the dashed vertical line). On the descending limb of these triangular ramp contractions, firing rate decreased steadily as force declined. There was little detectable EMG activity in the triceps surae (the antagonist) during trials with or without stimulation.
Figure 2. Example firing rate responses during triangular contractions in the absence and presence of sural nerve stimulation.
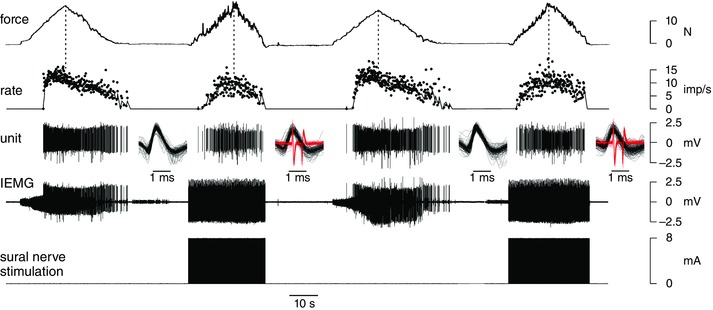
Activity recorded from tibialis anterior motor unit during repeated triangular contractions with (2nd and 4th trials) and without (1st and 3rd) superimposed sural nerve stimulation. Traces from bottom to top: stimuli (8 mA, 0.5 ms duration, 25 Hz) delivered to sural nerve field, intramuscular EMG (IEMG), discriminated motor unit potentials, instantaneous motor unit firing rate (dots), and dorsiflexion force. A 1‐s moving average of the instantaneous firing rate is displayed as a continuous trace on the rate plot. During stimulation (2nd and 4th trials), stimulus artifacts dominate the IEMG signal thereby obscuring underlying motor unit potentials when viewed with this long time base. Insets show all identified potentials for the target motor superimposed (black traces) for each trial and stimulus artifacts (red traces) during stimulation trials. Overall, firing rate profile was more symmetric with respect to force during stimulation trials compared to trials without stimulation. [Colour figure can be viewed at wileyonlinelibrary.com]
Firing rate responses were somewhat different during sural nerve stimulation (second and fourth trials, Fig. 2). First, discharge variability seemed to increase during the stimulation trials. This partly may be related to errors associated with the increased difficulty to identify motor unit potentials amongst the prominent stimulus artifacts during these trials. However, stimulus artifacts had a distinctive waveform (red traces, in insets, Fig. 2) that we were usually able to distinguish and separate from the motor unit potentials (black traces in insets, Fig. 2). As such, we believe that much of the increased discharge variability in Fig. 2 was probably a physiological consequence of the sural nerve stimulation.
During stimulation, firing rate (although noisy) appeared to increase relatively gradually with increasing force and to peak at about the same time force reached a peak (second and fourth trials, Fig. 2). As such, the firing rate profiles during stimulation appeared to be more symmetric (relative to peak force) than during trials without sural nerve stimulation.
The degree of fluctuations in force during the stimulation trials (Fig. 2) was greater than that occurring during trials without stimulation. This may partly have been due to the increased noisiness of the motor unit discharge during stimulation but may also be related to a tendency to activate higher threshold (and stronger) motor units during such cutaneous stimulation (Kanda et al. 1977; Stephens et al. 1978; Garnett & Stephens, 1981; cf. Clark et al. 1993). In addition, the degree of synchronized spiking may have increased in response to inhibitory input (Turker & Powers, 2001) that, in turn, may have contributed to increased force fluctuations (Yao et al. 2000).
Despite the increased fluctuations, subjects nevertheless performed the ramp contractions reasonably well during sural nerve stimulation. Overall, the average rate of rise of force (control 0.70 ± 0.14% MVC s−1, stimulation 0.71 ± 0.14% MVC s−1, P = 0.52, paired t test) and peak force (control 5.7 ± 1.1% MVC, stimulation 6.4 ± 2.4% MVC, P = 0.12, Wilcoxon signed rank test) were not different between the two conditions. The rate of force decline, however, was significantly steeper during the stimulation trials (control −0.72 ± 0.19% MVC s−1, stimulation −0.86 ± 0.27% MVC s−1, P = 0.020, Wilcoxon signed rank test). Interestingly, all four subjects reported an increased sense of effort associated with performance of the triangular contractions during sural nerve stimulation. Such increased sense of effort may reflect increased descending excitatory drive, and associated increased intensity of corollary discharge (McCloskey, 1981), needed to overcome the tonic inhibition acting on tibialis anterior MNs during sural nerve stimulation.
Figure 3 shows an example of the firing rate of a motor unit plotted as a function of isometric force without stimulation (control, Fig. 3 A) and during sural nerve stimulation (Fig. 3 B). These data are taken from the last two trials shown in Fig. 2. In each case, firing rates associated with the ascending phase of the triangular ramp contractions are shown in red whereas firing rates during the descending phases are shown in black. For the rising phase of the control situation (Fig. 3 A), while linear regression was significant (r 2 = 0.48, SSE = 111.5, P < 0.001), the exponential fit (r 2 = 0.52, SSE = 104, P < 0.0001, force constant Φ = 0.14% MVC) was significantly better (F ratio = 6.7, P = 0.011). As such the rising phase of the control contraction was designated as exponential (red trace, Fig. 3 A). The falling phase of the control trial, however, was best fitted with a linear function (r 2 = 0.88, P < 0.001, slope = 1.1 impulses (imp) s−1 (% MVC)−1, y‐intercept = 4.9 imp s−1) and is shown as a black trace in Fig. 3 A.
Figure 3. Relationship between firing rate and force for a tibialis anterior motor unit in the absence (A) and presence (B) of sural nerve stimulation.
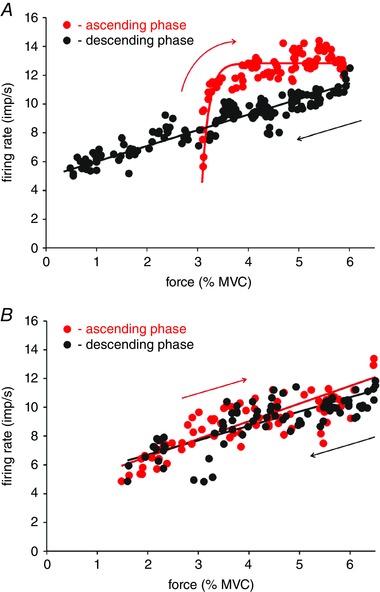
Red dots indicate firing rates during the ascending phase and black dots during the descending phase of triangular isometric force contractions. In the control condition (A), the firing rate of this unit was best fitted with a rising exponential (red trace) during the ascending phase. During the descending phase, firing rate best fitted with a linear function (black trace). With sural nerve stimulation (B), firing rate profiles for this motor unit during both ascending and descending phases were best fitted with linear functions. [Colour figure can be viewed at wileyonlinelibrary.com]
During sural nerve stimulation (Fig. 3 B), the firing rate of this motor unit during the rising phase was now best fitted with a linear function (r 2 = 0.74, slope = 1.2 imp s−1 (% MVC)−1, y‐intercept = 4.1 imp s−1, P < 0.001). The descending phase during stimulation was also best fitted as a linear function (r 2 = 0.68, slope = 1.0 imp s−1 (% MVC)−1, y‐intercept = 4.7 imp s−1, P < 0.001). As such, sural nerve stimulation changed the firing rate response of this unit during the rising phase from a saturating profile to a linear one whereas the descending phase remained linear during control and stimulation conditions.
The firing rate profiles for all 27 MUs recorded in this study were generally consistent with that shown for the unit in Fig. 3. During the ascending phase of the control contractions, 25/27 MUs (93%) had exponential firing rate profiles (Fig. 4 A, P < 0.0001, binomial test). This finding is nearly identical to that reported previously for a population of 136 human biceps brachii MUs (Fuglevand et al. 2015). In contrast, during the ascending phase of contractions involving sural nerve stimulation, the proportion of MUs with firing rate profiles best fitted by exponential functions (11/23) was similar to that designated as linear (9/23) and not significantly different from that expected by chance (Fig. 4 A, P = 0.50, binomial test). There were fewer MUs identified during stimulation because stimulus artifacts prevented clear identification of MU potentials during the contraction in a few cases. For the descending phase, the majority of MUs were best fitted by linear functions for both control (23/27) and stimulation (21/23) conditions (Fig. 4 B, P = 0.0002 for control condition, P < 0.001 for stimulation, binomial tests).
Figure 4. Number of MUs whose force and firing rate profiles were best fitted by linear or rising exponential functions.
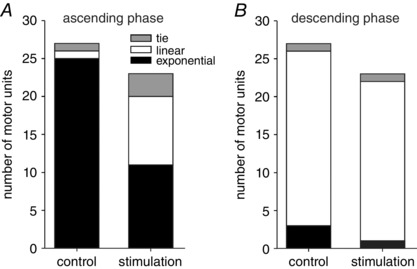
A, ascending phase of triangular contractions. In control conditions, firing rate profiles for majority of MUs (25/27) were best fitted with rising exponentials (black fill). Only one MU was best fitted as a linear function (open fill) and one MU had equal number of trials best fitted by exponential and linear functions, and therefore was designated as a tie (grey fill). During stimulation, the number of MUs best fitted with linear functions increased and was nearly the same as that fitted with exponentials. B, descending phase of triangular contractions. For control and stimulation conditions, firing rate profiles for majority of MUs were best fitted with linear functions.
Because sural nerve stimulation did not entirely eliminate cases of ascending spike trains best fitted by rising exponentials, we also investigated whether stimulation affected the shape of the rising exponential. The force constant, ϕ, from eqn (1), provides a measure of the curvature of the rising exponential. A small force constant indicates that the curve rises more steeply (i.e. smaller change in force associated with 63% of maximum firing rate) whereas a larger force constant indicates that the curve has a more gradual slope. We analysed the force constants of the rising phases of only those MUs best fitted by rising exponentials during stimulation (n = 11 MUs) and compared those values to their average force constants in the absence of stimulation. During stimulation, there was a significant increase in the magnitude of the force constant ϕ for these MUs (control 0.64 ± 0.19% MVC, stimulation 1.72 ± 1.51% MVC, P = 0.007, paired t test) indicating that sural nerve stimulation tended to flatten the rate of rise of firing rate with increased force.
Other aspects of MU activity that might have been affected by sural nerve stimulation are thresholds of recruitment and derecruitment. For the MU depicted in Fig. 3, for example, recruitment force decreased from about 3% MVC (red trace, Fig. 3 A) to about 1.5% MVC (red trace, Fig. 3 B) with stimulation. This effect, however, was not consistent across all MUs. Figure 5 A shows the recruitment force for all 27 MUs in the control condition and during sural nerve stimulation. While several MUs showed a decrease in recruitment threshold with stimulation (like that in Fig. 3), many showed an increase, including substantial increases in five MUs. The reason for this marked shift in recruitment threshold for these units was not clear but may partially be related to reversals in recruitment order that can occur during cutaneous stimulation (Kanda et al. 1977; Stephens et al. 1978; Garnett & Stephens, 1981). Nevertheless, because of the high degree of variability, there was no significant difference (P = 0.13, Wilcoxon signed rank test) in recruitment threshold force between control (1.7 ± 1.2% MVC) and stimulation conditions (2.9 ± 3.7% MVC).
Figure 5. Changes in MU recruitment and derecruitment forces in response to sural nerve stimulation.
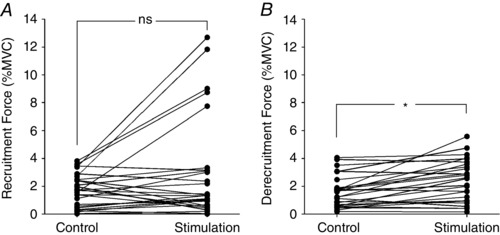
A, recruitment force for all 27 MUs during control conditions and during sural nerve stimulation. With stimulation, five MUs exhibited a relatively large increase in recruitment force, whereas recruitment force decreased in several others. Overall, there was no significant (ns) change in recruitment force with sural nerve stimulation. B, derecruitment force was modestly higher for several MUs during sural nerve stimulation. Overall there was a significant (* P < 0.001) increase in force at which units were derecruited during sural nerve stimulation.
Interestingly, derecruitment thresholds (Fig. 5 B) were significantly higher (P < 0.001, Wilcoxon signed rank test) in the stimulation condition (2.4 ± 1.5% MVC) compared to control (1.6 ± 1.1% MVC). Within conditions, there were no significant differences between recruitment and derecruitment forces for the control condition (P = 0.75) or for the stimulation condition (P = 0.32).
Discussion
Here we have shown that during the ascending phase of weak isometric contractions, the relationship between firing rate and force for most tibialis anterior MUs is best represented as a saturating (i.e. rising exponential) function. This finding is similar to that reported for a variety of human muscles (Bracchi et al. 1966; Monster & Chan, 1977; De Luca et al. 1982; Kiehn & Eken, 1997; McGill et al. 2005; Moritz et al. 2005; Bailey et al. 2007; Mottram et al. 2009, 2014; De Luca & Contessa, 2012; Fuglevand et al. 2015). Such firing rate saturation is also clearly evident in soleus motor units of decerebrate cat during slow muscle stretch (Grillner & Udo, 1971). We have shown here that artificial activation of an inhibitory pathway during the performance of voluntary contractions transformed force–firing rate relations for the ascending phase from sharply rising exponentials to linear functions or to ones with less steeply rising exponentials. In addition, we also have shown the relationship between firing rate and force during the descending phase of voluntary contractions to be linear for the majority of MUs studied. While differences in firing rate profiles between ascending and descending phases of voluntary contractions are evident in number of published records (e.g. Kiehn & Eken, 1997; Heckman et al. 2005; Mottram et al. 2009, 2014; Udina et al. 2010), we are unaware of previous studies that have quantified this difference. Furthermore, this dissimilarity implies that the processes shaping MN activity and regulating force production differ in fundamental ways during these two phases. Below we consider how PICs might contribute differentially to the control of MN activity during the ascending and descending phases of voluntary contractions following a brief discussion of some limitations of the present study.
Limitations
The most significant limitation of the present study was the low number of subjects in whom we could clearly demonstrate inhibition of the TA using sural nerve stimulation. We believe that this was primarily a consequence of the limited output capacity of our stimulator. As a result, the number of MUs whose activities we studied in the presence and absence of sural nerve‐mediated synaptic inhibition was modest.
Another limitation was an inbuilt order effect in the stimulation procedures. Stimulation always began with the ascending phase and then continued into the descending phase. Therefore, the differential effects of stimulation on firing rate patterns in ascending and descending phases might have been due to some diminution in the efficacy of the inhibitory reflex in the latter portions of the triangular ramp contractions. The cutaneous silent period reflex, however, appears to exhibit little habituation (Uncini et al. 1991) and as such, it seems possible that subjects would have received relatively constant levels of inhibition, although there was no way to test this directly.
A third limitation of the present study is that we examined firing rate responses only of low‐threshold MUs and for weak forces. This is a long‐standing shortcoming associated with single microelectrode recording of extracellular potentials as used here. With increased intensity of muscle contraction (and activation of higher‐threshold motor units), the number of units whose activities are detected by the electrode increases and that, in turn, hinders the ability to follow reliably the spiking of individual motor units. New multi‐electrode methods (Lapatki et al. 2004; Nawab et al. 2010) involving novel sorting algorithms (Holobar et al. 2014) will need to be used in future studies to determine whether high‐threshold motor units respond similarly to the low‐threshold units studied here.
Possible mechanisms
Based on our experiments, it is not possible to draw definitive conclusions as to the mechanisms underlying (1) the change of firing rate behaviour from saturating toward linear with sural nerve stimulation or (2) differences in firing rate profiles between ascending and descending phases of contractions. Nevertheless, previous findings using reduced preparations provide crucial insights as to how interaction between synaptic inputs and intrinsic properties of MNs (and in particular, PICs) might partially account for some of the present observations. Figure 6 depicts schematically a simplified representation of such interactions.
Figure 6. Schematic representation of synaptic and intrinsic currents acting on a motor neuron during contractions in absence (A) and presence (B) of sural nerve stimulation.
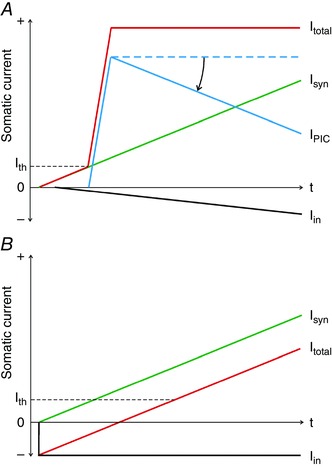
A, during an ascending contraction, excitatory synaptic current (I syn, green trace) that reaches soma (and spike‐initiating zone) is assumed to increase linearly. At recruitment threshold (I th) of the neuron, a PIC is rapidly activated (I PIC, blue trace). The total somatic current (I total = I syn + I PIC, red trace) will therefore exhibit an initial steep rise at recruitment threshold that could contribute to an initial sharp increase in motor unit firing rate. Increasing synaptic inhibition (I in, black trace) with increased intensity of muscle contraction might reduce I PIC (curved arrow) and thereby lead to a levelling off of I total and contribute to saturation in motor unit firing rate. B, in the presence of sustained, strong synaptic inhibition (I in) mediated by sural nerve stimulation, PICs may be prevented from activating. In such a case, I total may increase linearly and in direct proportion to I syn. The total excitatory synaptic current (I syn) needed to bring the neuron to threshold, however, would need to be higher than in the control case in order to offset the sustained inhibitory current. [Colour figure can be viewed at wileyonlinelibrary.com]
In this scheme, the effective synaptic current (green trace, Isyn, Fig. 6 A) arriving at the soma and spike‐initiating zone of a MN from excitatory synaptic sources is considered to increase linearly during the ascending phase of a contraction. Because synaptic inputs tend to be broadly distributed across a motor nucleus (Mendell & Henneman, 1971; Brown & Fyffe, 1978; Lawrence et al. 1985; Mantel & Lemon, 1987), it is assumed that similar synaptic currents (I syn) would be imposed simultaneously across most members of the MN pool. Furthermore, computer models have shown isometric muscle force to be a near‐linear function of this distributed excitatory synaptic current over most of the force range (Heckman & Binder, 1991; Fuglevand et al. 1993).
It is also assumed, based on experimental work of Bennett and colleagues (1998), that PICs become activated near the threshold (I th, Fig. 6 A) for activation of spiking conductances. Furthermore, such PICs engage abruptly and more or less fully even during gradually increasing synaptic excitation (Bennett et al. 1998). The additional current provided by the PIC (blue trace, I pic, Fig. 6 A) can be substantial, perhaps even larger than that furnished by synaptic drive alone (Bennett et al. 1998; Lee & Heckman, 1998, 2000). Because PICs are mediated by voltage‐gated conductances, and because membrane depolarization depends in part on neuron‐specific properties (such as overall input resistance, which varies widely across a MN pool), activation of PICs should occur more or less separately in each MN (Fuglevand et al. 2015). This extra, sustained current would then sum with synaptic currents to yield a sharply rising total somatic current (red trace, I total, Fig. 6 A) when a MN is initially activated. Because MN firing rate is known to follow total somatic current in a near‐linear way (Granit et al. 1963, 1966; Kernell, 1965), the precipitous increase in total somatic current should underlie a steep rise in firing rate as seen in MUs during ascending contractions.
Now, if during the ascending contraction, inhibitory inputs originating from peripheral receptors (via interposed interneurons) and Renshaw cells also increased (downward‐going black trace, I in, Fig. 6 A), then this might reduce the magnitude or deactivate PICs altogether (curved arrow, Fig. 6 A) (Crone et al. 1988; Hounsgaard et al. 1988; Hultborn et al. 2003; Kuo et al. 2003; Hyngstrom et al. 2007; Bui et al. 2008). In addition, PIC magnitudes may naturally decay over time even in the absence of inhibition (Hounsgaard & Kiehn, 1989; Lee & Heckman, 1998; Li & Bennett, 2003). Collectively, this could lead to a levelling‐off of the total somatic current and contribute to saturation in MU firing rates seen experimentally. Furthermore, such quenching of PICs during the ascending phase would mean that MN activity during the subsequent descending phase would be primarily regulated by synaptic inputs – a scenario more likely to be associated with linear firing rate responses.
In the experiments performed here, we artificially delivered synaptic inhibition to tibialis anterior MNs just prior to and throughout a triangular ramp contraction under the premise that this might prevent full expression of PICs. In such a case, and in the context of the scheme depicted in Fig. 6 B, the total somatic current (I total) would be the sum of the voluntarily delivered synaptic current (I syn) and the artificially engaged synaptic inhibition (I in, Fig. 6 B; other forms of naturally occurring synaptic inhibition are not shown for simplicity). In order to overcome the negative current bias provided by the sustained, artificial synaptic inhibition, more excitatory synaptic current would need to be delivered to bring MNs to threshold. Such an increased excitatory synaptic drive (mainly arising from descending pathways) to achieve the same recruitment outcome might partly underlie the increased sense of effort experienced by subjects during ramp contractions in the presence of sural nerve stimulation. Also, the absence of the sizable depolarizing current normally provided by PICs might necessitate additional voluntary synaptic drive, and further contribute to enhanced sense of effort. Moreover, under such conditions involving sustained inhibition, the I total (Fig. 6 B) current might increase more or less linearly, which should be reflected in a more linearized firing rate response, as was generally observed in the present experiments.
An important question, however, relates to why PICs would not eventually activate during sustained inhibition when synaptic excitation is sufficiently strong to bring the MN to or above spiking threshold (as in Fig. 6 B). It would seem that once the net dendritic membrane potential exceeds the activation threshold for PICs, then PICs should be ignited. Surprisingly, however, there is some evidence to suggest this does not occur. For example, Bennett et al. (1998) showed that PIC‐mediated plateau potentials were not instigated in cat MNs during strong synaptic inhibition even though current injected into the soma depolarized the membrane well beyond that associated with activation of plateau potentials in the absence of inhibition. Likewise, in simulation studies of MNs involving realistic dendritic distributions of PIC conductances and synapses, Bui and colleagues (2006) showed that when a relatively small proportion of inhibitory synapses were tonically activated, the abrupt increase in somatic current associated with PIC activation was nearly abolished despite synaptic excitation reaching maximum levels. Bui et al. (2006) did not discuss why PICs were not activated in the presence of inhibition. One possibility is that local (dendritic) decreases in input resistance associated with synaptic inhibition might markedly increase the extent of synaptic excitation needed to depolarize the dendritic membrane sufficiently to activate PICs. This possibility, and others, however, remain to be evaluated.
Collectively, our results here seem consistent with the scheme outlined in Fig. 6, such that PICs, in combination with time‐varying synaptic inhibition and excitation (Berg et al. 2007; Heckman et al. 2008; Powers et al. 2012) shape the firing rate responses of motor units during naturally occurring voluntary contractions. Certainly, this idea requires additional experimental work to evaluate its validity. Furthermore, it leaves unanswered a number of important questions, including the functional significance (and necessity) of such complex processes for activating motor neurons, and the degree to which other neurons in the CNS use similar processes.
Additional information
Competing interests
None declared.
Author contributions
Both authors contributed to the conception and design of the experiments, the collection and assembly of data, data analysis and interpretation, and writing of the manuscript. Both authors have approved the final version of the manuscript and agree to be accountable for all aspects of the work. All persons designated as authors qualify for authorship, and all those who qualify for authorship are listed.
Funding
This work was supported by National Institutes of Health grant R01NS079147.
References
- Bailey EF, Rice AD & Fuglevand AJ (2007). Firing patterns of human genioglossus motor units during voluntary tongue movement. J Neurophysiol 97, 933–936. [DOI] [PubMed] [Google Scholar]
- Bennett DJ, Hultborn H, Fedirchuk B & Gorassini M (1998). Synaptic activation of plateaus in hindlimb motoneurons of decerebrate cats. J Neurophysiol 80, 2023–2037. [DOI] [PubMed] [Google Scholar]
- Berg RW, Alaburda A & Hounsgaard J (2007). Balanced inhibition and excitation drive spike activity in spinal half‐centers. Science 315, 390–393. [DOI] [PubMed] [Google Scholar]
- Bracchi F, Decandia M & Gualtierotti T (1966). Frequency stabilization in the motor centers of spinal cord and caudal brain stem. Am J Physiol 210, 1170–1177. [DOI] [PubMed] [Google Scholar]
- Brown A & Fyffe R (1978). The morphology of group Ia afferent fibre collaterals in the spinal cord of the cat. J Physiol 274, 111–127. [DOI] [PMC free article] [PubMed] [Google Scholar]
- Bui TV, Grande G & Rose PK (2008). Multiple modes of amplification of synaptic inhibition to motoneurons by persistent inward currents. J Neurophysiol 99, 571–582. [DOI] [PMC free article] [PubMed] [Google Scholar]
- Bui TV, Ter‐Mikaelian M, Bedrossian D & Rose PK (2006). Computational estimation of the distribution of L‐type Ca2+ channels in motoneurons based on variable threshold of activation of persistent inward currents. J Neurophysiol 95, 225–241. [DOI] [PubMed] [Google Scholar]
- Carlin KP, Jones KE, Jiang Z, Jordan LM & Brownstone RM (2000). Dendritic L‐type calcium currents in mouse spinal motoneurons: implications for bistability. Eur J Neurosci 12, 1635–1646. [DOI] [PubMed] [Google Scholar]
- Clark BD, Dacko SM & Cope TC (1993). Cutaneous stimulation fails to alter motor unit recruitment in the decerebrate cat. J Neurophysiol 70, 1433–1439. [DOI] [PubMed] [Google Scholar]
- Crone C, Hultborn H, Kiehn O, Mazieres L & Wigstrom H (1988). Maintained changes in motoneuronal excitability by short‐lasting synaptic inputs in the decerebrate cat. J Physiol 405, 321–343. [DOI] [PMC free article] [PubMed] [Google Scholar]
- De Luca CJ & Contessa P (2012). Hierarchical control of motor units in voluntary contractions. J Neurophysiol 107, 178–195. [DOI] [PMC free article] [PubMed] [Google Scholar]
- De Luca CJ, LeFever RS, McCue MP & Xenakis AP (1982). Behaviour of human motor units in different muscles during linearly varying contractions. J Physiol 329, 113–128. [DOI] [PMC free article] [PubMed] [Google Scholar]
- Floeter MK (2003). Cutaneous silent periods. Muscle Nerve 28, 391–401. [DOI] [PubMed] [Google Scholar]
- Fuglevand AJ, Dutoit AP, Johns RK & Keen DA (2006). Evaluation of plateau‐potential‐mediated ‘warm up’ in human motor units. J Physiol 571, 683–693. [DOI] [PMC free article] [PubMed] [Google Scholar]
- Fuglevand AJ, Lester RA & Johns RK (2015). Distinguishing intrinsic from extrinsic factors underlying firing rate saturation in human motor units. J Neurophysiol 113, 1310–1322. [DOI] [PMC free article] [PubMed] [Google Scholar]
- Fuglevand AJ, Winter DA & Patla AE (1993). Models of recruitment and rate coding organization in motor‐unit pools. J Neurophysiol 70, 2470–2488. [DOI] [PubMed] [Google Scholar]
- Garnett R & Stephens JA (1981). Changes in the recruitment threshold of motor units produced by cutaneous stimulation in man. J Physiol 311, 463–473. [DOI] [PMC free article] [PubMed] [Google Scholar]
- Granit R, Kernell D & Lamarre Y (1966). Algebraical summation in synaptic activation of motoneurones firing within the ‘primary range’ to injected currents. J Physiol 187, 379–399. [DOI] [PMC free article] [PubMed] [Google Scholar]
- Granit R, Kernell D & Shortess GK (1963). Quantitative aspects of repetitive firing of mammalian motoneurones, caused by injected currents. J Physiol 168, 911–931. [DOI] [PMC free article] [PubMed] [Google Scholar]
- Grillner S & Udo M (1971). Motor unit activity and stiffness of the contracting muscle fibres in the tonic stretch reflex. Acta Physiol Scand 81, 422–424. [DOI] [PubMed] [Google Scholar]
- Heckman CJ & Binder MD (1991). Computer simulation of the steady‐state input‐output function of the cat medial gastrocnemius motoneuron pool. J Neurophysiol 65, 952–967. [DOI] [PubMed] [Google Scholar]
- Heckman CJ & Enoka RM (2012). Motor Unit. John Wiley & Sons, Inc, Hoboken, NJ, USA. [Google Scholar]
- Heckman CJ, Gorassini MA & Bennett DJ (2005). Persistent inward currents in motoneuron dendrites: implications for motor output. Muscle Nerve 31, 135–156. [DOI] [PubMed] [Google Scholar]
- Heckman CJ, Hyngstrom AS & Johnson MD (2008). Active properties of motoneurone dendrites: diffuse descending neuromodulation, focused local inhibition. J Physiol 586, 1225–1231. [DOI] [PMC free article] [PubMed] [Google Scholar]
- Heckman CJ, Mottram C, Quinlan K, Theiss R & Schuster J (2009). Motoneuron excitability: the importance of neuromodulatory inputs. Clin Neurophysiol 120, 2040–2054. [DOI] [PMC free article] [PubMed] [Google Scholar]
- Holobar A, Minetto MA & Farina D (2014). Accurate identification of motor unit discharge patterns from high‐density surface EMG and validation with a novel signal‐based performance metric. J Neural Eng 11, 016008. [DOI] [PubMed] [Google Scholar]
- Hornby TG, McDonagh JC, Reinking RM & Stuart DG (2002). Motoneurons: a preferred firing range across vertebrate species? Muscle Nerve 25, 632–648. [DOI] [PubMed] [Google Scholar]
- Hounsgaard J, Hultborn H, Jespersen B & Kiehn O (1988). Bistability of alpha‐motoneurones in the decerebrate cat and in the acute spinal cat after intravenous 5‐hydroxytryptophan. J Physiol 405, 345–367. [DOI] [PMC free article] [PubMed] [Google Scholar]
- Hounsgaard J & Kiehn O (1989). Serotonin‐induced bistability of turtle motoneurones caused by a nifedipine‐sensitive calcium plateau potential. J Physiol 414, 265–282. [DOI] [PMC free article] [PubMed] [Google Scholar]
- Hounsgaard J & Kiehn O (1993). Calcium spikes and calcium plateaux evoked by differential polarization in dendrites of turtle motoneurones in vitro . J Physiol 468, 245–259. [DOI] [PMC free article] [PubMed] [Google Scholar]
- Hultborn H, Denton ME, Wienecke J & Nielsen JB (2003). Variable amplification of synaptic input to cat spinal motoneurones by dendritic persistent inward current. J Physiol 552, 945–952. [DOI] [PMC free article] [PubMed] [Google Scholar]
- Hyngstrom AS, Johnson MD, Miller JF & Heckman CJ (2007). Intrinsic electrical properties of spinal motoneurons vary with joint angle. Nat Neurosci 10, 363–369. [DOI] [PubMed] [Google Scholar]
- Kanda K, Burke RE & Walmsley B (1977). Differential control of fast and slow twitch motor units in the decerebrate cat. Exp Brain Res 29, 57–74. [DOI] [PubMed] [Google Scholar]
- Kernell D (1965). The adaptation and the relation between discharge frequency and current strength of cat lumbosacral motoneurones stimulated by long‐lasting injected currents. Acta Physiol Scand 65, 65–73. [DOI] [PubMed] [Google Scholar]
- Kernell D (1969). Synaptic conductance changes and the repetitive impulse discharge of spinal motoneurones. Brain Res 15, 291–294. [DOI] [PubMed] [Google Scholar]
- Kernell D (2006). The Motoneurone and Its Muscle Fibres. Oxford University Press, Oxford. [Google Scholar]
- Kernell D & Sjöholm H (1973). Repetitive impulse firing: comparisons between neurone models based on ‘voltage clamp equations’ and spinal motoneurones. Acta Physiol Scand 87, 40–56. [DOI] [PubMed] [Google Scholar]
- Kiehn O & Eken T (1997). Prolonged firing in motor units: evidence of plateau potentials in human motoneurons? J Neurophysiol 78, 3061–3068. [DOI] [PubMed] [Google Scholar]
- Kuo JJ, Lee RH, Johnson MD, Heckman HM & Heckman CJ (2003). Active dendritic integration of inhibitory synaptic inputs in vivo. J Neurophysiol 90, 3617–3624. [DOI] [PubMed] [Google Scholar]
- Lapatki BG, van Dijk JP, Jonas IE, Zwarts MJ & Stegeman DF (2004). A thin, flexible multielectrode grid for high‐density surface EMG. J Appl Physiol (1985) 96, 327–336. [DOI] [PubMed] [Google Scholar]
- Lawrence DG, Porter R & Redman SJ (1985). Corticomotoneuronal synapses in the monkey: light microscopic localization upon motoneurons of intrinsic muscles of the hand. J Comp Neurol 232, 499–510. [DOI] [PubMed] [Google Scholar]
- Lee RH & Heckman CJ (1996). Influence of voltage‐sensitive dendritic conductances on bistable firing and effective synaptic current in cat spinal motoneurons in vivo. J Neurophysiol 76, 2107–2110. [DOI] [PubMed] [Google Scholar]
- Lee RH & Heckman CJ (1998). Bistability in spinal motoneurons in vivo: systematic variations in persistent inward currents. J Neurophysiol 80, 583–593. [DOI] [PubMed] [Google Scholar]
- Lee RH & Heckman CJ (2000). Adjustable amplification of synaptic input in the dendrites of spinal motoneurons in vivo. J Neurosci 20, 6734–6740. [DOI] [PMC free article] [PubMed] [Google Scholar]
- Li Y & Bennett DJ (2003). Persistent sodium and calcium currents cause plateau potentials in motoneurons of chronic spinal rats. J Neurophysiol 90, 857–869. [DOI] [PubMed] [Google Scholar]
- McCloskey DI (1981). Corollary discharges, motor commands and perception In Handbook of Physiology, section 1, The Nervous System, vol. II, part 2, ed. Brookhart JM. & Mountcastle VB, pp. 1415–1447. American Physiological Society, Bethesda, MD, USA. [Google Scholar]
- McGill KC, Lateva ZC & Marateb HR (2005). EMGLAB: an interactive EMG decomposition program. J Neurosci Methods 149, 121–133. [DOI] [PubMed] [Google Scholar]
- Mantel G & Lemon RN (1987). Cross‐correlation reveals facilitation of single motor units in thenar muscles by single corticospinal neurones in the conscious monkey. Neurosci Lett 77, 113–118. [DOI] [PubMed] [Google Scholar]
- Mendell LM & Henneman E (1971). Terminals of single Ia fibers, location, density, and distribution within a pool of 300 homonymous motoneurons. J Neurophysiol 34, 171–187. [DOI] [PubMed] [Google Scholar]
- Miller JF, Paul KD, Lee RH, Rymer WZ & Heckman CJ (1996). Restoration of extensor excitability in the acute spinal cat by the 5‐HT2 agonist DOI. J Neurophysiol 75, 620–628. [DOI] [PubMed] [Google Scholar]
- Monster AW & Chan H (1977). Isometric force production by motor units of extensor digitorum communis muscle in man. J Neurophysiol 40, 1432–1443. [DOI] [PubMed] [Google Scholar]
- Moritz CT, Barry BK, Pascoe MA & Enoka RM (2005). Discharge rate variability influences the variation in force fluctuations across the working range of a hand muscle. J Neurophysiol 93, 2449–2459. [DOI] [PubMed] [Google Scholar]
- Mottram CJ, Heckman CJ, Powers RK, Rymer WZ & Suresh NL (2014). Disturbances of motor unit rate modulation are prevalent in muscles of spastic‐paretic stroke survivors. J Neurophysiol 111, 2017–2028. [DOI] [PMC free article] [PubMed] [Google Scholar]
- Mottram CJ, Suresh NL, Heckman C, Gorassini MA & Rymer WZ (2009). Origins of abnormal excitability in biceps brachii motoneurons of spastic‐paretic stroke survivors. J Neurophysiol 102, 2026–2038. [DOI] [PMC free article] [PubMed] [Google Scholar]
- Nawab SH, Chang S‐S & De Luca CJ (2010). High‐yield decomposition of surface EMG signals. Clin Neurophysiol 121, 1602–1615. [DOI] [PMC free article] [PubMed] [Google Scholar]
- Powers RK, Elbasiouny SM, Rymer WZ & Heckman CJ (2012). Contribution of intrinsic properties and synaptic inputs to motoneuron discharge patterns, a simulation study. J Neurophysiol 107, 808–823. [DOI] [PMC free article] [PubMed] [Google Scholar]
- Powers RK, Robinson FR, Konodi MA & Binder MD (1992). Effective synaptic current can be estimated from measurements of neuronal discharge. J Neurophysiol 68, 964–968. [DOI] [PubMed] [Google Scholar]
- Schwindt PC (1973). Membrane‐potential trajectories underlying motoneuron rhythmic firing at high rates. J Neurophysiol 36, 434–439. [DOI] [PubMed] [Google Scholar]
- Schwindt PC & Calvin WH (1972). Membrane‐potential trajectories between spikes underlying motoneuron firing rates. J Neurophysiol 35, 311–325. [DOI] [PubMed] [Google Scholar]
- Schwindt PC & Calvin WH (1973). Equivalence of synaptic and injected current in determining the membrane potential trajectory during motoneuron rhythmic firing. Brain Res 59, 389–394. [DOI] [PubMed] [Google Scholar]
- Schwindt PC & Crill WE (1982). Factors influencing motoneuron rhythmic firing: results from a voltage‐clamp study. J Neurophysiol 48, 875–890. [DOI] [PubMed] [Google Scholar]
- Stephens JA, Garnett R & Buller NP (1978). Reversal of recruitment order of single motor units produced by cutaneous stimulation during voluntary muscle contraction in man. Nature 272, 362–364. [DOI] [PubMed] [Google Scholar]
- Türker KS & Powers RK (2001). Effects of common excitatory and inhibitory inputs on motoneuron synchronization. J Neurophysiol 86, 2807–2822. [DOI] [PubMed] [Google Scholar]
- Udina E, D'Amico J, Bergquist AJ & Gorassini MA (2010). amphetamine increases persistent inward currents in human motoneurons estimated from paired motor‐unit activity. J Neurophysiol 103, 1295–1303. [DOI] [PMC free article] [PubMed] [Google Scholar]
- Uncini A, Kujirai T, Gluck B & Pullman S (1991). Silent period induced by cutaneous stimulation. Electroencephalogr Clin Neurophysiol 81, 344–352. [DOI] [PubMed] [Google Scholar]
- Wakefield HE, Fregosi RF & Fuglevand AJ (2016). Current injection and receptor‐mediated excitation produce similar maximal firing rates in hypoglossal motor neurons. J Neurophysiol 115, 1307–1313. [DOI] [PMC free article] [PubMed] [Google Scholar]
- Yao W, Fuglevand AJ & Enoka RM (2000). Motor‐unit synchronization increases EMG amplitude and decreases force steadiness of simulated contractions. J Neurophysiol 83, 441–452. [DOI] [PubMed] [Google Scholar]