

Abstract
Key points
A polymorphism of human AE3 is associated with idiopathic generalized epilepsy. Knockout of AE3 in mice lowers the threshold for triggering epileptic seizures. The explanations for these effects are elusive.
Comparisons of cells from wild‐type vs. AE3–/– mice show that AE3 (present in hippocampal neurons, not astrocytes; mediates HCO3 – efflux) enhances intracellular pH (pHi) recovery (decrease) from alkali loads in neurons and, surprisingly, adjacent astrocytes.
During metabolic acidosis (MAc), AE3 speeds initial acidification, but limits the extent of pHi decrease in neurons and astrocytes.
AE3 speeds re‐alkalization after removal of MAc in neurons and astrocytes, and speeds neuronal pHi recovery from an ammonium prepulse‐induced acid load.
We propose that neuronal AE3 indirectly increases acid extrusion in (a) neurons via Cl– loading, and (b) astrocytes by somehow enhancing NBCe1 (major acid extruder). The latter would enhance depolarization‐induced alkalinization of astrocytes, and extracellular acidification, and thereby reduce susceptibility to epileptic seizures.
Abstract
The anion exchanger AE3, expressed in hippocampal (HC) neurons but not astrocytes, contributes to intracellular pH (pHi) regulation by facilitating the exchange of extracellular Cl– for intracellular HCO3 –. The human AE3 polymorphism A867D is associated with idiopathic generalized epilepsy. Moreover, AE3 knockout (AE3–/–) mice are more susceptible to epileptic seizure. The mechanism of these effects has been unclear because the starting pHi in AE3–/– and wild‐type neurons is indistinguishable. The purpose of the present study was to use AE3–/– mice to investigate the role of AE3 in pHi homeostasis in HC neurons, co‐cultured with astrocytes. We find that the presence of AE3 increases the acidification rate constant during pHi recovery from intracellular alkaline loads imposed by reducing [CO2]. The presence of AE3 also speeds intracellular acidification during the early phase of metabolic acidosis (MAc), not just in neurons but, surprisingly, in adjacent astrocytes. Additionally, AE3 contributes to braking the decrease in pHi later during MAc in both neurons and astrocytes. Paradoxically, AE3 enhances intracellular re‐alkalization after MAc removal in neurons and astrocytes, and pHi recovery from an ammonium prepulse‐induced acid load in neurons. The effects of AE3 knockout on astrocytic pHi homeostasis in MAc‐related assays require the presence of neurons, and are consistent with the hypothesis that the AE3 knockout reduces functional expression of astrocytic NBCe1. These findings suggest a new type of neuron–astrocyte communication, based on the expression of AE3 in neurons, which could explain how AE3 reduces seizure susceptibility.
Keywords: acid‐base balance, acid‐extrusion rate from cells, acid‐loading rate of cells, anion exchanger, Slc4a3
Key points
A polymorphism of human AE3 is associated with idiopathic generalized epilepsy. Knockout of AE3 in mice lowers the threshold for triggering epileptic seizures. The explanations for these effects are elusive.
Comparisons of cells from wild‐type vs. AE3–/– mice show that AE3 (present in hippocampal neurons, not astrocytes; mediates HCO3 – efflux) enhances intracellular pH (pHi) recovery (decrease) from alkali loads in neurons and, surprisingly, adjacent astrocytes.
During metabolic acidosis (MAc), AE3 speeds initial acidification, but limits the extent of pHi decrease in neurons and astrocytes.
AE3 speeds re‐alkalization after removal of MAc in neurons and astrocytes, and speeds neuronal pHi recovery from an ammonium prepulse‐induced acid load.
We propose that neuronal AE3 indirectly increases acid extrusion in (a) neurons via Cl– loading, and (b) astrocytes by somehow enhancing NBCe1 (major acid extruder). The latter would enhance depolarization‐induced alkalinization of astrocytes, and extracellular acidification, and thereby reduce susceptibility to epileptic seizures.
Abbreviations
- AE3
Cl−–HCO3 − exchanger 3
- AE3–/–
AE3 knockout
- AE3A–/–
AE3–/– astrocyte
- AE3AOC−/−
AE3−/− astrocytes from astrocyte‐only cultures
- AE3N–/–
AE3–/– neuron
- AOC
astrocyte‐only culture
- AOI
area of interest
- BCECF‐AM
(2',7'‐bis‐2‐carboxyethyl)‐5(and‐6) carboxyfluorescein acetoxymethyl ester
- DIA
depolarization‐induced alkalization
- (dpHi/dt)early
initial acidification rate during metabolic acidosis exposure
- (dpHi/dt)late
acidification rate late in metabolic acidosis
- HBS
Hepes‐buffered saline
- HC
hippocampus
- JE
acid extrusion
- JL
acid loading
- kdown
rate constant when pHi is descending
- kup
rate constant when pHi is ascending
- MAc
metabolic acidosis
- NBCe1
electrogenic Na+/HCO3 − cotransporter
- NBCn1
electroneutral Na+/HCO3 − cotransporter
- NDCBE
Na+‐driven Cl−–HCO3 − exchanger
- NHE
Na+–H+ exchanger
- pHi
intracellular pH
- pHo
extracellular pH
- WT
wild‐type
- WTA
WT astrocyte
- WTN
WT neuron
- WTAOC
WT astrocytes from astrocyte‐only cultures
Introduction
Changes in extracellular pH (pHo) or intracellular pH (pHi) have important effects on a wide range of cell functions (Busa & Nuccitelli, 1984; Busa, 1986; Chesler, 2003; Putnam et al. 2004). Metabolic acidosis (MAc), which is a decrease in pHo caused by a decrease in extracellular [HCO3 –]o at a fixed extracellular [CO2]o, is a common pHo disturbance that can affect the extracellular microenvironment in the central nervous system. When challenged by MAc, neurons (Ritucci et al. 1998; Wang et al. 2002; Bouyer et al. 2004; Salameh et al. 2014) and astrocytes (Salameh et al. 2014) generally exhibit a fall in pHi.
In the steady state, pHi is stable because the overall rate of acid extrusion (J E, determined by H+ efflux, HCO3 – influx, etc.) equals the overall rate of acid loading (J L, determined by H+ influx, HCO3 – efflux, metabolic production of acid, etc.). The pHi response of a cell to MAc depends on how MAc affects pHi dependence of J E and J L (Roos & Boron, 1981; Boron, 2004; Bevensee & Boron, 2013). In the hippocampus (HC), the major acid extruders are: Na+‐coupled bicarbonate transporters in the SLC4 family (Schwiening & Boron, 1994; Bevensee et al. 2000; Giffard et al. 2000; Romero et al. 2013), Na+–H+ exchangers in the SLC9 family (Ma & Haddad, 1997; Donowitz et al. 2013), vacuolar H+ pumps (Murata et al. 2002), monocarboxylate cotransporters in the SLC16 family that can mediate the efflux of lactate acid (Pierre et al. 2000; Halestrap, 2013), and the voltage‐gated proton channel Hv1 (Wu et al. 2012; DeCoursey, 2013). Conversely, major acid loaders in the HC include Na+‐independent Cl−–HCO3 − exchangers (AE3) in the SLC4 family (Alper, 2009; Romero et al. 2013). Recent work shows that the electrogenic Na+/HCO3 − cotransporter NBCe1 (SLC4A4) readily reverses during intracellular alkali loads, when it can behave as an acid loader (Theparambil et al. 2015). Cl−–HCO3 − exchangers in the SLC26 family are also present in the brain (Alper & Sharma, 2013) and potentially contribute to HCO3 – efflux in the HC. Neurons and astrocytes have different complements of the previously mentioned acid–base transporters, which underlie fundamental differences in pHi homeostasis between these important cell types.
A major difference in acid–base physiology between HC neurons and astrocytes – and one that could be important in the response to MAc – is that neurons but not the astrocytes express AE3 (Kopito et al. 1989; Hentschke et al. 2006; Svichar et al. 2009). AE3 contributes to acid loading by facilitating the exchange of intracellular HCO3 – for extracellular Cl−. A role for AE3 in neuronal electrical activity was first implied by a human chromosomal‐mapping study that identified the region 2q36, which includes the SLC4A3 gene, as a region of interest associated with common idiopathic generalized epilepsy (Sander et al. 2000). Two years later, a follow‐up study linked the SLC4A3 polymorphism A867D to idiopathic generalized epilepsy (Sander et al. 2002). Later work on HEK293 cells showed that this polymorphism decreases AE3 activity without changing the protein expression levels or its trafficking to the plasma membrane (Vilas et al. 2009). Based on these data, one might hypothesize that decreased AE3 activity leads to a higher neuronal pHi and, because high pH is generally associated with increased excitability, to an increased susceptibility to epilepsy. To further investigate the role of AE3 in epilepsy, Hentschke et al. developed an AE3 knockout (AE3−/−) mouse and showed that, indeed, AE3 loss increases susceptibility to seizures (Hentschke et al. 2006). However, because these authors found that the steady‐state pHi is no higher in HC neurons from AE3−/− mice than from wild‐type (WT) mice, the mechanism by which AE3 dysfunction promotes epilepsy was not immediately clear. Nevertheless, AE3 does indeed function as an acid loader in HC neurons because the rapid rise in pHi caused by the influx of NH3 is substantially higher in hippocampal neurons from AE3−/− than from WT mice (Svichar et al. 2009).
In the present study, we examine the effect of knocking out AE3 on the ability of HC mouse neurons and co‐cultured astrocytes to recover from intracellular alkali loads, and the ability of these cells to resist the pHi effects of MAc. We find that, in hippocampal neurons, AE3 is a major contributor to the pHi recovery (i.e. acidification) from acute alkali loads, and also to the rapid, initial descent of pHi during MAc. However, paradoxically, AE3 is important for limiting the overall fall in neuronal pHi during MAc and, after an acid load imposed by an NH3/NH4 + prepulse, promoting acid extrusion. Another set of paradoxes emerge from the analyses of data from the adjacent astrocytes (which lack AE3). Compared to hippocampal astrocytes from WT mice, those from AE3−/− mice recover more slowly from acute alkali loads, have a lower steady‐state pHi under control acid–base conditions, exhibit a slower initial pHi decrease during MAc, and a slower initial pHi increase while recovering from MAc. The lower steady‐state pHi and the MAc‐related phenotype disappear when we culture astrocytes in the absence of neurons.
Methods
Ethical approval
Protocols for housing and handling of mice were approved by the Institutional Animal Care and Use Committee at Case Western Reserve University.
Cell culture
Hippocampal neurons and astrocytes in mixed cultures
In this study, we used WT and AE3−/− animals. The knockout animals were generated by Hentschke et al. (2006), and provided by Professor Hübner on a C57BL6 background. We then backcrossed these mice for 7–10 generations onto our standard laboratory WT strain of C57BL6 mice, which we derived from mice originally provided by Professor Alan Verkman as heterozygotes for the aquaporin 1 knockout (AQP1+/–). We obtained primary co‐cultures (never passaged) of hippocampal CA1 neurons and astrocytes from WT and AE3−/− mice, as described previously (Bouyer et al. 2004; Salameh et al. 2014). Briefly, we decapitated unanaesthetized postnatal day (P) 0 to P2 pups of both sexes and isolated the HC CA1 region. We then digested the tissue in a pH 7.40 Hepes‐buffered saline solution (37°C) that contained 1% papain (cat. no. LS003162, Worthington Biochemical Corp., Lakewood, NJ, USA), 5.5 mm l‐cysteine, and 1.1 mm EDTA. After 10 min of digestion, we triturated the tissue at 37°C in a 9.5% minimum essential medium (MEM, cat. no. 61100–103; GIBCO, BRL, Life Technologies Inc., Gaithersburg, MD, USA) to which we added 22 mm HCO3 –, 1.5% bovine serum albumin (cat. no. A7906, Sigma‐Aldrich, St Louis, MO, USA) and 1.5% trypsin inhibitor (cat. no. T9253, Sigma‐Aldrich). This trituration medium was equilibrated with 5% CO2 in a 37°C incubator, and had a pH of 7.40. Finally, we diluted the triturated suspension to a concentration of ∼1 × 10⁵ cells ml−1 and plated the cells on 12 mm gridded coverslips coated with 0.1% poly‐l‐ornithine and 2% laminin. The culture was incubated at 37°C and 5% CO2/balance air, in 1 ml of a culture media (70% complete media + 30% neurobasal media, cat. no. 21103, GIBCO), supplemented with 0.02% B27 (cat. no. 17504‐044, GIBCO), 10 ng ml−1 FGF‐5 (cat. no. F4537, Sigma‐Aldrich), and 1 ng ml−1 bFGF (cat. no. F0291, Sigma‐Aldrich). We made the complete (i.e. preconditioned) media in advance by incubating 200 μl of freshly dissociated cells (obtained as above after trituration) in MEM solution supplemented with 10% fetal bovine serum (FBS; cat. no. 26140‐079, GIBCO) and 0.02% penicillin/streptomycin (cat. no. 15140‐122, GIBCO) for 1 week, followed by filtration. We used the cells for physiological studies between days 14 and 30 in culture.
Astrocyte‐only cultures
To obtain primary astrocyte‐only cultures, we followed the protocol described by Du et al. (2010). Briefly, we obtained the HC tissue following the surgical procedure discussed above. To enrich astrocytes in the culture, we used a growth medium that consisted of Dulbecco's modified Eagle's medium (DMEM) containing, 2 mm glutamine, 10% FBS and 1% penicillin/streptomycin. We plated the cells on poly‐l‐ornithine‐coated glass coverslips at 37°C in a 5% CO2 incubator for at least 14 days. We changed the media every 3 days.
Solutions
Table 1 summarizes the compositions of the physiological solutions used in this study. For the solutions that contained CO2 and HCO3 –, we used NaOH to titrate the non‐CO2/HCO3 – components to the desired pH at 37°C, then added the HCO3 –, and finally equilibrated with CO2 for 30−40 min using a computerized gas‐mixing system (Series 4000; Environics, Tolland, CT, USA). We measured solution osmolalities using a vapour‐pressure osmometer (5520; Wescor Inc., Logan, UT, USA), and adjusted the osmolality to 300 ± 5 mosmol kg−1. We delivered the solutions to the experimental chamber via Tygon tubing (because of its low CO2 permeability) at 4 ml min−1 using syringe pumps (model 33; Harvard Apparatus, Holliston, MA, USA). We selected among solutions using a computerized valve system, and maintained solution temperature at 37°C by means of a water‐jacket system placed between the valves and the chamber.
Table 1.
Summary of physiological solutions
| 1 | 2 | 3 | 4 | 5 | 6 | 7 | |
|---|---|---|---|---|---|---|---|
| Components | Hepes‐ buffered saline (HBS) | 10% CO2 pre‐load solution | Control CO2/HCO3 − solution (Ctrl) | Metabolic acidosis solution (MAc) | MAc with 20 mm NH4 + | Control with 20 mm NH4 + | Metabolic acidosis 0 mm Cl− (MAc0Cl) |
| NaCl | 124 | 80 | 102 | 110 | 90 | 82 | 0 |
| KCl | 3 | 3 | 3 | 3 | 3 | 3 | 0 |
| CaCl2 | 2 | 2 | 2 | 2 | 2 | 2 | 0 |
| MgCl2 | 2 | 2 | 2 | 2 | 2 | 2 | 0 |
| NaHCO3 | 0 | 44 | 22 | 14 | 22 | 22 | 14 |
| NaH2PO4 | 1.3 | 1.3 | 1.3 | 1.3 | 1.3 | 1.3 | 1.3 |
| Glucose | 10.5 | 10.5 | 10.5 | 10.5 | 10.5 | 10.5 | 10.5 |
| Sodium gluconate | 0 | 0 | 0 | 0 | 0 | 0 | 110 |
| Potassium gluconate | 0 | 0 | 0 | 0 | 0 | 0 | 3 |
| Magnesiumgluconate | 0 | 0 | 0 | 0 | 0 | 0 | 4 |
| Calcium gluconate | 0 | 0 | 0 | 0 | 0 | 0 | 6 |
| NH4Cl | 0 | 0 | 0 | 0 | 20 | 20 | 0 |
| CO2 (%) | 0 | 10 | 5 | 5 | 5 | 5 | 5 |
| Hepes | 32.5 | 32.5 | 32.5 | 32.5 | 32.5 | 32.5 | 32.5 |
| pH | 7.4 | 7.4 | 7.4 | 7.2 | 7.2 | 7.4 | 7.2 |
The concentrations are in mm except for CO2 (given in %). In Cl−‐free solutions, we increase [Ca2+] and [Mg2+] as described previously (Schwiening & Boron, 1994) because gluconate is a Ca2+ chelator.
Fluorescence recordings
For pHi recording, we used the same equipment as described previously (Bouyer et al. 2004; Salameh et al. 2014). Briefly, a gridded coverslip with cells attached was removed from the incubator and fixed to our perfusion chamber, forming its floor. To the assembled chamber, we added a few drops of a variant of Hepes‐buffered saline (HBS) (Table 1, solution 1 at room temperature) that contained 10 μm of the pH‐sensitive dye (2′,7′‐bis‐2‐carboxyethyl)‐5(and‐6) carboxyfluorescein acetoxymethyl ester (BCECF‐AM). We then mounted the chamber on the automated stage of an Olympus IX‐81 microscope equipped with epi‐fluorescence imaging. After ∼15 min, we commenced flow of HBS at 37°C, alternately exciting the BCECF at 440 nm and 490 nm, while recording at emission wavelengths >530 nm, to record changes in pHi. The exposure time for each of the two excitation wavelengths was 100 ms, separated by ∼20 ms. We acquired a 440 nm and a 490 nm data pair every 5 s. Slidebook 5.0 software (Intelligent Imaging Innovation, Denver, CO, USA) provided data acquisition. We calculated the rate constant for the disappearance of dye (−k 440) for neurons and astrocytes continuously throughout our experiments. We show two examples of −k 440 time courses in Fig. 5. We regarded the cells as healthy if the absolute value of −k 440 is less than 5% min–1 (Bevensee et al. 1995), and only included healthy cells in the analysis.
Figure 5. Responses of pHi to Cl– removal during NH3/NH4 + washout in WT hippocampal neurons and astrocytes in mixed culture.

A, example of a pHi record from a HC neuron (representative of 11 neurons from 2 cultures on 4 coverslips). B, example of a pHi record from a HC astrocyte (representative of 9 astrocytes from the same 2 cultures and the same 4 coverslips as in the neuron experiments). In both cases, we switched from extracellular solution 4 to solution 5, and then to solution 7. The pHi records in A and B come from the same experiment (i.e. cells on the same coverslip). The lower portions of each panel show the time course of –k 440, computed as described in Methods; –k 440 values <4% min–1 correlate with good cell health.
In separate experiments, we obtained five calibration points, at pH values of 5.8, 6.4, 7.0, 7.6 and 8.5, for the WT and the AE3−/− cells, using the high‐K+ nigericin technique (Thomas et al. 1979). We used the calibration points to generate four unique calibration curves for (1) WT HC neurons, (2) WT HC astrocytes, (3) AE3−/− HC neurons, and (4) AE3−/− HC astrocytes following the approach of Boyarsky et al. (1988). To calibrate the dye in our physiological experiments, we obtained a single‐point calibration at pH 7.00 at the end of each experiment, and then calculated pHi values from the above calibration curves.
Thermodynamic analysis of acid–base transporters
Here we provide our approach for calculating the [HCO3 –]i and the pHi at which each of several transporters – as relevant for the Discussion – would reverse, given particular extracellular and intracellular concentrations.
Na+‐driven Cl−–HCO3 − exchanger (NDCBE)
We define the electrochemical potential energy difference for NDCBE (see Parker & Boron, 2013), operating as an acid extruder (i.e. apparent HCO3 – influx), as
where R is the universal gas constant and T the temperature in kelvins. The intracellular HCO3 – concentration at which NDCBE would reverse in HC neurons:
Finally, assuming CO2 is equilibrated across the cell membrane (i.e. [CO2]i = [CO2]o) and that the pK values are the same inside and outside the cell, we compute (see Bevensee & Boron, 2013) the pHi at which the transporter (i.e. NDCBE or any of the others below) would reverse as
If the actual pHi exceeds (pHi)rev, the transporter (e.g. NDCBE) must cease to behave as an acid extruder; if it operates at all, it will function as an acid loader.
The electrogenic Na+/HCO3 − cotransporter
NBCe1 is expressed both in hippocampal neurons (Svichar et al. 2011) and astrocytes (Bevensee et al. 1997 a). We define the electrochemical potential energy difference for NBCe1, operating as an acid extruder (i.e. apparent HCO3 – influx), as
where F is the Faraday constant and V m is the membrane potential. The intracellular HCO3 – concentration at which NBCe1 would reverse is
For neurons, we assume a V m of −60 mV (Magistretti & Ransom, 2002; Khirug et al. 2005). For astrocytes we assume a V m of −85 mV (McKhann et al. 1997; Magistretti & Ransom, 2002).
The electroneutral Na+/HCO3 − cotransporter (NBCn1) and the Na+–H+ exchanger (NHE)
We define the electrochemical potential energy differences for NBCn1 and NHE, operating as acid extruders (i.e. apparent HCO3 – influx or H+ efflux), as
We compute ([HCO3 –]i)rev as
The anion exchanger AE3
We define the electrochemical potential energy difference for AE3, operating as an acid extruder (i.e. apparent HCO3 – influx), as
and calculate ([HCO3 –]i)rev as
After calculating (HCO3 –)rev for NBCe1, NBCn1, NHE, or AE3, we compute (pHi)rev as outlined for NDCBE.
Data analysis and statistics
Selection of areas of interest
For each cell analysed, we selected an area of interest (AOI) by using the outline tool in Slidebook to encompass the cell body. We avoided soma that obviously overlapped, although thin astrocytic processes were likely beneath many neurons. For astrocytes, we choose AOIs that contained no obvious neuronal processes, although tiny neuronal processes may have overlain some astrocyte AOIs.
Calculation of pHi
Within each AOI, Slidebook: (1) calculates the mean pixel intensity with a 490 nm excitation; (2) from this mean, subtracts the background (obtained in a region with no cells) to obtain the background‐subtracted 490 nm signal (I 490); and (3) divides this last value by the background‐subtracted 440 nm signal (I 440). We then convert the fluorescence excitation ratios (I 490/I 440) to pHi values using the high‐K+/nigericin technique (Thomas et al. 1979), using a single‐point calibration (Boyarsky et al. 1988).
Final pHi in an experimental period
We compute the final pHi of a particular period as described by Salameh et al. (2014). Briefly, we used a least‐squares method to fit a straight line to the pHi data corresponding to the last minute of the period in question, just before a solution change. Into the equation of best fit, we insert the time corresponding to the last point before the solution change. The resulting pHi value represents the best‐fit final pHi.
Exponential rate constant of pHi recovery
To obtain an exponential rate constant (k) for a pHi recovery from an alkali load, a MAc exposure, or an acid load, we fitted the time course of pHi – starting from the first data point during which pHi begins its most rapid ascent/descent – to the single‐exponential decay function pHi = ae− kt + (pHi)∞. We abandoned attempts to fit the data to a double‐exponential decay function because, for any given fitting attempt, at least one coefficient had a value within one standard deviation of zero.
Linear rate of pHi change
To obtain the early rate of pHi decrease with respect to time, we used the least‐squares regression method to fit a straight line to the pHi data. To compute (dpHi/dt)early in MAc experiments, we started from the first data point at which pHi begins its most rapid descent, and extended the fit forwards in time until the slope inexorably became less negative. This fit typically encompassed ∼70 s. The best‐fit slope represents (dpHi/dt)early.
To obtain the rate of pHi decrease near the end of a MAc period, that is, (dpHi/dt)late, we similarly fitted a line to the pHi data starting at 420 s into the MAc period (i.e. the end of the MAc), and extended the fit backwards in time until just before the slope inexorably rises (reflecting contamination for rapid, early pHi descent). This fit typically encompassed ∼3 min.
To obtain the maximal rate of pHi increase as we transitioned from MAc to control (Ctrl) – that is, (dpHi/dt)final – we followed an approach analogous to that for (dpHi/dt)early, except that we extended the fit forwards in time until the slope inexorably became less positive (i.e. ∼70 s).
To obtain a change in pHi, during Cl– removal – that is, (dpHi/dt)Cl removal – we fitted a line to the pHi data starting from the first data point during which pHi begins its most rapid ascent, then extended the fit forwards in time until the slope inexorably declines (reflecting stabilization of pHi). This fit typically encompassed ∼2 min.
Statistical analysis
To assess statistical significance between data from WT and AE3−/− cells in the scatter plots in the main panels in the figures, we applied the multivariate ANOVA test, considering P < 0.05 as statistically significant. To examine statistical significance between data from WT and AE3−/− cells summarized in bar graphs, we compared means using an unpaired two‐tailed Student's t test, considering P < 0.05 as statistically significant. To compare the means for multiple data sets, we used a one‐way ANOVA with Tukey's pairwise comparison, considering P < 0.05 as statistically significant. We report the data as mean ± SEM.
Analytical software
For exponential and linear curve fitting, we used Origin 2015. For the statistical tests, we used Minitab 17 statistical software.
Results
The presence of neuronal AE3 increases net acid‐loading rate not only in hippocampal CA1 neurons but also in astrocytes
Acute intracellular alkali load via CO2 efflux for WT and AE3−/− cells
Our first goal was to determine the contribution of AE3 to intracellular acid loading in neurons, which we did by acutely alkali loading the cells and monitoring the subsequent pHi recovery (i.e. decrease). Figure 1 A shows two pairs of images, each pair representing a different experiment (presented below), and comprising a differential interference contrast (DIC) image and a fluorescence image of the same field. The pair on the left comes from a WT mixed culture, whereas that on the right comes from an AE3−/− mixed culture. The traces around the bodies of neurons and astrocytes show the areas of interest used in the pHi analyses. Although not shown in the experimental records, we began experiments by recording pHi while flowing HBS (Table 1, solution 1, 37°C) over a mixed culture of HC neurons and astrocytes, obtained from either WT or AE3−/− mice. After 5 min, we switched to 10% CO2/44 mm HCO3 – (solution 2). This manoeuvre caused a rapid decrease in pHi, due to the CO2 influx, followed by a slower pHi recovery (i.e. increase), due to acid extrusion. Finally, after 10 min of this pretreatment, we switched to 5% CO2/22 mm HCO3 – (Ctrl, solution 3), as schematized in a model of a neuron in Fig. 1 B (step 1). This sudden decrease in [CO2]o leads to a rapid efflux of CO2 (step 2), which decreases [CO2]i, and shifts the intracellular CO2/HCO3 – equilibrium to consume H+ (step 3). The result is a robust pHi increase in both a WT and an AE3−/− neuron (segment ab in Fig. 1 C) and in both a WT and an AE3−/− astrocyte (segment ab in Fig. 1 D). The middle portions of Fig. 1 C and D show that – not just for neurons but also for astrocytes – the ΔpHi during segment ab is significantly greater for cells from AE3−/− than for WT mice. For this and the following figures, we present the details on the numbers of cells, cultures and coverslips in the figure legend.
Figure 1. Recovery of pHi from an acute alkali load in hippocampal neurons and astrocytes in mixed culture.

A, two representative image pairs for WT (left pair) and AE3−/− (right pair) mixed cultures. Each white outline surrounds a portion of the soma of a neuron or an astrocyte and encompasses an area of interest that led to the data in C and D. B, schematic model describing the anticipated acid–base‐related events in a neuron in response to switching the extracellular solution from 10% CO2/44 mm HCO3 −/pH 7.40 (solution 2 in Table 1) to 5% CO2/22 mm HCO3 −/pH 7.40 (solution 3). The resulting CO2 efflux produces an alkali load, followed by a slower pHi recovery. The white numerals on black squares describe the postulated sequence of events. C, examples of pHi responses in two HC neurons, WT (black) and AE3−/− (red). The black record comes from the identified neuron in the left portion of A, whereas the red record comes from the identified neuron in the right portion of A. In the upper portion of panel C, the squares on the black trace and the circles on the red trace represent some of the points at which we calculated dpHi/dt from exponential curve fits. The middle portion summarizes ∆pHi between the steady‐state pHi just before switching from 10% to 5% CO2 (point a) and the peak pHi (point b) just before the recovery of pHi from alkalosis for 39 individual WT neurons (black squares; from 5 cultures on 11 coverslips) and 37 individual AE3−/− neurons (red circles; from 3 cultures on 7 coverslips). The lower portion shows plots of dpHi/dt and pHi for the WT and AE3−/− neurons in the main portion of the panel. The slopes of the lines (not shown) through each set of points represent the exponential rate constant k down – computed as described in Methods – whereas the x‐intercepts represent the hypothetical pHi at infinite time, (pHi)∞. Supplementary Fig. S1 in the online supporting material includes plots of dpHi/dt and pHi for all neurons in this part of the study. D, examples of pHi responses in two HC astrocytes, WT (grey) and AE3−/− (pink). The grey record comes from the identified astrocyte in the left portion of panel A, whereas the pink record comes from the identified astrocyte in the right portion of panel A. The middle and lower portions are comparable to those in C, but for 29 individual WT astrocytes (grey diamonds; from 5 cultures on 11 coverslips) and 20 individual AE3−/− astrocytes (pink triangles; from 3 cultures on 7 coverslips). Supplementary Fig. S2 includes plots of dpHi/dt and pHi for all astrocytes in this part of the study. E, relationship between k down and (pHi)∞ for 39 individual WT neurons (black squares) and 37 individual AE3−/− neurons (red circles). The two arrows identify the neurons in the upper portion of D. The inset shows mean k down values, computed over all (pHi)∞ values. The vertical dashed lines represent the calculated reversal pHi values for the transporters NDCBE and NBCe1, as described in Table 3. F, relationship between k down and (pHi)∞ for 29 individual WT astrocytes (grey diamonds) and 20 individual AE3−/− astrocytes (pink triangles). The two arrows identify the astrocytes in the upper portion of panel D. The inset is comparable to that in E. For the two upper insets in C and D, and for the insets in E and F (i.e. bar graphs), we performed two‐tailed unpaired t tests between WT and AE3−/− cells. For the main portions of E and F (i.e. scatter plots), we performed multivariate ANOVA between WT and AE3−/− cells. WTN, neuron(s) cultured from a wild‐type mouse; AE3N −/−, neuron(s) cultured from an AE3–/– mouse; WTA, astrocyte(s) cultured from a wild‐type mouse; AE3A −/−, astrocyte(s) cultured from an AE3–/– mouse; NS, no significant difference.
We expect the segment ab rise in pHi to inhibit the acid extruders (decreasing J E; step 4a) and to stimulate the acid loaders (increasing J L; step 4b). In neurons, the acid loaders would include AE3, whereas in astrocytes, they presumably would include the reversed electrogenic Na+/HCO3 − cotransporter NBCe1 (Boron & Boulpaep, 1983; Romero et al. 1997; Theparambil et al. 2015). These changes in transport rates shift the J E–J L balance in favour of acid loading, and lead to a gradual decrease in pHi (Fig. 1 B, step 5ab), as shown by segments bc in Fig. 1 C and D. For each cell, we fitted the single‐exponential decay function pHi = ae− kt + (pHi)∞ to the time course of pHi recovery from alkalosis, thereby obtaining the rate constant (k down) and (pHi)∞, the latter of which is an estimate of the asymptote for pHi. For the neuron data in Fig. 1 C, the squares overlying the black trace (WT) and the circles on the red trace (AE3−/−) represent some of the points at which we calculated dpHi/dt from exponential curve fits. The lower portion of Fig. 1 C shows the linear pHi dependence of the dpHi/dt values that we computed at each identified point for the WT neuron (shades of black) and the AE3−/− neuron (shades of red). The slopes of the lines represent the best‐fit k down values. Compared to that for the WT neuron, the plot of dpHi/dt and pHi for the AE3−/− neuron is shifted toward higher pHi values and has a smaller slope. If the intracellular buffering powers are the same in the two neurons, these data indicate that, as we might have anticipated, AE3 makes a substantial contribution to the recovery of pHi from an alkaline load. Acid‐loading mechanisms other than AE3 must be responsible for the residual segment‐bc pHi recovery in the red record of Fig. 1 C. As we will see in the Discussion, reversal of acid extruders such as NDCBE and NBCe1 could in principle contribute to this residual pHi recovery.
The lower portion of Fig. 1 D shows the comparable plots of the computed dpHi/dt and pHi for the WT astrocyte (shades of grey) and the AE3−/− astrocyte (shades of pink). If the intracellular buffering powers are the same in the two astrocytes, these data indicate that – quite unexpectedly, inasmuch as AE3 is not present in astrocytes – the presence of AE3 in neurons somehow contributes to the recovery of pHi from an alkaline load in astrocytes.
Comparison of rate constants for pHi recovery from alkali loads (k down) for WT and AE3−/− cells
In analysing the best‐fit parameters for these data, we plot the relationship between (pHi)∞ and k down for a total of 39 WT and 37 AE3−/− neurons in Fig. 1 E. Compared to those for the WT neurons, the ((pHi)∞, k down) ordered pairs for the AE3−/− neurons tend to be shifted toward higher (pHi)∞ values and have lower k down values, consistent with a decreased ability of the AE3‐deficient neurons to recover from an acute alkaline load. Multivariate ANOVA reveals that the relation between (pHi)∞ and k down is significantly different (P < 0.001) for WT and AE3−/− neurons. The inset shows that the difference between the mean k down values computed over all (pHi)∞ values for WT vs. AE3−/− is borderline significant (P = 0.06). In summary, the right shift and overall lower k down values of AE3–/– neurons point to an inhibition of acid loading.
Figure 1 F summarizes the relationship between (pHi)∞ and k down for 29 WT and 20 AE3−/− astrocytes. Compared to those for the WT astrocytes, the ((pHi)∞, k down) ordered pairs for the AE3−/− astrocytes tend to be shifted toward higher (pHi)∞ values, consistent with a decreased ability of the AE3‐deficient astrocytes to recover from an acute alkaline load. Multivariate ANOVA reveals that the relationship between (pHi)∞ and k down is significantly different (P = 0.007) for WT vs. AE3−/− astrocytes. As shown in the inset, an unpaired two‐tailed t test reveals a significant difference between the mean k down values of WT vs. AE3−/−.
The presence of neuronal AE3 speeds the initial MAc‐induced acidification in both neurons and astrocytes
pHi trajectories in WT neurons and astrocytes during MAc
Our second goal was to investigate the role of AE3 in the pHi response of neurons and astrocytes to MAc. We compared mixed cultures from WT and AE3−/− mice, beginning our experiments – as in the preceding section of the paper – by flowing HBS (solution 1) for 5 min. However, for the experiments in Fig. 2 and the remaining protocols, we switched directly to 5% CO2/22 mm HCO3 – (solution 3) for 10 min and allowed pHi to stabilize. Finally, we challenged our cells with MAc (solution 4) for 7 min (Fig. 2 A; step 1). We expected that the imposition of MAc – with the simultaneous decreases in [HCO3 –]o, [CO3 2−]o, and pHo – would inhibit the acid extruders (step 2a) but stimulate the acid loaders (step 2b). These alterations ought to shift the acid–base dynamics so that J E < J L, and pHi falls (steps 3ab). We did indeed observe a near‐immediate pHi descent for both WT neurons (segment ab, black record in left panel of Fig. 2 B) and WT astrocytes (grey record in Fig. 2 C). For both the WT neuron and the WT astrocyte, pHi soon reached a near‐stable value. This presumably occurs because the gradual decrease in pHi during segments ab secondarily stimulates the acid extruders (step 4a) but inhibits the acid loaders (step 4b), actions that counteract both the initial decrease in J E (step 5a) and the initial increase in J L (step 5b), and thereby bring J E and J L into balance (step 6), albeit at a pHi lower than the control value.
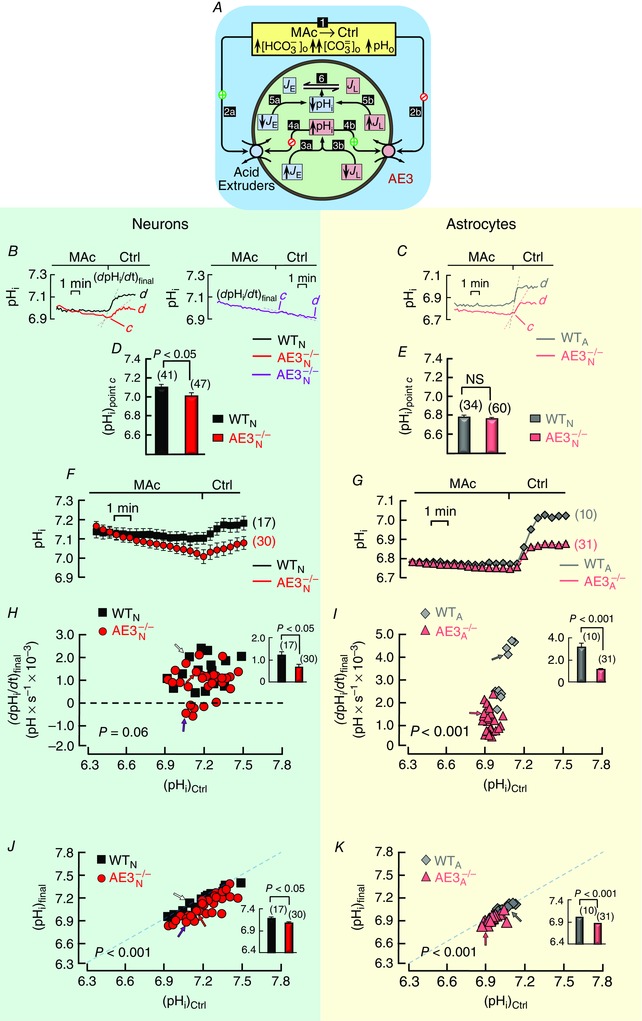
Figure 2. Responses of pHi to MAc exposure in hippocampal neurons and astrocytes in mixed culture.

A, schematic model describing the anticipated acid–base‐related events in a neuron in response to switching the extracellular solution from 5% CO2/22 mm HCO3 −/pH 7.40 (solution 3) to 5% CO2/14 mm HCO3 −/pH 7.20 (solution 4). The white numerals in black squares described the postulated sequence of events. B, examples of pHi responses in HC neurons. The left panel shows records from a WT neuron (black) and one extreme of pHi trajectories for AE3−/− neurons (red). The steeper pair of dashed lines represent the maximal initial rates of pHi decline ((dpHi/dt)early) and the shallower pair of dashed lines represent the rates of pHi decline late during MAc ((dpHi/dt)late) when pHi was declining linearly. In Methods, we describe the linear‐fitting procedure. The right panel shows the other extreme of pHi trajectories for AE3−/− neurons. C, examples of pHi responses in HC astrocytes. These records from a WT (grey) and AE3−/− (pink) astrocyte are comparable to those in B. D, mean control (i.e. starting) pHi values ((pHi)Ctrl) for 41 WT neurons (black bar; from 6 cultures, 11 coverslips) and 47 AE3−/− neurons (red bar; from 8 cultures, 11 coverslips), just before MAc exposure, computed as described in Methods. E, mean control pHi values for 34 WT astrocytes (grey bars; from 4 cultures, 7 coverslips) and 60 AE3−/− astrocytes (pink bars; from 5 cultures, 7 coverslips), just before MAc exposure. F, summary of pHi responses to MAc in HC neurons. The panel shows mean responses of 41 WT neurons (black squares) and 47 AE3−/− neurons (red circles) to extracellular MAc. G, summary of pHi responses to MAc in HC astrocytes. The panel shows mean responses of 34 WT astrocytes (grey diamonds) and 60 AE3−/− astrocytes (pink triangles) to extracellular MAc. H, relationship between (dpHi/dt)early and (pHi)Ctrl for 41 individual WT neurons (black squares) and 47 individual AE3−/− neurons (red circles). The arrows identify the neurons in panel B. The inset shows mean (dpHi/dt)early values, computed over all (pHi)Ctrl values. I, relationship between (dpHi/dt)early and (pHi)Ctrl for 34 individual WT astrocytes (grey diamonds) and 60 individual AE3−/− astrocytes (pink triangles). The arrows identify the astrocytes in panel C. The inset is comparable to that in panel H. Supplementary Fig. S3 includes an alternative analysis, plots of the exponential rate constant k down vs. (pHi)Ctrl for WT neurons, WT astrocytes and AE3−/− astrocytes in this part of the study. J, relationship between (dpHi/dt)late and (pHi)Ctrl for 41 individual WT neurons (black squares) and 47 individual AE3−/− neurons (red circles). The inset is comparable to that in panel H, but for (dpHi/dt)late. K, relationship between (dpHi/dt)late and (pHi)Ctrl for 34 individual WT astrocytes (grey diamond) and 60 individual AE3−/− astrocytes (pink triangles). The inset is comparable to that in J. For the bar graphs in panels D and E and in the insets to F, H, G and I, we performed two‐tailed unpaired t tests between WT and AE3−/− cells. For the main portions of F, H, G and I (i.e. scatter plots), we performed multivariate ANOVA between WT and AE3−/− cells.
pHi trajectories in AE3−/− neurons and astrocytes during MAc
In the AE3−/− neurons, the pHi trajectories during MAc can have one of two extreme patterns, or a blend of these patterns. One extreme is exemplified by the red record (left panel of Fig. 2 B), which is similar to the black record for the WT neuron, except that the initial pHi descent for the red AE3−/− record is slower and pHi continues to fall even late during the 7 min MAc period. An example of the other extreme is the purple record (right panel of Fig. 2 B). Here, during the early phase of MAc, pHi descends considerably more slowly than for either the black or red records, but continues to descend with a trajectory that is more linear. A hallmark of AE3−/− neurons – whether they follow the red or purple trajectory, or something intermediate – is a tendency for pHi to drift downward during segment bc at a considerably greater rate than for WT neurons.
In AE3−/− astrocytes, the pHi trajectories – an example of which is in Fig. 2 C – are more similar to those of their WT counterparts than is the case for the WT and AE3−/− neurons. However, as is the case for AE3−/− neurons, in AE3−/− astrocytes, pHi continues to drift downward at a relatively high rate during segment bc.
Mean values of control pHi
While in the Ctrl solution, the WT and AE3−/− neurons have initial pHi values, (pHi)Ctrl, that are indistinguishable (Fig. 2 D). These neuron data agree with the earlier work of Hentschke et al. on WT and AE3−/− neurons (Hentschke et al. 2006). Unexpectedly, we find that the initial pHi values in WT astrocytes are significantly higher than in AE3−/− astrocytes (Fig. 2 E).
Summary of pHi responses in neurons and astrocytes to MAc exposure
Figure 2 F summarizes the pHi trajectories in response to MAc for 41 WT (black) and 47 AE3−/− (red) neurons, three of which are shown in Fig. 2 B. Similarly, Fig. 2 G summarizes the pHi trajectories in response to MAc for 34 WT (grey) and 60 AE3−/− (pink) astrocytes, two of which are shown in Fig. 2 C.
Comparison of rates of pHi descent early in MAc for WT and AE3−/− neurons
To obtain the initial rate of pHi descent, we fitted a line to the steepest portion of the pHi time course during MAc. The slope of the line is (dpHi/dt)early. In Fig. 2 H we plot the relationship between (dpHi/dt)early and the pHi prevailing under Ctrl conditions (i.e. (pHi)Ctrl) – just before we switched to the MAc solution – for 41 individual WT (Fig. 2 H black) and 47 AE3−/− (Fig. 2 H red) neurons. Our motivation for plotting (dpHi/dt)early vs. (pHi)Ctrl rather than vs. (pHi)∞ was threefold. First, (pHi)Ctrl is more akin to (pHi)∞ in Fig. 1 E and F, where that asymptotic pHi refers to control conditions. Second, in their work on freshly dissociated rat HC neurons, Bevensee et al. plotted the rate constant of the pHi recovery from an acid load (k up; discussed later in the present paper) and the initial pHi, as can be seen in their Fig. 2 C (Bevensee et al. 1996). And third, it was this Bevensee paper that first reported the surprising observation that k up rises steeply as (pHi)Ctrl rises in neurons.
Compared to those for the WT neurons, the ordered pairs ((pHi)Ctrl, (dpHi/dt)early) for the AE3−/− neurons tend to have the same (pHi)Ctrl range but less negative (dpHi/dt)early values (Fig. 2 H), consistent with a decreased ability of the AE3‐deficient neurons to acidify during MAc exposure. Multivariate ANOVA reveals that the relation between (pHi)Ctrl and (dpHi/dt)early is significantly different (P < 0.001) for WT and AE3−/− neurons.
The inset in Fig. 2 H shows that, early in the MAc exposure, the mean (dpHi/dt)early of AE3−/− neurons (e.g. Fig. 2 B, dashed red and purple lines) is significantly less negative than that of WT neurons (e.g. Fig. 2 B, dashed black line). Thus, AE3 is essential for the robust intracellular acidification of neurons during the early phase of MAc.
Comparison of rates of pHi descent early in MAc, for WT and AE3−/− astrocytes
Figure 2 I shows that the ordered pairs ((pHi)Ctrl, (dpHi/dt)early) for the AE3−/− astrocytes, compared to those of WT astrocytes, tend to have a somewhat lower (pHi)Ctrl range and decidedly less negative (dpHi/dt)early values, consistent with a decreased ability of the AE3−/− astrocytes to acidify during MAc exposure. Multivariate ANOVA reveals that the relation between (dpHi/dt)early and (pHi)Ctrl is significantly different (P < 0.001) for WT vs. AE3−/− astrocytes. The inset in Fig. 2 I shows that (dpHi/dt)early, computed over all (pHi)Ctrl values, is less negative in AE3−/− (i.e. Fig. 2 C, dashed pink line) than in WT astrocytes (i.e. Fig. 2 C, dashed grey line). Thus, unexpectedly, neuronal AE3 is also essential for the robust intracellular acidification of astrocytes during the early phase of MAc.
Comparison of rates of pHi descent late in MAc, for WT and AE3−/− neurons
For this analysis, we obtain a linear fit of the pHi time course late in segment bc, the slope of the line of best fit being (dpHi/dt)late. In Fig. 2 J we plot the relationship between (dpHi/dt)late and (pHi)Ctrl for WT and AE3−/− neurons. The figure reveals a substantial downward shift for AE3−/− neurons, which indicates a faster late pHi descent. The multivariate ANOVA indicates a significant difference (P < 0.001) between WT and AE3−/−, and the inset shows that the mean (dpHi/dt)late of AE3−/− neurons, computed over all (pHi)Ctrl values, is substantially more negative than that of WT neurons.
Comparison of rates of pHi descent late in MAc, for WT and AE3−/− astrocytes
In Fig. 2 K we plot (dpHi/dt)late vs. (pHi)Ctrl for WT and AE3−/− astrocytes. As was the case for AE3−/− neurons in Fig. 2 J, Fig. 2 K reveals a significant downward shift for AE3−/− astrocytes, and thus a more negative (dpHi/dt)late. The multivariate ANOVA reveals that the (dpHi/dt)late–(pHi)Ctrl relationship is significantly different (P < 0.001) between WT and AE3−/− astrocytes, and the inset shows that (dpHi/dt)late, computed over all (pHi)Ctrl values, is much more negative in AE3−/− than in WT astrocytes.
Figure 2 J and K show that, neither in AE3−/− neurons nor AE3−/− astrocytes, does the combination of the expected rise in J E (Fig. 2 A; step 4a) or the expected fall in J L (step 4b) proceed sufficiently to bring J E and J L into balance during the 7 min period of MAc.
Taken together, the results summarized in Fig. 2 suggest that, during MAc, AE3 has two effects in neurons: during the first ∼1 min, AE3 accentuates J L over J E (making pHi fall more rapidly), whereas during the last few minutes, AE3 accentuates J E over J L (braking the fall in pHi). Figure 2 also shows that AE3 produces similar net effects in astrocytes, even though astrocytes do not express AE3.
The presence of AE3 paradoxically increases the rate of pHi recovery during the switch from MAc to Ctrl in both neurons and astrocytes
pHi trajectories in WT neurons and astrocytes during MAc removal
Our next goal was to investigate the role of AE3 in the recovery of pHi during the transition from MAc back to Ctrl. Here, we expect that the removal of MAc (Fig. 3 A; step 1) – with the simultaneous increase in [HCO3 –]o, [CO3 2−]o and pHo – will stimulate acid extruders (step 2a) but inhibit the acid loaders (step 2b). These alterations ought to shift the acid–base dynamics so that J E > J L (steps 3ab), and cause pHi to rise, as we indeed observe in WT neurons and (segments cd, black record in left panel of Fig. 3 B) as well as in WT astrocytes (pink record in Fig. 3 C). However, for both WT neurons and WT astrocytes, pHi eventually stabilizes. This presumably occurs because the gradual increase in pHi during segment cd secondarily inhibits acid extrusion (step 4a) but stimulates acid loading (step 4b), actions that raise J L (step 5a) but lower J E (step 5b), and thereby bring J E and J L into balance (step 6), and cause pHi to stabilize, albeit at a higher pHi at point d than at point c. Note that the black record in Fig. 3 B is from the same neuron as in Fig. 2 B, and that the grey record in Fig. 3 C is from the same astrocyte as in Fig. 2 C.
Figure 3. Recovery of pHi from MAc exposure in hippocampal neurons and astrocytes in mixed culture.
A, schematic model describing the anticipated acid–base‐related events in a neuron in response to switching the extracellular solution from MAc (solution 4) back to 5% CO2/22 mm HCO3 −/pH 7.40 (solution 3). The white numerals in black squares describe the postulated sequence of events. B, examples of pHi responses in HC neurons. The left panel shows records from a WT neuron (black) and one extreme of pHi trajectories for AE3−/− neurons (red). The dashed lines represent the maximal initial rates of pHi ascent ((dpHi/dt)final). In Methods, we describe the linear‐fitting procedure. The right panel shows the other extreme of pHi trajectories for AE3−/− neurons. The three neurons here are the same as the three in Fig. 2 B. C, examples of pHi responses in HC astrocytes. These records from a WT (grey) and AE3−/− (pink) astrocyte are comparable to those in panel B. The two astrocytes here are the same as the two in Fig. 2 C. D, mean pHi values for 41 WT neurons (black bar) and 47 AE3−/− neurons (red bar), just before MAc removal (point c in B), computed as described in Methods. The 41 and 47 neurons here are the same as those in Fig. 2 D. E, mean pHi values for 34 WT astrocytes (grey bar) and 60 AE3−/− astrocytes (pink bar), just before MAc removal (point c in C). The 34 and 60 astrocytes here are the same as those in Fig. 2 E. F, summary of pHi responses to MAc removal in HC neurons. The panel shows the mean responses of 17 WT neurons (black squares; from 6 cultures, 11 coverslips) and 30 AE3−/− neurons (red circles; from 8 cultures, 11 coverslips) to MAc removal. These 17 WT and 30 AE3–/– neurons represent a subset of the 41 WT and 47 AE3–/– neurons described in Fig. 2 F (we used other neurons in other protocols). G, summary of pHi responses to MAc removal in HC astrocytes. The panel shows the mean responses of 10 WT astrocytes (grey squares; from 1 culture; 3 coverslips) and 31 AE3−/− astrocytes (pink circles; from 3 cultures; 3 coverslips) to MAc removal. These 10 WT and 31 AE3–/– astrocytes represent a subset of the 34 WT and 60 AE3–/– astrocytes described in Fig. 2 G. H, relationship between (dpHi/dt)final – computed as described in Methods – and (pHi)Ctrl for 17 WT individual neurons (black squares) and 30 individual AE3−/− neurons (red circles). The arrows identify the neurons in B. The inset shows mean (dpHi/dt)final values, computed over all (pHi)Ctrl values. I, relationship between (dpHi/dt)final and (pHi)Ctrl for 10 individual WT astrocytes (grey diamonds) and 31 individual AE3−/− astrocytes (pink triangles). The arrows identify the astrocytes in C. The inset is comparable to that in H. Supplementary Fig. S4 includes an alternative analysis, plots of the exponential rate constant k up vs. (pHi)Ctrl for WT neurons, WT astrocytes and AE3−/− astrocytes in this part of the study. J, relationship between the final pHi ((pHi)final) after the recovery from MAc (point d in B) and (pHi)Ctrl for 17 individual WT neurons (black squares) and 30 individual AE3−/− neurons (red circles). The inset shows mean (pHi)final values, computed over all (pHi)Ctrl values. K, relationship between the final pHi after the recovery from MAc (point d in panel C) and (pHi)Ctrl for 10 individual WT astrocytes (grey diamond) and 31 individual AE3−/− astrocytes (pink triangles). The inset is comparable to that in panel J. For the bar graphs in D and E and in the insets to H, I, J and K (i.e. bar graphs), we performed two‐tailed unpaired t tests between WT and AE3−/− cells. For the main portions of H, I, J, and K (i.e. scatter plots), we performed multivariate ANOVA between WT and AE3−/− cells.
pHi trajectories in AE3−/− neurons and astrocytes during MAc removal
In the AE3−/− neurons, the pHi trajectories during MAc removal can have one of two extreme patterns, or a blend. At one extreme is the red record in the left panel of Fig. 3 B. This trajectory is similar to the black record for the WT neuron, except that the segment‐cd pHi increase for the red AE3−/− record is slower. An example of the other extreme is the purple record in the right panel of Fig. 3 B. Here, during MAc removal, pHi continues to descend with a quasi‐linear trajectory that indicates that J E remains lower than J L.
In AE3−/− astrocytes, the pHi trajectories – an example of which is in Fig. 3 C – are more similar to those of their WT counterparts than is the case for the WT and AE3−/− neurons. Note that the red and purple records in Fig. 3 B are from the same neurons as in Fig. 2 B, and that the pink record in Fig. 3 C is from the same astrocyte as in Fig. 2 C.
Summary of pHi responses in neurons and astrocytes to MAc removal
Figure 3 F summarizes the pHi trajectories in response to MAc removal for 17 WT (black) and all 30 AE3−/− (red) neurons. Figure 3 G summarizes the pHi trajectories in response to MAc removal for 10 WT (grey) and 31 AE3−/− (pink) astrocytes.
Comparison of rates of pHi ascent after MAc removal for WT and AE3−/− cells
We obtain rates of pHi increase during MAc removal (( dpHi/dt)final) by fitting a line to the time course of pHi. Figure 3 H reveals that the differences between ((pHi)Ctrl, (dpHi/dt)final) ordered pairs for WT vs. AE3−/− neurons are borderline significant. Moreover, the inset in Fig. 3 H, which summarizes the mean (dpHi/dt)final, computed over all (pHi)Ctrl values, reveals a significant difference between WT and AE3−/− neurons. On balance, we conclude that (dpHi/dt)final is larger for WT than for AE3−/− neurons, a pattern that is paradoxical because AE3 is an acid loader. Figure 3 I summarizes comparable but even more striking data for astrocytes. Our conclusion that the knockout of AE3 reduces acid extrusion is doubly surprising because AE3 is not only an acid loader, but absent from WT astrocytes.
Comparison of starting pHi and final pHi for WT and AE3−/− cells
In order to investigate the role of AE3 in re‐establishing pHi values after a cycle of MAc exposure and removal, we now plot the relationship between (pHi)Ctrl and (pHi)final. Figure 3 J reveals that the points defining the relationship between the initial (i.e. Ctrl) and final pHi values for WT neurons (black squares) lie along the line of identity; that is, WT neurons tend to return to their initial pHi. For AE3−/− neurons (red circles), the relationship remains linear but is shifted downward; that is, AE3−/− neurons tend to return to a pHi value less than the initial one. Multivariate ANOVA reveals a significant difference between WT and AE3−/−.
According to the fundamental law of pHi regulation (Roos & Boron, 1981), pHi is in a steady state when J E = J L. For WT neurons, the pHi at which J E and J L come into balance is about the same before and after MAc. The simplest explanation for this behaviour, although by no means the only one, is that the profiles of J E vs. pHi and J L vs. pHi under control conditions are not altered by an intervening period of MAc. However, for AE3−/− neurons, the intervening period of MAc must shift at least one of these profiles, such that J E reaches a balance with J L at a lower pHi value. The inset in Fig. 3 J shows a significant difference between WT and AE3−/− neurons in mean (pHi)final, computed over all (pHi)Ctrl values.
Figure 3 K is like Fig. 3 J, but for WT and AE3−/− astrocytes. Again, the WT cells tend to fall along the line of identity, whereas the AE3−/− cells fall below it. Multivariate ANOVA reveals a significant difference between WT and AE3−/− astrocytes (P < 0.001), and the inset shows significant differences between WT and AE3−/− in mean (pHi)final, computed over all (pHi)Ctrl values.
The presence of AE3 increases the net acid‐extrusion rate in neurons but not astrocytes under MAc conditions
NH4 + prepulse protocol under MAc conditions
Because AE3−/− neurons and, to a lesser extent, astrocytes tend to acidify during the plateau phase of MAc (segments bc in Fig. 2 B and C), we next ask whether the absence of AE3 hinders net acid extrusion during MAc. To achieve this goal, we compare mixed cultures from WT and AE3−/− mice, beginning our experiments as in Fig. 2 by superfusing the cells with HBS (solution 1; not shown) for 5 min, followed by Ctrl (solution 3; not shown) for 10 min, and then a transition to MAc (solution 4) for ∼2 min, the last portion of which we show in Fig. 4 A and B. We then acid load the cells under MAc conditions, utilizing the ammonium pre‐pulse technique (Boron & De Weer, 1976). The 2.5 min exposure to 20 mm NH3/NH4 + (solution 5) causes a rapid increase in pHi (segment ab) due to the rapid influx of NH3, followed by a slower decrease (segment bc) generated by the influx of NH4 + and other acid‐loading processes. The subsequent removal of the NH3/NH4 + (i.e. return to MAc; solution 4) produces a sharp decrease in pHi (segment cd) due to the efflux of NH3 as opposed by acid‐extruding processes, followed by a gradual increase (segment de) mediated by acid‐extruding processes as opposed somewhat by acid‐loading processes. For each cell, we fitted the single‐exponential decay function to the segment‐de pHi recovery from acidosis (i.e. cells under MAc conditions).
Figure 4. Recovery of pHi from an acute acid load in hippocampal neurons and astrocytes in mixed culture.

A, examples of pHi responses in two HC neurons; WT (blue) and AE3−/− (brown) under conditions of MAc. At the indicated times, we switched the extracellular solution from 5% CO2/14 mm HCO3 −/pH 7.20 (solution 4 in Table 1) to 5% CO2/14 mm HCO3 −/20 mm NH3/NH4 +/pH 7.20 (solution 5), and then back again (solution 4). The NH3/NH4 + washout produces an acid load, followed by a slower pHi recovery. The squares on the blue trace and the circles on the brown trace represent some of the points at which we calculated dpHi/dt from exponential curve fits. The inset shows plots of dpHi/dt vs. pHi for the WT and AE3−/− neurons in the main panel. Supplementary Fig. S5 includes plots of dpHi/dt and pHi for all neurons in this part of the study. The slopes of the lines (not shown) through each set of points represent the exponential rate constant k up, computed as described in Methods. B, examples of pHi responses in two HC astrocytes; WT (light blue) and AE3−/− (orange), to an acute acid load imposed via a NH3/NH4 + prepulse under MAc conditions. The right inset is comparable to that in panel A. Supplementary Fig. S6 includes plots of dpHi/dt and pHi for all astrocytes in this part of the study. C, relationship between k up and (pHi)Ctrl for 26 individual WT neurons (blue squares; from 3 cultures, 6 coverslips) and 25 individual AE3−/− neurons (brown circles; from 3 cultures, 5 coverslips) under MAc conditions. The arrows identify the neurons in panel A. The inset shows mean k up values, computed over all (pHi)Ctrl values. D, relationship between k up and (pHi)Ctrl for 10 individual WT astrocytes (light blue diamonds, from 3 cultures, 6 coverslips) and 9 individual AE3−/− astrocytes (orange triangles, from 3 cultures, 5 coverslips) under MAc conditions. The arrows identify the astrocytes in panel B. The inset is comparable to that in panel C. E, relationship between k up and (pHi)Ctrl for 17 individual WT neurons (black squares; from 2 cultures, 4 coverslips) and 14 individual AE3−/− neurons (red circles; from 2 cultures, 4 coverslips) under Ctrl conditions. Our protocol (not shown) was similar to that in panel A, except that we switched from extracellular solution 3 to solution 6, and then back to solution 3. The inset is comparable to that in panel C. Supplementary 7 includes plots of dpHi/dt and pHi for all neurons in this part of the study. F, relationship between k up and (pHi)Ctrl for 21 individual WT astrocytes (grey diamonds; from 2 cultures, 4 coverslips) and 17 individual AE3−/− astrocytes (pink triangles; from 2 cultures, 4 coverslips) under Ctrl conditions. The inset is comparable to that in panel C. Supplementary Fig. S8 includes plots of dpHi/dt and pHi for all astrocytes in this part of the study. For the insets in panels C, D, E and F (i.e. bar graphs), we performed two tailed unpaired t tests between WT and AE3−/− cells. For the main portions of panels C, D, E and F (i.e. scatter plots), we performed multivariate ANOVA between WT and AE3−/− cells.
The points overlaid onto segments de for both neurons (Fig. 4 A) and astrocytes (Fig. 4 B) represent some of the time points for which we derived the dpHi/dt values from the aforementioned exponential curve fits. The inset to Fig. 4 A shows the linear pHi dependence of the dpHi/dt values that we computed at each identified point for the WT neuron (shades of blue) and the AE3−/− neuron (shades of brown). The inset to Fig. 4 B shows the comparable plots for the WT astrocyte (shades of light blue) and the AE3−/− astrocyte (shades of orange).
Comparison, under MAc conditions, of rate constants for pHi recovery from acid loads (k up) for WT and AE3−/− cells
In analysing the best‐fit parameters for these data obtained under MAc conditions, we plot the relationship between k up and (pHi)Ctrl for WT neurons (Fig. 4 C, blue), AE3−/− neurons (Fig. 4 C, brown), WT astrocytes (Fig. 4 D, light blue), and AE3−/− astrocytes (Fig. 4 D, orange).
Figure 4 C shows ((pHi)Ctrl, k up) ordered pairs for 26 WT and 25 AE3−/− neurons. Compared to those for the WT neurons, the points for the AE3−/− neurons tend to be shifted toward higher (pHi)Ctrl values and have lower k up values, consistent with a decreased ability of the AE3‐deficient neurons to recover from an acute acid load. Multivariate ANOVA reveals that the relation between (pHi)Ctrl and k up is significantly different (P < 0.001) for WT vs. AE3−/− neurons, and the inset reveals that mean k up values, computed over all (pHi)Ctrl values, also are significantly different between WT and AE3−/− neurons.
Figure 4 D summarizes comparable data for 10 WT and 9 AE3−/− astrocytes. The reason that we have fewer astrocytes is that these cells tended not to withstand the rigors of an ammonium prepulse under conditions of MAc. In contrast to the multivariate ANOVA for the neuron data, that for the astrocyte data reveals only a borderline significant difference between WT and AE3−/− astrocytes (P value = 0.078), perhaps reflecting low statistical power. The bar graph shows that the difference between groups for mean k up values, computed over all (pHi)Ctrl values, does not reach statistical significance at the 0.05 level (P value = 0.092).
Comparison, under Ctrl conditions, of k up for WT and AE3−/− cells
To determine whether acid–base status impacts the role of AE3 in supporting acid extrusion, we extended our ammonium pre‐pulse protocol – thus far studied only under MAc conditions – to neurons and astrocytes under Ctrl conditions (experiments not shown). Here we began our experiments as usual by superfusing the cells with HBS (solution 1) for 5 min, followed by Ctrl (solution 3) for 10 min. We then exposed the cells to 20 mm NH3/NH4 + under Ctrl conditions (solution 6) for 2.5 min before returning to Ctrl.
As we did in Fig. 4 C and D for cells studied under MAc conditions, we now plot ((pHi)Ctrl, k up) ordered pairs for cells studied under Ctrl conditions, namely, WT neurons (Fig. 4 E, black), AE3−/− neurons (Fig. 4 E, red), WT astrocytes (Fig. 4 F, grey), and AE3−/− astrocytes (Fig. 4 F, pink). The inset of Fig. 4 E reveals no significant difference for 17 WT and 14 AE3−/− neurons regarding k up values, computed over all (pHi)Ctrl values. However, the scatter plot of ((pHi)Ctrl, k up) ordered pairs shows that, compared to those for WT neurons, the points for AE3−/− neurons tend to be shifted toward higher (pHi)Ctrl values. This pattern is consistent with a decreased ability of AE3‐deficient neurons to recover from acute acid loads, even under Ctrl conditions. Multivariate ANOVA reveals that the relation between (pHi)Ctrl and k up is significantly different (P = 0.033) for WT and AE3−/− neurons.
Figure 4 F summarizes ((pHi)Ctrl, k up) ordered pairs for 21 WT and 17 AE3−/− astrocytes. Unlike the situation in Fig. 4 D, where the knockout of AE3 produces only a borderline‐significant effect by multivariant ANOVA on k up for astrocytes studied under MAc conditions, here in Fig. 4 F – under Ctrl conditions – the knockout produces a statistically significant effect (P = 0.007) for WT vs. AE3−/− astrocytes. The blue box in the main portion of Fig. 4 F encompasses nearly all of the AE3−/− data. The bar graph in the left inset of Fig. 4 F summarizes the mean k up values for WT and AE3–/–, computed over all (pHi)Ctrl values within the narrow (pHi)Ctrl range of 7.05–7.17. An analysis of the WT and AE3–/– data within this blue box shows that the knockout produces a significant increase in k up ((25 ± 2) × 10–3 s−1 vs. (15 ± 2) × 10–3 s−1; P = 0.027). The right inset reveals that mean k up values, computed over all (pHi)Ctrl values, are also significantly different between WT and AE3−/− astrocytes.
In the following two paragraphs, we re‐analyse the data from Fig. 4 C–F in two different ways.
Four comparisons of k up for MAc vs. Ctrl conditions
For all four cell types in Fig. 4 C–F, one might have expected acid extrusion to be slower under MAc than Ctrl conditions. For data on WT neurons (Fig. 4 C and E) – analysed by unpaired, two‐tailed t tests within a (pHi)Ctrl range where the k up data overlap – k up values are paradoxically greater (P = 0.006) under MAc conditions (squares in Fig. 4 C: k up = (14 ± 2) × 10–3 s−1) than Ctrl conditions (squares in Fig. 4 E: k up = (8 ± 1) × 10–3 s−1). However, for AE3−/− neurons, k up values were not significantly different (P = 0.283) between MAc (circles in Fig. 4 C: k up = (6 ± 1) × 10–3 s−1) and Ctrl (circles in Fig. 4 E: k up = (8 ± 1) × 10–3 s−1). Multivariate ANOVA of all of the WT data plotted in Fig. 4 C and E confirms a difference between MAc and Ctrl (P = 0.033), whereas a comparable multivariate ANOVA of all AE3−/− neuron data in Fig. 4 C and E confirms no significant difference for these cells (P = 0.514).
The pattern for astrocytes is opposite that for neurons. For astrocytes, k up values tend to be greater under MAc conditions (Fig. 4 D) than Ctrl conditions (Fig. 4 F) for AE3−/− astrocytes (triangles; k up = (40 ± 2) × 10–3 s−1 vs. (25 ± 2) × 10–3 s−1; unpaired, two‐tailed t test, P = 0.039) but not for WT astrocytes (diamonds; k up = (25 ± 2) × 10–3 s−1 vs. (21 ± 4) × 10–3 s−1, P = 0.167). Multivariate ANOVA confirm these conclusions (P = 0.001 for AE3−/− astrocytes, and P = 0.273 for WT astrocytes).
In summary, in none of the four cases did the data bear out our expectation that k up would be greater under Ctrl than under MAc conditions.
Four comparisons of k up for neurons and astrocytes
One last set of observations from Fig. 4 is that astrocytes – whether WT or AE3−/−, and whether studied under Ctrl or MAc conditions – tend to have greater k up values than their adjacent neurons (compare Fig. 4 D vs. C, and compare Fig. 4 F vs. E). Note that the y‐axis scales in Fig. 4 D and F are twice as large as those in Fig. 4 C and E. These differences are consistent with our observation in Fig. 1 that astrocytes tend to recover more rapidly than do neurons from alkaline loads.
Neurons but not astrocytes require Cl− for the recovery of pHi from an acid load
One potential explanation for why acid extrusion is more robust in WT than in AE3−/− neurons (Fig. 4 C and E) is that [Cl–]i is sufficiently high that, in WT neurons, AE3 reverses (i.e. mediates HCO3 – uptake and Cl– efflux) at the low pHi and [HCO3 –]i values prevailing near the pHi nadir (point d in Fig. 4 A and B) after removal of NH3/NH4 +. However, as noted in the Discussion, pHi would have to fall to ∼6.34 under Ctrl conditions or to ∼6.16 under MAc conditions – circumstances that are not met in our experiments – before AE3 would reverse and contribute to net acid extrusion.
A second potential explanation for why acid extrusion is more robust in WT than in AE3−/− neurons is that AE3 – when operating in its normal or forward direction (i.e. exchanging intracellular HCO3 – for extracellular Cl–) – promotes Cl– uptake, especially during MAc. Thus, AE3 would replenish Cl– removed from neurons by NDCBE, which is a powerful acid extruder in neurons (Schwiening & Boron, 1994; Schmitt et al. 2000; Coley et al. 2013). In some systems, a relatively high [Cl–]i also somehow promotes Na+–H+ exchange (Davis et al. 1994; Rajendran et al. 1995, 1999; Hogan et al. 1997; Bevensee et al. 1999). Thus, AE3‐mediated Cl– uptake could enhance acid extrusion by promoting both NDCBE and NHE activity.
Although the most direct approach to test this second hypothesis would be to monitor [Cl–]i under Ctrl and MAc conditions, our attempts to do so were not technically satisfactory. Therefore, we decided to determine, in a way that is independent of AE3, whether cytosolic Cl− promotes acid extrusion from neurons. Our approach was to impose MAc and then, in the continued presence of MAc, impose an intracellular acid load using the NH4 + pre‐pulse technique with co‐cultured WT neurons and astrocytes, as in Fig. 4 A and B. However, here, we remove extracellular Cl− (solution 7) as we wash out NH3/NH4 +. Figure 5 A shows a representative response of a WT neuron to this manoeuvre. In sharp contrast to what we observe when Cl– is present, that is, a rapid pHi fall (segment cd in Fig. 4 A) followed by a robust pHi recovery (segment de in Fig. 4 A) during NH3/NH4 + washout, here in Fig. 5 A we observe a triphasic pHi trajectory with the simultaneous removal of Cl– and NH3/NH4 +: (1) pHi at first falls rapidly (segment cc′ in Fig. 5 A), which reflects the dominant early effects of NH3 efflux; (2) pHi then temporarily rises slowly (segment c′c′′), presumably because, as the NH3 efflux wains, two processes triggered by Cl− removal (i.e. reversal of AE3 and stimulation of acid extrusion via NDCBE) now become temporarily dominant; finally, (3) pHi descends slowly (segment c′′c′′′), presumably because the alkalinizing events in phase 2 deplete the neuron of intracellular Cl–, so that the alkalinization is self‐limited and the pHi dynamics of the neuron now reflect the dominance of an AE‐independent acid‐loading process (e.g. the one remaining in the AE3−/− neuron in Fig. 1). The lower panel of Fig. 5 A shows that the rate of BCECF disappearance (–k 440) from the neuron is extremely low, consistent with a tight neuronal membrane (Bevensee et al. 1995). Even if processes other than those we postulate contribute to the unusual pHi trajectory in segment c′c′′c′′′ of Fig. 5 A, it seems clear that the recovery of pHi during segment de of Fig. 4 A requires Cl–, presumably intracellular Cl–.
Figure 5 B shows representative data from an astrocyte on the same coverslip as the neuron in Fig. 5 A. We see that simultaneous removal of NH3/NH4 + and Cl– in Fig. 5 B produces the expected rapid decrease in pHi (segment cd), followed by a recovery (segment de), similar to the pattern in Fig. 4 B for an astrocyte in which we removed NH3/NH4 + in the continuous presence of Cl–. Thus, the segment‐de pHi recovery in our astrocytes does not have a major dependence on Cl–. This conclusion is consistent with that of an earlier study on cultured rat HC astrocytes (Bevensee et al. 1996). After the recovery is complete in Fig. 5 B, pHi slowly declines by a small amount (segment ee′). We observed a similar ee′ pattern in 5 of 9 astrocytes recorded on four coverslips.
In astrocyte‐only cultures, the knockout of AE3 has no effect on the astrocytic pHi phenotype
MAc protocol
The data summarized in Figs 1, 2, 3, 4 are consistent with the hypothesis that AE3‐dependent crosstalk between neurons and astrocytes affects the pHi physiology of astrocytes. To examine further the role of AE3 in this neuron–astrocyte pHi communication, we generated astrocyte‐only cultures (AOCs) from WT and AE3−/− mice and subjected the cells to our MAc protocol. Figure 6 A shows representative traces for a WT (dark green) and an AE3−/− (light green) astrocyte from AOCs. Figure 6 B summarizes the pHi trajectories in response to MAc for 23 WT and 20 AE3−/− astrocytes.
Figure 6. Responses of pHi to MAc exposure in hippocampal astrocytes in astrocytes‐only cultures (AOCs).

A, examples of pHi responses in two HC astrocytes; WTAOC (dark green) and AE3AOC −/− (light green) to MAc. B, summary of pHi responses to MAc in AOC astrocytes. The panel shows the mean responses of 23 WTAOC astrocytes (dark green squares; from 2 cultures, 3 coverslips) and 20 AE3AOC −/− astrocytes (light green circles; from 2 cultures, 4 coverslips) to MAc. C, mean control pHi (point a in panel A) for 23 WTAOC astrocytes (dark green bar) and 20 AE3AOC −/− astrocytes (light green bar) before MAc exposure. D, relationship between (dpHi/dt)early and (pHi)Ctrl for 23 individual WTAOC astrocytes (green diamonds) and 20 individual AE3AOC −/− astrocytes (light green triangles) to MAc. The arrows identify the astrocytes in panel A. Supplementary Fig. S9 includes plots of k down vs. (pHi)Ctrl for all astrocytes in this part of the study. E, relationship between (dpHi/dt)late (segment bc in panel A) and (pHi)Ctrl for 23 individual WTAOC astrocytes and 20 individual AE3AOC −/− astrocytes. F, mean pHi (point c in panel A) for 23 WTAOC astrocytes (dark green) and 20 AE3AOC −/− astrocytes (light green) before MAc removal. G, relationship between (dpHi/dt)final and (pHi)Ctrl for 23 individual WTAOC astrocytes (green diamond) and 20 individual AE3AOC −/− astrocytes (light green triangles). Supplementary Fig. S10 includes plots of dpHi/dt vs. pHi for all astrocytes in this part of the study. H, relationship between (pHi)final and (pHi)Ctrl for 23 individual WTAOC astrocytes and 20 individual AE3AOC −/− astrocytes. The bar graphs in panels C and F, and the insets in panels D, E, G and H show comparisons of the means among astrocytes in mixed culture (Figs 2 and 3) and AOC, computed over all (pHi)Ctrl values. For the bar graphs in the main portions of panels C and F we performed two‐tailed unpaired t tests between WT and AE3−/− cells. For the six insets, we used ANOVA with Tukey's pairwise comparison. P overall is the P value from the ANOVA. For the main portions of panels D, E, G and H (i.e. scatter plots), we performed multivariate ANOVA between WT and AE3−/− cells. NS, not significant; *0.05 ≥ P; **0.001 ≥ P.
Comparison of (pHi)Ctrl values
Figure 6 C shows that, in astrocyte‐only cultures, the initial pHi values in the Ctrl solution for AE3−/− astrocytes (AE3AOC −/−, light green) is slightly but significantly higher than those for WT astrocytes (WTAOC, dark green). This (pHi)Ctrl relationship between AE3−/− and WT astrocytes in AOCs is just the opposite of what we observed in mixed neuron–astrocyte cultures (Fig. 2 E). The basis for this inversion is not the behaviour of the AE3−/− astrocytes – their mean initial pHi values are not significantly different in AOCs (light green bar in Fig. 6 C) vs. mixed cultures (pink in Fig. 2 E). Rather, the difference is the behaviour of WT astrocytes, which have a much lower initial pHi in AOCs (dark green bar in Fig. 6 C) than in mixed cultures (grey bar in Fig. 2). Thus, we conclude that the presence of neurons – that is, the presence of neurons per se or the differences in methodology used to achieve mixed and astrocyte‐only cultures – in mixed neuron–astrocyte cultures somehow causes astrocytes to have a relatively high initial pHi in CO2/HCO3 – (i.e. Ctrl), but only if the neurons contain AE3.
Comparison of (dpHi/dt)early data
In Fig. 6 D, we plot the relationship between (dpHi/dt)early – segment ab in Fig. 6 A – and (pHi)Ctrl for both AE3AOC −/− and WTAOC. Note that in AOCs, multivariate analysis shows no significant difference (NS) in (dpHi/dt)early between AE3−/− (light green triangles) and WT (dark green diamonds). The inset in Fig. 6 D shows that (dpHi/dt)early for WT astrocytes in mixed culture is significantly greater than (dpHi/dt)early for WT astrocytes in AOCs as well as for AE3−/− astrocytes, regardless of whether they are in mixed cultures or AOCs. For AE3−/− astrocytes, (dpHi/dt)early is not significantly different between AOCs (light green bar) and mixed cultures (pink bar).
Comparison of (dpHi/dt)late data
Figure 6 E summarizes the relationship between (dpHi/dt)late and (pHi)Ctrl. Multivariate analysis shows no significant difference between WTAOC and AE3AOC −/−. The inset in Fig. 6 E shows that for WT and AE3−/− astrocytes, (dpHi/dt)late is greater in AOCs than mixed culture (dark green vs. grey bar, light green vs. pink bar). In other words, the presence of neurons markedly decreases the magnitude of (dpHi/dt)late. On a percentage basis, this decrease is greater if the neurons contain AE3.
Comparison of pHi values at point c
Figure 6 F shows that the mean pHi values achieved at point c are not significantly different between any two of the four groups.
Comparison of (dpHi/dt)final data
Figure 6 G summarizes the relationship between (dpHi/dt)final – segment cd in Fig. 6 A – and (pHi)Ctrl. Multivariate analysis reveals no significant differences between AE3AOC −/− and WTAOC. The inset in Fig. 6 G shows that, for WT astrocytes, (dpHi/dt)final is substantially less in AOCs (dark green bar) than mixed cultures (grey bar). However, for AE3−/− astrocytes, (dpHi/dt)final is not significantly different between AOCs (light green bar) vs. mixed cultures (pink bar). Thus, the presence of neurons increases (dpHi/dt)final, but only if the neurons contain AE3.
Comparison of (pHi)final data
Our last observation, summarized in Fig. 6 H, is that the ordered pairs ((pHi)Ctrl, (pHi)final) are not significantly different for WT vs. AE3−/− astrocytes in AOCs. The inset in Fig. 6 H shows that, for AE3−/− astrocytes, the (pHi)final values in AOCs (light green bar) and mixed cultures (pink bar) are indistinguishable. However, for WT astrocytes, (pHi)final is significantly less in AOCs (dark green bar) than in mixed cultures (grey bar). In other words, the presence of neurons somehow causes astrocytes to have a relatively high (pHi)final, but only if the neurons contain AE3. This is the same pattern as for (pHi)Ctrl (Fig. 6 C).
Extracellular Cl− removal reverses MAc effects on pHi in neurons, but not astrocytes
Cl–‐removal protocol for WT cells
Published data indicate that neurons but not astrocytes express AE3 (Kopito et al. 1989; Hentschke et al. 2006). In order to verify that astrocytes in our studies lack functional Cl−–HCO3 − exchange, particularly under conditions of MAc, we performed the experiments summarized in Fig. 7. The experiments began with our usual transition to MAc (solution 4). However, after the 7 min MAc exposure, we removed extracellular Cl− (solution 7) in the continued presence of MAc. Figure 7 A shows pHi records for a WT neuron (black record) and a WT astrocyte (grey record) on the same coverslip. Before the neuron reaches point c, AE3 is exchanging intracellular HCO3 – for extracellular Cl−. At point c, we remove extracellular Cl−, forcing neuronal AE3 to reverse and exchange intracellular Cl− for extracellular HCO3 –. This manoeuvre causes pHi to rise in the neuron (segment cx) but to fall slightly in the astrocyte.
Figure 7. Responses of pHi to Cl– removal during MAc in hippocampal neurons and astrocytes in mixed culture.

A, examples of pHi time courses in a WT neuron and astrocyte on the same coverslip. At the indicated times, we switched from extracellular solution 3 to solution 4, and then to solution 7. B, examples of pHi time courses in an AE3–/– neuron and astrocyte on the same coverslip. C, mean responses of 16 WT (black squares; from 3 cultures, 4 coverslips) and 9 AE3−/− (red circles; from 3 cultures, 3 coverslips) neurons to Cl– removal during MAc. These 16 WT and 9 AE3–/– neurons represent a subset of the 41 WT and 47 AE3–/– neurons described in Fig. 2 F. D, mean responses of 20 WT (grey squares; from 2 cultures, 4 coverslips) and 23 AE3−/− (pink circles; from 3 cultures, 3 coverslips) astrocytes to Cl– removal during MAc. These 20 WT and 23 AE3–/– astrocytes represent a subset of the 34 WT and 60 AE3–/– neurons described in Fig. 2 F. The inset between panels C and D summarizes comparable data from 17 WT neurons and 12 WT astrocytes, but obtained under Ctrl (as opposed to MAc) conditions. E, mean pHi for WT (black bar) and AE3−/− neurons (red bar), just before Cl– removal (point c in panel A), computed as described in Methods. E is analogous to Fig. 3 D. F, mean pHi for WT (grey bar) and AE3−/− astrocytes (pink bar), just before Cl– removal (point c in panel A). F is analogous to Fig. 3 E. G, relationship between the most rapid rate of pHi change after Cl– removal ((dpHi/dt)Cl removal) – computed as described in Methods – and (pHi)Ctrl for 16 individual WT neurons (black squares) and 9 individual AE3−/− neurons (red circles) under MAc conditions. The arrows identify the neurons in panel A. The inset shows mean (dpHi/dt)Cl removal values, computed over all (pHi)Ctrl values. H, relationship between (dpHi/dt)Cl removal and (pHi)Ctrl for 20 individual WT astrocytes (grey diamonds) and 23 individual AE3−/− astrocytes (pink triangles) under MAc conditions. The arrows identify the astrocytes in panel A. The inset is comparable to that in panel G. I, relationship between the change in pHi caused by Cl– removal ((∆pHi)Cl removal) and (pHi)Ctrl for 16 individual WT neurons (black squares) and 9 individual AE3−/− neurons (red circles) under MAc conditions. We define (∆pHi)Cl removal as the difference between pHi values at points y and c in panel A – these pHi values were computed as described in Methods. The left inset is comparable to that in panel G, but for (∆pHi)Cl removal. The right inset shows pHi records from two neurons that have the same (dpHi/dt)Cl removal but different (∆pHi)Cl removal. J, relationship between (∆pHi)Cl removal and (pHi)Ctrl for 20 individual WT astrocytes (grey diamonds) and 23 individual AE3−/− astrocytes (pink triangles) under MAc conditions. The inset is comparable to the left inset in panel I. For the bar graphs in panels E and F and in the insets to panels G, H, I, and J (i.e. bar graphs), we performed two‐tailed unpaired t tests between WT and AE3−/− cells. For the main portions of panels G, H, I and J (i.e. scatter plots), we performed multivariate ANOVA between WT and AE3−/− cells.
Cl–‐removal protocol for AE3−/− cells
Figure 7 B shows records for an AE3−/− neuron (red record) and an AE3−/− astrocyte (pink record), again on the same coverslip. Here, pHi continuously decreases during MAc, confirming the pattern we observed in Fig. 2 B for an AE3−/− neuron and Fig. 2 C for an AE3−/− astrocyte. When we remove extracellular Cl−, the pHi of the AE3−/− neuron stops falling and rises somewhat before continuing on a downward trend, whereas the pHi of the AE3−/− astrocyte initially falls at an accelerated rate. In the case of the AE3−/− neuron, the transient rise in pHi may be due to reversed Na+‐driven Cl−–HCO3 − exchange activity, caused by Cl– removal (Parker et al. 2008).
Summary of pHi responses to Cl– removal
For experiments like those in Fig. 7 A and B, Fig. 7 C summarizes the mean pHi time courses for the neurons, and Fig. 7 D does the same for astrocytes. The inset below Fig. 7 C and D is a summary of the pHi time courses of WT and AE3−/− neurons when we remove Cl– under Ctrl (rather than MAc) conditions.
Comparison of pHi values at point c
Figure 7 E summarizes the mean pHi values for neurons during a MAc pulse, just before Cl− removal (point c in Fig. 7 A). Figure 7 F does the same for astrocytes.
Comparison of (dpHi/dt)Cl removal data for neurons
In Fig. 7 G, we plot, as a function of (pHi)Ctrl, the initial slope of the pHi trajectory during Cl− removal ((dpHi/dt)Cl removal) for WT and AE3−/− neurons. Multivariate ANOVA indicates a significant difference between the two groups. These results are consistent with substantially greater Cl−–HCO3 − exchange activity in WT than AE3−/− neurons. The inset in Fig. 7 G shows that the mean (dpHi/dt)Cl removal, computed over all (pHi)Ctrl values, is significantly different between the groups.
Comparison of (dpHi/dt)Cl removal data for astrocytes
In Fig. 7 H we plot (dpHi/dt)Cl removal vs. (pHi)Ctrl for WT and AE3−/− astrocytes. Multivariate ANOVA shows a significant difference between the WT and AE3−/− data. These data indicate that neither WT nor AE3−/− astrocytes have detectable Cl−–HCO3 − exchanger activity. The inset in Fig. 7 H shows that the mean (dpHi/dt)Cl removal values, computed over all (pHi)Ctrl values, of WT and AE3−/− astrocytes are significantly different, with the AE3−/− astrocytes having a paradoxically negative slope.
Comparison of ΔpHi data during Cl– removal, for neurons
In Fig. 7 I we plot (∆pHi)Cl removal – the pHi difference between point y and point c (7 min Cl– removal in Fig. 7 A) – vs. (pHi)Ctrl for WT and AE3−/− neurons. The plot has a somewhat different pattern from that in Fig. 7 G because of differences in pHi trajectory after the initial trajectory summarized in Fig. 7 G. In the upper‐right inset in Fig. 7 I, we show an example of such a difference between the pHi records of two WT neurons on the same coverslip. Multivariate ANOVA of the data in the main panel of Fig. 7 I reveals a significant difference between WT and AE3−/− neurons. The upper‐left inset in Fig. 7 I shows borderline significance in the overall (∆pHi)Cl removal between the groups.
Comparison of ΔpHi data during Cl– removal, for astrocytes
In Fig. 7 J we plot (∆pHi)Cl removal vs. (pHi)Ctrl for WT and AE3−/− astrocytes. Multivariate ANOVA shows a significant difference between the two groups. The inset in Fig. 7 J shows a statistically significant difference between mean ΔpHi values, computed over all (pHi)Ctrl values, with ΔpHi being around zero for WT astrocytes, but negative for AE3−/− astrocytes.
From the results in Fig. 7, we conclude that, in neurons but not astrocytes, the presence of AE3 enhances the increase in pHi elicited by the removal of extracellular Cl−. WT astrocytes do not exhibit a statistically significant (dpHi/dt)Cl removal or ΔpHi during Cl– removal under MAc conditions, but AE3−/− astrocytes exhibit a paradoxical acidification.
Discussion
When neurons and astrocytes are subjected to MAc, they usually exhibit a decrease in pHi (Salameh et al. 2014). However, before the present study, the mechanism of the decrease was unclear. We find that, in neurons, it is AE3 that largely mediates the rapid fall in pHi, early during MAc. In addition, we show that AE3 paradoxically is important in braking a further decrease of pHi later during MAc. Even more unexpectedly, we find that the presence of AE3 in neurons leads to complex changes in the kinetics of acid–base transport in astrocytes. The net effect is an elevation of astrocytic pHi under Ctrl conditions, and an increased uptake of acid during MAc that, in the intact brain, would tend to protect the neurons from acidosis. These effects of neuronal AE3 on astrocyte acid–base physiology could account for why the knockout of AE3 promotes epilepsy even though the knockout has no effect on resting neuronal pHi.
Limitation of our study
Neurons and astrocytes in mixed culture often grow on top of one other. Thus, a neuronal soma that was part of our analysis may have been above a thin bed of astrocytic processes, and an astrocytic soma may have been underneath tiny neuronal processes. Such overlaps unavoidably lead to some degree of cross‐contamination between the BCECF signals of neurons and astrocytes. Nevertheless, we believe that the cross‐contamination had at most a minor effect in our analyses because large BCECF signals from the relatively thick soma would have overwhelmed small signals from thin astrocytic layers or tiny neuronal processes. Support for this intuition comes from our data. The pHi trajectories from AOIs identified as neurons vs. astrocytes, as well as the values derived from these pHi data, are quite different, as evidenced in all figures (except Fig. 6) that contain both cell types. In fact, we find no examples in which any ‘neuron panel’ of any figure could be confused with its corresponding ‘astrocyte panel.’ To the extent that cross‐contamination did occur, it would have caused us to underestimate the true degree of difference between neurons and astrocytes.
Role of AE3 in neurons
Acid loading
The role of AE3 as an acid loader in neurons was first implied based on its structural homology with the anion exchanger AE1 (Kopito et al. 1989). Although functional studies involving different cell models verified this hypothesis (Kopito et al. 1989; Hentschke et al. 2006; Vilas et al. 2009), none investigated the role of AE3 in acid loading the cytosol in neurons per se. In the present work, we show that HC neurons lacking AE3 have (1) a greater pHi increase during CO2 efflux (upper portion of Fig. 1 C), (2) a smaller (i.e. slower) k down during the recovery from intracellular alkalosis (Fig. 1 E), (3) a relatively high (pHi)∞ following the recovery from alkalosis (Fig. 1 E), and (4) a smaller magnitude of (dpHi/dt)early when subjected to extracellular MAc (Fig. 2 H). All these observations are consistent with the hypothesis that AE3 is the major acid loader in HC neurons.
As noted in the Results, neurons lacking AE3 exhibit a slow residual recovery from an intracellular alkaline load (segment bc in Fig. 1 C and red circles in Fig. 1 E). Therefore, HC neurons either express an unknown acid loader or have an acid extruder that reverses direction at high pHi and temporarily acts as an acid loader. To assess the latter possibility, we calculated the reversal pHi, (pHi)rev, for each major acid extruder expressed in HC neurons, based on the extracellular and intracellular ion concentrations summarized in Table 2. We define (pHi)rev as the pHi value at which the thermodynamic driving force for a specific transporter, as summarized in Table 3, equals zero. Hence, a transporter will operate as an acid extruder when pHi < (pHi)rev, but may operate as an acid loader (i.e. backwards) when pHi > (pHi)rev. For HC neurons, we conclude, based on the approach outlined in Methods under ‘Thermodynamic analysis of acid–base transporters’, that NBCn1 and NHE each have (pHi)rev values of 8.32, and thus could not have reversed during our experiments. However, NDCBE has a (pHi)rev of 7.33. From Fig. 1 E we see that ∼21% of AE3−/− neurons have a (pHi)∞ ≥ 7.33 (indicated by left vertical line in Fig. 1 E). Thus, if NDCBE reversed, it would have contributed to the full extent of the pHi recovery from alkaline loads in these neurons. For NBCe1, as noted in the ‘Thermodynamic analysis of acid–base transporters’, the neuronal membrane potential is ∼ −60 mV, hence, (pHi)rev is ∼7.37 (indicated by right vertical line in Fig. 1 E). About 16% of AE3–/– neurons have a (pHi)∞ ≥ 7.37 and, in these, NBCe1 could have contributed to the full extent of the pHi recovery. Even for many neurons in which (pHi)∞ for NDCBE or NBCe1 was below the relevant (pHi)rev, NDCBE or NBCe1 could have contributed to the pHi recovery over part of the extent of the decrease. Nevertheless, for at least some of the neurons in Fig. 1 E, even the peak pHi (point b in Fig. 1 C) was less than 7.33. For these, NDCBE or NBCe1 could not have contributed, and the residual k down must represent an acid‐loading process other than AE3 (e.g. another transporter or metabolism).
Table 2.
Summary of intracellular and extracellular ion concentrations
| Ion | Extracellular concentration (mm) | Intracellular neuronal concentration (mm) | Intracellular astrocytic concentration (mm) | References |
|---|---|---|---|---|
| Na+ | 140 | 16.2 | 18.3 | (Friedman & Haddad, 1994; Rose & Ransom, 1996, 1997; Theparambil et al. 2015) |
| HCO3 – | 22 (Ctrl) 14 (MAc) | Calculated | Calculated | |
| Cl– | 113 (Ctrl) 121 (MAc) | 10.1 | — | (Hara et al. 1993; Khirug et al. 2008; Markova et al. 2008) |
All concentrations in mm. Extracellular values come from Table 1. The cited references provide the sources for the intracellular concentrations. The value 16.2 mm is the mean of three values (25, 14.6, 8.9 mm) from the cited references. The value 10.1 mm is the mean of three values (11.4, 7.9, 11 mm) from the cited references.
Table 3.
Summary of reversal [HCO3 −] and pHi
| Transporter | ([HCO3 −]i)rev (mm) | (pHi)rev | Potentially reverse in present study? |
|---|---|---|---|
| NDCBE | 18.9 | 7.33 | Yes* |
| NBCe1 in neurons | 20.6 | 7.37 | Yes* |
| NBCe1 in astrocytes | 11.8 | 7.13 | Yes* |
| NBCn1 and NHE1 | 182 (for NBCn1) | 8.32 | No |
| AE3 during Ctrl conditions | 1.97 | 6.35 | No† |
| AE3 during MAc conditions | 1.17 | 6.12 | No |
*During moderate alkaline loads. †Given a [Cl–]i of ∼10 mm (Table 2), AE3 could reverse only rarely, during extreme acid loads.
As an acid loader (mediating Cl– influx/HCO3 – efflux), AE3 does not operate in a vacuum. In addition to depending on pHi per se, AE3 depends to at least some extent on [HCO3 –] and [Cl–] on both sides of the plasma membrane. [HCO3 –] near the plasma membrane depends on HCO3 – transporters per se, as well as on [CO2] and pH and the carbonic anhydrase enzymes that catalyse the overall reaction CO2 + H2O ↔ HCO3 – + H+. [Cl–]i depends on Cl– transporters and channels. The Na+/K+/Cl– cotransporter (NKCC; Arroyo et al. 2013; Kaila et al. 2014) and GABA‐ or glycine‐activated Cl– channels (Hubner & Holthoff, 2013) usually mediate Cl– influx, and thus raise [Cl–]i, which may in turn reduce acid loading via AE3. On the other hand, K+/Cl– cotransporters (KCCs; Gagnon & Delpire, 2013) usually mediate Cl– efflux and may have opposite effects on AE3. Thus, the acid loader AE3 – as well as the acid extruders NDCBE and NHEs, which depend on [Cl–]i – may be under multiple dynamic and interacting influences from HCO3 – and other acid–base transporters, as well as Cl– transporters and channels.
In addition to their roles discussed above, NKCC1 and KCCs may play additional roles by carrying NH4 + in place of K+ (Heitzmann et al. 2000; Bergeron et al. 2003; Liu et al. 2003; Williams & Payne, 2004) during the application, presence and removal of NH3/NH4 + in experiments like those in Fig. 4 A and B.
Acid extrusion
Because AE3 is an acid loader, one might have speculated that its absence would enhance the net rate of pHi recovery from an acid load (particularly at the higher end of the pHi range where AE3 is most likely to be active) and increase steady‐state pHi. One would not anticipate that the absence of AE3 would affect the activity of acid extruders per se. In the present study, we find that neurons lacking AE3 have (1) a steady‐state pHi that is not different from that of WT neurons under Ctrl conditions, confirming the work of others (Hentschke et al. 2006); (2) a reduced ability to stabilize (i.e. prevent a decrease in) pHi during the late phase of MAc (segment bc in Fig. 2 B), (3) a reduced (slower) k up after the transition from MAc to Ctrl (segment cd in Fig. 3 B), (4) a lower steady‐state pHi after recovery from MAc (Fig. 3 D), and (5) a reduced (slower) k up during the pHi recovery from acute acid load imposed by an NH4 + prepulse (Fig. 4 C and E). These observations contradict the previously mentioned speculations and suggest that the presence of AE3 is important for acid extrusion.
A trivial explanation for why AE3 increases J E is that pHi falls sufficiently to cause AE3 to reverse direction and temporarily function as an acid extruder. Based on the approach outlined in Methods (see ‘Thermodynamic analysis of acid–base transporters’) and the concentrations listed in Table 2, we estimate that pHi would have to fall to <6.35 under Ctrl conditions, or to <6.12 under MAc conditions, in order for AE3 to reverse its activity and exchange intracellular Cl− for extracellular HCO3 –. In the present study, pHi transiently fell <6.35 under Ctrl conditions only in 2 of 26 cells, one that fell as low as 6.22 and another that fell as low as 6.16. The pHi never fell <6.12 under MAc conditions. Thus, we can rule out the hypothesis that reversal of AE3 makes a substantial contribution to the AE3‐dependent augmentation of acid extrusion in the present study, where [Cl–]i is ∼10 mm. On the other hand, in vivo, sustained high levels of GABA‐ or glycine‐induced Cl– channel activity or NKCC activity could raise [Cl–]i above ∼10 mm, and thereby raise (pHi)rev correspondingly above our estimated value of ∼6.35. Even so, AE3 molecules probably spend only a miniscule fraction of their lifetime in the plasma membrane operating in the reverse direction (i.e. Cl– outward/HCO3 – inward).
Another explanation is that AE3 provides neurons with the Cl– that supports neuronal acid‐extrusion mechanisms. NDCBE requires Cl– directly (Russell & Boron, 1976; Boron & Russell, 1983) and in several systems NHEs require Cl– indirectly (Parker, 1983; Davis et al. 1994; Rajendran et al. 1995, 1999; Hogan et al. 1997; Bevensee et al. 1999). For instance, in barnacle muscle fibres, shrinkage‐induced activation of NHE requires intracellular, but not extracellular, Cl– (Davis et al. 1994). The intracellular Cl– dependence of NHE1 reflects the intrinsic activity of individual NHE1 molecules, and specifically requires the carboxy‐terminal portion of NHE1, which may interact with Cl– directly or via an intermediary protein (Aharonovitz et al. 2001). In the present study, support for the hypothesis that Cl– supports neuronal acid extrusion comes from Fig. 5 A, which shows that Cl– depletion prevents the usual recovery of pHi from an acid load imposed via an NH3/NH4 + prepulse. This Cl– dependence of acid extrusion in neurons could explain the well‐known but paradoxical observation that the knockout of AE3 does not cause the expected increase of steady‐state neuronal pHi (Hentschke et al. 2006). Note that the knockout of an acid loader like AE3 can raise steady‐state pHi only if the expected reduction in J L overwhelms any unexpected reduction in J E. We hypothesize that the elimination of AE3 not only lowers J L directly but also, by reducing [Cl–]i, lowers J E indirectly, so that steady‐state pHi is unchanged.
The hypothesis that AE3 contributes to acid extrusion by tending to elevate [Cl–]i is especially germane for MAc experiments, where (1) the stimulation of AE3 not only plays a major role in lowering pHi but also should tend to raise [Cl–]i, and (2) NDCBE, although initially inhibited by the low pHo, should tend to accelerate as pHi falls, and thus tend to deplete the neuron of Cl–. AE3 would thus play a dual role during MAc: promoting the initial acidification by mediating HCO3 – efflux, but putting a brake on the pHi decline by mediating Cl– uptake and thereby supporting acid extrusion.
Role of neuronal AE3 in astrocytes
Absence of AE3 from astrocytes
Previous authors, using in situ hybridization in mouse brain (Kopito et al. 1989) and Western blotting of lysates from astrocyte‐only cultures (Hentschke et al. 2006), report that astrocytes do not express AE3. In the present study, our physiological data show that Cl––HCO3 – exchange activity is negligible in astrocytes, both under Ctrl conditions (inset beneath Fig. 7 C and D) and MAc conditions (Fig. 7 B, D and H). Thus, our data extend those of previous studies, so that we can conclude that astrocytes have no demonstrable AE3 mRNA, AE3 protein, or AE3 activity.
pHi regulation in astrocytes
Previous work shows that NBCe1‐C (Bevensee et al. 2000) is highly expressed in HC astrocytes (Majumdar et al. 2008). Moreover, in the presence of CO2/HCO3 –, NBCe1‐C mediates virtually all acid extrusion in the pHi range 6.8–7.0 (Bevensee & Boron, 2008), that is, modestly below resting pHi. At lower pHi values, the contribution of NHE1 (Sardet et al. 1989) – with a small contribution from V‐type H+ ATPase (Pappas & Ransom, 1993) – begins to increase in an exponential‐like manner (Bevensee et al. 1997 b; Bevensee & Boron, 2008), and appears to become dominant at very low pHi values (6.2–6.3). This exponential‐like J NHE vs. pHi profile is similar to that reported in cardiac myocytes (Vaughan‐Jones et al. 2009). Thus, for acid extrusion in astrocytes, NBCe1 is virtually the only acid extruder near the resting pHi, but NHE1 becomes increasingly dominant at lower values.
Regarding acid loading, Theparambil et al. (2015) recently showed that during the recovery from intracellular alkalosis, NBCe1 can reverse direction and function as the dominant acid loader in cortical astrocytes. Based on the approach outlined in Methods to calculate NBCe1 (pHi)rev, our calculations support this conclusion, and indicate that NBCe1 should reverse and become an acid loader at an average pHi > 7.16, which is just slightly above the resting pHi of WT and AE3–/– astrocytes.
Evidence for AE3‐dependent neuron–astrocyte communication
Knowing that astrocytes lack AE3, we expected that knocking out AE3 would have no effect on astrocyte pHi physiology. However, as outlined in Table 4, we find that AE3−/− astrocytes have a pHi phenotype that differs from that of their WT counterparts. First, knocking out AE3 decreases astrocyte J L at high pHi values. Because NBCe1 – operating in reverse – is the dominant acid loader in astrocytes (Theparambil et al. 2015), the most straightforward hypothesis is that the knockout of AE3 reduces the activity of NBCe1 operating in reverse. Second, knocking out AE3 decreases astrocyte J E, in the pHi range near the steady‐state pHi that prevails under Ctrl and MAc conditions. Because NBCe1 – operating in the forward direction – is the only acid extruder active in this pHi range, we hypothesize that the knockout of AE3 reduces the activity of NBCe1 operating in the forward (i.e. acid‐extruding) direction. Finally, knocking out AE3 modestly increases astrocyte J E under Ctrl conditions at the lower pHi values that prevail during recovery from an NH3/NH4 + prepulse (the effect is not statistically significant under MAc conditions). It is at these low pHi values where NHE becomes a more dominant acid extruder in astrocytes (Bevensee & Boron, 2008). Even so, we expected that a reduction in NBCe1 activity in AE3–/– cells would have reduced J E to some extent, even at low pHi. That the knockout increases J E at low pHi implies that the knockout of neuronal AE3 enhances astrocytic NHE1 activity. Based on the above observations, we hypothesize that the presence of AE3 in neurons somehow communicates to astrocytes a message that results in alterations in pHi regulation, most likely a stimulation of NBCe1 activity and an inhibition of NHE1 activity.
Table 4.
Summary of effects on astrocytes of knocking out neuronal AE3
| Figure number | Parameter | Effect of AE3 KO on parameter | Predicted effect of AE3 KO on (J E − J L) | Hypothesis |
|---|---|---|---|---|
| Fig. 1 C and E | k down (rate constant of pHi recovery [decrease] after 10% → 5% CO2 transition) | ↓ | ↑ |
|
| Fig. 2 C and E | (pHi)Ctrl | ↓ | ↓ | |
| Fig. 2 C, G and I | (dpHi/dt)early (rate of pHi decrease during transition Ctrl → MAc) | ↓ magnitude | ↑ |
|
| Fig. 2 C and K | (dpHi/dt)late (rate of pHi downward drift during last several mins of MAc) | ↑ magnitude | ↓ | |
| Fig. 3 C and G | (dpHi/dt)final (rate of pHi increase during transition MAc → Ctrl) | ↓ | ↓ | |
| Fig. 3 C and K | (pHi)final (steady‐state pHi after MAc removal) | ↓ | ↓ | |
| Fig. 4 B and D | k up (rate constant of pHi recovery [increase] in MAc after NH4 + prepulse) | None | None | At low pHi values, KO of AE3 does not have a statistically significant effect on J E during MAc. Hypothesis: ↑ NHE1 activity (increasingly active at low pHi) compensates for ↓ NBCe1 activity in MAc (see Fig. 2 C and E conclusion no. 2). |
| Fig. 4 F | k up (rate constant of pHi recovery [increase] in Ctrl after NH4 + prepulse) | ↑ | ↑ | ↑ J E (i.e. at low pHi values, KO of AE3 enhances J E under Ctrl conditions). Hypothesis: ↑ NHE1 (see Fig. 4 B and D conclusion) slightly overcompensates for ↓ NBCe1 activity in Ctrl (see Fig. 2 C and E conclusion no. 2). |
| Fig. 6 A and C (astrocyte‐only cultures) | (pHi)Ctrl | None | None | Presence of neurons is required for KO of AE3 to modify acid–base status in astrocytes (compare with Fig. 2 C and E conclusions). |
| Fig. 6 A and D (astrocyte‐only cultures) | (dpHi/dt)early (rate of pHi decrease during transition Ctrl → MAc) | None | None | Presence of neurons is required (compare with Fig. 2 C, G and I conclusions). |
| Fig. 6 A and E (astrocyte‐only cultures) | (dpHi/dt)late (rate of pHi downward drift during last several mins of MAc) | None | None | Presence of neurons is required (compare with Fig. 2 C and K conclusions). |
| Fig. 6 A and G (astrocyte‐only cultures) | (dpHi/dt)final (rate of pHi increase during transition MAc → Ctrl) | None | None | Presence of neurons is required (compare with Fig. 3 C and G conclusions). |
| Fig. 6 A and H (astrocyte‐only cultures) | (pHi)final (steady‐state pHi after MAc removal) | None | None | Presence of neurons is required (compare with Fig. 3 C and K conclusions). |
| Fig. 7 B and J | (∆pHi)Cl removal (pHi drift elicited by Cl– removal under MAc conditions) | ↓ | ↓ | ↓ J E. Hypothesis: ↓ [Cl–]o → ↓ [Cl–]i → ↓ NHE activity, known to be Cl– dependent in other cells. |
KO, knockout.
Communication between neurons and astrocytes
Neuron‐to‐astrocyte and astrocyte‐to‐neuron communications are important for synaptic plasticity and metabolic coupling between the two cell types (Volterra & Meldolesi, 2005). These interactions occur in several forms that differ in the type of the stimulus that the origin cell generates, and the type of the response that the target cell produces.
A well‐studied example of neuron–astrocyte communication is the neuronal release of a transmitter that leads to the astrocytic release of a transmitter. When a neuron releases the neurotransmitter glutamate during synaptic transmission, [Ca2+]i in adjacent astrocytes increases (Porter & McCarthy, 1996) and triggers astrocytes to release gliotransmitters (Paixão & Klein, 2010), such as glutamate itself (Parpura et al. 1994; Bezzi et al. 1998; Parpura & Haydon, 2000; Malarkey & Parpura, 2008), ATP (Guthrie et al. 1999; Lee et al. 2015), or d‐serine (Wolosker et al. 1999; Wolosker, 2006; Horn et al. 2013). Consequently, the presence of these gliotransmitters in the tripartite synapse modulates neuronal synaptic strength.
Another form of communication occurs when neuronal action potentials produce an increase in [K+]o, which in turn leads to the release of a transmitter or a change in metabolic state. An example of transmitter discharge is non‐vesicular GABA release. Here, the rise in [K+]o depolarizes neurons and astrocytes, so that GABA transporters reverse in both cell types and release GABA to the extracellular space, followed by neuronal inhibition (Wu et al. 2001; Song et al. 2013). An example of a K+‐induced altered metabolic state, discussed in more detail in the last section of this paper, is neuronal firing, which raises [K+]o, which in turn leads to a depolarization‐induced alkalization or DIA (Siebens & Boron, 1987 a,b, 1989 a,b) in astrocytes and a parallel acidification of the extracellular fluid, which reduces neuronal excitability (Chesler & Kraig, 1987; Grichtchenko & Chesler, 1994; Pappas & Ransom, 1994; Ransom, 2000; Svichar et al. 2011). In addition, the rise in astrocytic pHi during DIA leads to an increase in [HCO3 –]i that binds to and activates soluble adenylyl cyclase (sAC), to enhance glycogen breakdown, glycolysis and lactate production (Choi et al. 2012). This lactate then shuttles to active neurons to serve as an energy source (Pellerin & Magistretti, 1994).
An additional form of communication between neurons and astrocytes, especially during development, is the direct interaction between membrane proteins. For example, neurons and astrocytes use the Eph–ephrin system, in which an ephrin protein expressed on an astrocyte interacts with an Eph receptor expressed on a neuron, to induce synaptic plasticity (Filosa et al. 2009) and morphological changes (Murai et al. 2003). Another example is the interaction of contactin protein 1 expressed on neurons with the carbonic anhydrase–like domain (CALD) of the receptor protein tyrosine phosphatase ζ (RPTPζ), which is expressed on the surface of astrocytes. Contactins 3−6, also expressed on neurons, interact with the CALD RPTPγ, which is also expressed in neurons (Bouyain & Watkins, 2010), an example of a neuron–neuron interaction. Recent reports suggest that RPTPγ is a CO2/HCO3 – sensor (Boedtkjer et al. 2016; Zhou et al. 2016).
In the present study, we describe a novel variant of neuron–astrocyte communication, in which neuronal AE3 modulates astrocytic pHi regulation (Table 4), perhaps by stimulating NBCe1 and inhibiting NHE1. This interaction requires both AE3 and the presence of neurons. A remaining question is how does this communication occur? One might speculate that neuronal AE3 interacts directly with an astrocytic membrane protein that in turn regulates NBCe1 and NHE1 in astrocytes. Another possibility is that the presence or activity of AE3 in neurons indirectly leads to the expression or modification of a surface protein, or to the release of a soluble substance (e.g. an ion, small molecule, secreted protein, membrane‐protein fragment) or an exosome (Koumangoye & Delpire, 2016) that initiates, in astrocytes, downstream signalling pathways that ultimately modulate NBCe1, NHE1, and possibly other acid–base transporters. If the AE3‐dependent signal is a soluble substance, the response in astrocytes must be sufficiently long‐lived that we can observe it even after the transfer of the coverslip from a Petri dish with stationary media to a chamber with continuous flow (a process requiring ∼15 min).
Physiological relevance of AE3 in the function of CA1 neurons and astrocytes
The initial hint that AE3 has a role in the electrical activity of hippocampal neurons was the association of the human polymorphism AE3‐A867D SLC4A3 with idiopathic generalized epilepsy (Sander et al. 2000, 2002). Subsequent studies showed that this polymorphism causes a decrease in the transport activity of human AE3 as expressed in HEK293 cells (Vilas et al. 2009), and the absence of AE3 causes an increase in susceptibility to epilepsy in mice (Hentschke et al. 2006). A plausible explanation could have been that, because AE3 is an acid loader, its knockout would lead to an increase in neuronal pHi, which in turn would increase susceptibility to epilepsy. However, steady‐state pHi in the HC neurons from AE3–/– mice is paradoxically indistinguishable from neurons in WT mice (Hentschke et al. 2006), as confirmed in the present study. An alternative explanation for the pro‐epileptic phenotype associated with diminished AE3 activity might focus on Cl–. For example, is AE3, like the K+/Cl– cotransporter 2 (KCC2), anti‐epileptic because it helps maintain a low [Cl–]i and thereby promotes hyperpolarizing currents through GABA‐ and glycine‐activated Cl– channels? Except during brief periods when pHi is very low (i.e. lowering [HCO3 –]i) or the aforementioned Cl– currents are very high (raising [Cl–]i), AE3 would operate in the direction of Cl– influx. Thus, from the perspective of its Cl– transport, AE3 is usually pro‐epileptic, and the reduction of AE3 function caused by the polymorphism A867D or the knockout of AE3 would be anti‐epileptic. Thus, the mechanism by which AE3 dysfunction promotes epilepsy has remained elusive. The data from the present study lead to explanations for both (1) why pHi does not rise in HC neurons from AE3–/– mice and (2) the pro‐epileptogenic phenotype of the AE3–/– mice.
As far as the unexpectedly low pHi is concerned, we hypothesize that the direct tendency of AE3 to lower pHi because AE3 mediates HCO3 – efflux (neuron in Fig. 8) is approximately balanced by the indirect tendency of AE3 to raise pHi because AE3 mediates Cl– influx, which supports such Cl–‐dependent acid‐extruders as NDCBE and NHE1. Thus, it is not unreasonable to find that the knockout of AE3 fails to cause a significant increase in pHi.
Figure 8. Model of neuron–astrocyte crosstalk, based on acid–base‐related events.

Schematic model of a hypothesis describing the role of AE3 in crosstalk between a neuron (left) and an astrocyte (right). The white numerals on black squares describe the postulated sequence of events.
Regarding the pro‐epileptic phenotype in the intact brain and in slices, we suggest a model based on two levels of crosstalk between neurons and astrocytes. When a neuron fires action potentials (Fig. 8, step 1), the release of K+ from the neuron (step 2) causes an increase in [K+]o that depolarizes adjacent astrocytes (step 3). This depolarization increases the driving force for the electrogenic NBCe1 (step 4) and thus results in the increased uptake of HCO3 –, that is, a DIA (step 5a). Accompanying this intracellular alkalization is an extracellular acidification (i.e. MAc; step 5b), which in turn inhibits neuronal ion channels (step 6a), such as voltage‐gated Na+ channels (Tombaugh & Somjen, 1996), NMDA receptors (Tang et al. 1990) and glutamate receptors (Traynelis et al. 2010), and puts a brake on neuronal activity. Steps 1–6a have been proposed by others (Chesler & Kraig, 1987; Grichtchenko & Chesler, 1994; Ransom, 2000; Svichar et al. 2011). We extend this model by proposing that MAc also stimulates AE3 (step 6b), which lowers [HCO3 –]i and thus pHi in the neuron (step 7a) and also stimulates acid extruders (step 7b). We also propose that the presence of AE3 in neurons somehow increases the functional activity of NBCe1 in astrocytes (step 8), the net effect of which will be to accentuate the action‐potential–induced DIA and MAc, and thereby enhance the brake put on neuronal firing. Thus, the knockout of AE3 would reduce the stimulation of NBCe1 in astrocytes, reduce the negative feedback on neuronal firing, and thus reduce the threshold for triggering an epileptic seizure.
Additional information
Competing interests
None declared.
Author contributions
A.I.S. contributed to the conception and design of the research; performed the experiments, analysed the data, prepared the figures, and wrote the first draft of the manuscript; and contributed to the interpretation of the results, and to the revision of the manuscript. C.A.H. contributed to the interpretation of the data, and to the critical revision of the manuscript. W.F.B. contributed to the conception and design of the research, the interpreted results, and to the revision of the manuscript. All authors approved the final version of the manuscript and agree to be accountable for all aspects of the work. All persons designated as authors qualify for authorship, and all those who qualify for authorship are listed. Experiments were carried out at Case Western Reserve University, Cleveland OH, USA.
Funding
This work was supported by NIH grants NS18400 (W.F.B.), P01‐613 HD032573 (PI: Gabriel G. Haddad, Project 2: W.F.B.) and NIH grant T32 HL 007913 (PI: Kingman Strohl, supports: A.I.S.).
Supporting information
Disclaimer: Supporting information has been peer‐reviewed but not copyedited.
Supplementary Figs S1–10. Alternative approaches for analysing pHi trajectories for all cells in a particular data set. These analyses include: (1) plots of dpHi/dt vs. pHi, and (2) plots of exponential rate constants vs. (pHi)Ctrl.
Acknowledgements
We thank Dale E. Huffman for technical and computer support. We also thank Gerald T. Babcock and Thomas S. Radford for their help with the mouse colonies. We acknowledge the assistance of G.T.B. in his role as laboratory manager. We thank Mark D. Parker, Rossana Occhipinti, Vernon A. Ruffin and Fraser J. Moss for their helpful discussions. We thank Nathan Morris for his help in the statistical analysis. W.F.B. gratefully acknowledges the support of the Myers/Scarpa endowed chair.
This is an Editor's Choice article from the 1 January 2017 issue.
References
- Aharonovitz O, Kapus A, Szászi K, Coady‐Osberg N, Jancelewicz T, Orlowski J & Grinstein S (2001). Modulation of Na+/H+ exchange activity by Cl− . Am J Physiol Cell Physiol 281, C133–C141. [DOI] [PubMed] [Google Scholar]
- Alper SL (2009). Molecular physiology and genetics of Na+‐independent SLC4 anion exchangers. J Exp Biol 212, 1672–1683. [DOI] [PMC free article] [PubMed] [Google Scholar]
- Alper SL & Sharma AK (2013). The SLC26 gene family of anion transporters and channels. Mol Aspects Med 34, 494–515. [DOI] [PMC free article] [PubMed] [Google Scholar]
- Arroyo JP, Kahle KT & Gamba G (2013). The SLC12 family of electroneutral cation‐coupled chloride cotransporters. Mol Aspects Med 34, 288–298. [DOI] [PubMed] [Google Scholar]
- Bergeron MJ, Gagnon E, Wallendorff B, Lapointe J‐Y & Isenring P (2003). Ammonium transport and pH regulation by K‐Cl cotransporters. Am J Physiol Renal Physiol 285, F68–F78. [DOI] [PubMed] [Google Scholar]
- Bevensee MO, Apkon M & Boron WF (1997. a). Intracellular pH regulation in cultured astrocytes from rat hippocampus. II. Electrogenic Na/HCO3 cotransport. J Gen Physiol 110, 467–483. [DOI] [PMC free article] [PubMed] [Google Scholar]
- Bevensee MO, Weed RA & Boron WF (1997. b). Intracellular pH regulation in cultured astrocytes from rat hippocampus. I. Role of HCO3 − . J Gen Physiol 110, 453–465. [DOI] [PMC free article] [PubMed] [Google Scholar]
- Bevensee MO, Bashi E, Schlue WR, Boyarsky G & Boron WF (1999). Shrinkage‐induced activation of Na+/H+ exchange in rat renal mesangial cells. Am J Physiol 276, C674–C683. [DOI] [PubMed] [Google Scholar]
- Bevensee MO & Boron WF (2008). Effects of acute hypoxia on intracellular‐pH regulation in astrocytes cultured from rat hippocampus. Brain Res 1193, 143–152. [DOI] [PMC free article] [PubMed] [Google Scholar]
- Bevensee MO & Boron WF (2013). Control of intracellular pH In Seldin and Giebisch's The Kidney: Physiology and Pathophysiology, 5th edn, ed. Alpern RJ, Caplan MJ. & Moe OW, pp. 1773–1835. Academic Press. [Google Scholar]
- Bevensee MO, Cummins TR, Haddad GG, Boron WF & Boyarsky G (1996). pH regulation in single CA1 neurons acutely isolated from the hippocampi of immature and mature rats. J Physiol 494, 315–328. [DOI] [PMC free article] [PubMed] [Google Scholar]
- Bevensee MO, Schmitt BM, Choi I, Romero MF & Boron WF (2000). An electrogenic Na+‐HCO3 − cotransporter (NBC) with a novel COOH‐terminus, cloned from rat brain. Am J Physiol Cell Physiol 278, C1200–C1211. [DOI] [PubMed] [Google Scholar]
- Bevensee MO, Schwiening CJ & Boron WF (1995). Use of BCECF and propidium iodide to assess membrane integrity of acutely isolated CA1 neurons from rat hippocampus. J Neurosci Methods 58, 61–75. [DOI] [PubMed] [Google Scholar]
- Bezzi P, Carmignoto G, Pasti L, Vesce S, Rossi D, Rizzini BL, Pozzan T & Volterra A (1998). Prostaglandins stimulate calcium‐dependent glutamate release in astrocytes. Nature 391, 281–285. [DOI] [PubMed] [Google Scholar]
- Boedtkjer E, Hansen KB, Boedtkjer DM, Aalkjaer C & Boron WF (2016). Extracellular HCO3 − is sensed by mouse cerebral arteries: Regulation of tone by receptor protein tyrosine phosphatase γ. J Cereb Blood Flow Metab 36, 965–980. [DOI] [PMC free article] [PubMed] [Google Scholar]
- Boron WF (2004). Regulation of intracellular pH. Adv Physiol Educ 28, 160–179. [DOI] [PubMed] [Google Scholar]
- Boron WF & Boulpaep EL (1983). Intracellular pH regulation in the renal proximal tubule of the salamander. Basolateral HCO3 − transport. J Gen Physiol 81, 53–94. [DOI] [PMC free article] [PubMed] [Google Scholar]
- Boron WF & De Weer P (1976). Intracellular pH transients in squid giant axons caused by CO2, NH3, and metabolic inhibitors. J Gen Physiol 67, 91–112. [DOI] [PMC free article] [PubMed] [Google Scholar]
- Boron WF & Russell JM (1983). Stoichiometry and ion dependencies of the intracellular‐pH‐regulating mechanism in squid giant axons. J Gen Physiol 81, 373–399. [DOI] [PMC free article] [PubMed] [Google Scholar]
- Bouyain S & Watkins DJ (2010). Identification of tyrosine phosphatase ligands for contactin cell adhesion molecules. Commun Integr Biol 3, 284–286. [DOI] [PMC free article] [PubMed] [Google Scholar]
- Bouyer P, Bradley SR, Zhao J, Wang W, Richerson GB & Boron WF (2004). Effect of extracellular acid–base disturbances on the intracellular pH of neurones cultured from rat medullary raphe or hippocampus. J Physiol 559, 85–101. [DOI] [PMC free article] [PubMed] [Google Scholar]
- Boyarsky G, Ganz MB, Sterzel RB & Boron WF (1988). pH regulation in single glomerular mesangial cells. I. Acid extrusion in absence and presence of HCO3 − . Am J Physiol 255, C844–C856. [DOI] [PubMed] [Google Scholar]
- Busa WB (1986). Mechanisms and consequences of pH‐mediated cell regulation. Annu Rev Physiol 48, 389–402. [DOI] [PubMed] [Google Scholar]
- Busa WB & Nuccitelli R (1984). Metabolic regulation via intracellular pH. Am J Physiol Regul Integr Comp Physiol 246, R409–R438. [DOI] [PubMed] [Google Scholar]
- Chesler M (2003). Regulation and modulation of pH in the brain. Physiol Rev 83, 1183–1221. [DOI] [PubMed] [Google Scholar]
- Chesler M & Kraig RP (1987). Intracellular pH of astrocytes increases rapidly with cortical stimulation. Am J Physiol Regul Integr Comp Physiol 253, R666–R670. [DOI] [PMC free article] [PubMed] [Google Scholar]
- Choi HB, Gordon GRJ, Zhou N, Tai C, Rungta RL, Martinez J, Milner TA, Ryu JK, McLarnon JG, Tresguerres M, Levin LR, Buck J & MacVicar BA (2012). Metabolic communication between astrocytes and neurons via bicarbonate‐responsive soluble adenylyl cyclase. Neuron 75, 1094–1104. [DOI] [PMC free article] [PubMed] [Google Scholar]
- Coley AA, Ruffin VA, Moss FJ, Hopfer U & Boron WF (2013). Immunocytochemical identification of electroneutral Na+‐coupled transporters in freshly dissociated mouse medullary raphé neurons. Neuroscience 246, 451–467. [DOI] [PMC free article] [PubMed] [Google Scholar]
- Davis BA, Hogan EM & Boron WF (1994). Shrinkage‐induced activation of Na+‐H+ exchange in barnacle muscle fibers. Am J Physiol Cell Physiol 266, C1744–C1753. [DOI] [PubMed] [Google Scholar]
- DeCoursey TE (2013). Voltage‐gated proton channels: molecular biology, physiology, and pathophysiology of the HV family. Physiol Rev 93, 599–652. [DOI] [PMC free article] [PubMed] [Google Scholar]
- Donowitz M, Ming Tse C & Fuster D (2013). SLC9/NHE gene family, a plasma membrane and organellar family of Na+/H+ exchangers. Mol Aspects Med 34, 236–251. [DOI] [PMC free article] [PubMed] [Google Scholar]
- Du F, Qian ZM, Zhu L, Wu XM, Qian C, Chan R & Ke Y (2010). Purity, cell viability, expression of GFAP and bystin in astrocytes cultured by different procedures. J Cell Biochem 109, 30–37. [DOI] [PubMed] [Google Scholar]
- Filosa A, Paixão S, Honsek SD, Carmona MA, Becker L, Feddersen B, Gaitanos L, Rudhard Y, Schoepfer R, Klopstock T, Kullander K, Rose CR, Pasquale EB & Klein R (2009). Neuron‐glia communication via EphA4/ephrin‐A3 modulates LTP through glial glutamate transport. Nat Neurosci 12, 1285–1292. [DOI] [PMC free article] [PubMed] [Google Scholar]
- Friedman JE & Haddad GG (1994). Anoxia induces an increase in intracellular sodium in rat central neurons in vitro. Brain Res 663, 329–334. [DOI] [PubMed] [Google Scholar]
- Gagnon KB & Delpire E (2013). Physiology of SLC12 transporters: lessons from inherited human genetic mutations and genetically engineered mouse knockouts. Am J Physiol Cell Physiol 304, C693–C714. [DOI] [PMC free article] [PubMed] [Google Scholar]
- Giffard RG, Papadopoulos MC, van Hooft JA, Xu L, Giuffrida R & Monyer H (2000). The electrogenic sodium bicarbonate cotransporter: developmental expression in rat brain and possible role in acid vulnerability. J Neurosci 20, 1001–1008. [DOI] [PMC free article] [PubMed] [Google Scholar]
- Grichtchenko II & Chesler M (1994). Depolarization‐induced acid secretion in gliotic hippocampal slices. Neuroscience 62, 1057–1070. [DOI] [PubMed] [Google Scholar]
- Guthrie PB, Knappenberger J, Segal M, Bennett MVL, Charles AC & Kater SB (1999). ATP released from astrocytes mediates glial calcium waves. J Neurosci 19, 520–528. [DOI] [PMC free article] [PubMed] [Google Scholar]
- Halestrap AP (2013). The SLC16 gene family – Structure, role and regulation in health and disease. Mol Aspects Med 34, 337–349. [DOI] [PubMed] [Google Scholar]
- Hara M, Inoue M, Yasukura T, Ohnishi S & Inagaki C (1993). Spatial diversity of chloride transporters in hippocampal neurons. Ann N Y Acad Sci 707, 421–423. [DOI] [PubMed] [Google Scholar]
- Heitzmann D, Warth R, Bleich M, Henger A, Nitschke R & Greger R (2000). Regulation of the Na‐2Cl‐K cotransporter in isolated rat colon crypts. Pflugers Arch 439, 378–384. [DOI] [PubMed] [Google Scholar]
- Hentschke M, Wiemann M, Hentschke S, Kurth I, Hermans‐Borgmeyer I, Seidenbecher T, Jentsch TJ, Gal A & Hübner CA (2006). Mice with a targeted disruption of the Cl−/HCO3 − exchanger AE3 display a reduced seizure threshold. Mol Cell Biol 26, 182–191. [DOI] [PMC free article] [PubMed] [Google Scholar]
- Hogan EM, Davis BA & Boron WF (1997). Intracellular Cl− dependence of Na‐H exchange in barnacle muscle fibers under normotonic and hypertonic conditions. J Gen Physiol 110, 629–639. [DOI] [PMC free article] [PubMed] [Google Scholar]
- Horn MRV, Sild M & Ruthazer ES (2013). d‐serine as a gliotransmitter and its roles in brain development and disease. Front Cell Neurosci 7, 39. [DOI] [PMC free article] [PubMed] [Google Scholar]
- Hubner CA & Holthoff K (2013). Anion transport and GABA signaling. Front Cell Neurosci 7, 177. [DOI] [PMC free article] [PubMed] [Google Scholar]
- Kaila K, Price TJ, Payne JA, Puskarjov M & Voipio J (2014). Cation‐chloride cotransporters in neuronal development, plasticity and disease. Nat Rev Neurosci 15, 637–654. [DOI] [PMC free article] [PubMed] [Google Scholar]
- Khirug S, Huttu K, Ludwig A, Smirnov S, Voipio J, Rivera C, Kaila K & Khiroug L (2005). Distinct properties of functional KCC2 expression in immature mouse hippocampal neurons in culture and in acute slices. Eur J Neurosci 21, 899–904. [DOI] [PubMed] [Google Scholar]
- Khirug S, Yamada J, Afzalov R, Voipio J, Khiroug L & Kaila K (2008). GABAergic depolarization of the axon initial segment in cortical principal neurons is caused by the Na–K–2Cl cotransporter NKCC1. J Neurosci 28, 4635–4639. [DOI] [PMC free article] [PubMed] [Google Scholar]
- Kopito RR, Lee BS, Simmons DM, Lindsey AE, Morgans CW & Schneider K (1989). Regulation of intracellular pH by a neuronal homolog of the erythrocyte anion exchanger. Cell 59, 927–937. [DOI] [PubMed] [Google Scholar]
- Koumangoye R & Delpire E (2016). The Ste20 kinases SPAK and OSR1 travel between cells through exosomes. Am J Physiol Cell Physiol 311, C43–C53. [DOI] [PMC free article] [PubMed] [Google Scholar]
- Lee J, Chun Y‐E, Han K‐S, Lee J, Woo DH & Lee CJ (2015). Ca2+ entry is required for mechanical stimulation‐induced ATP release from astrocyte. Exp Neurobiol 24, 17–23. [DOI] [PMC free article] [PubMed] [Google Scholar]
- Liu X, Titz S, Lewen A & Misgeld U (2003). KCC2 mediates NH4 + uptake in cultured rat brain neurons. J Neurophysiol 90, 2785–2790. [DOI] [PubMed] [Google Scholar]
- Ma E & Haddad GG (1997). Expression and localization of Na+/H+ exchangers in rat central nervous system. Neuroscience 79, 591–603. [DOI] [PubMed] [Google Scholar]
- McKhann GM, D'Ambrosio R & Janigro D (1997). Heterogeneity of astrocyte resting membrane potentials and intercellular coupling revealed by whole‐cell and gramicidin‐perforated patch recordings from cultured neocortical and hippocampal slice astrocytes. J Neurosci 17, 6850–6863. [DOI] [PMC free article] [PubMed] [Google Scholar]
- Magistretti PJ & Ransom BR (2002). Astrocytes In Neuropsychopharmacology – 5th Generation of Progress, Chapter 10, 5th edn, ed. Davis KL, Charney D, Coyle JT. & Nemeroff C. Lippincott Williams & Wilkins; Available at: http://www.acnp.org/publications/neuro5thgeneration.aspx. [Google Scholar]
- Majumdar D, Maunsbach AB, Shacka JJ, Williams JB, Berger UV, Schultz KP, Harkins LE, Boron WF, Roth KA & Bevensee MO (2008). Localization of electrogenic Na/bicarbonate cotransporter NBCe1 variants in rat brain. Neuroscience 155, 818–832. [DOI] [PMC free article] [PubMed] [Google Scholar]
- Malarkey EB & Parpura V (2008). Mechanisms of glutamate release from astrocytes. Neurochem Int 52, 142–154. [DOI] [PMC free article] [PubMed] [Google Scholar]
- Markova O, Mukhtarov M, Real E, Jacob Y & Bregestovski P (2008). Genetically encoded chloride indicator with improved sensitivity. J Neurosci Methods 170, 67–76. [DOI] [PubMed] [Google Scholar]
- Murai KK, Nguyen LN, Irie F, Yamaguchi Y & Pasquale EB (2003). Control of hippocampal dendritic spine morphology through ephrin‐A3/EphA4 signaling. Nat Neurosci 6, 153–160. [DOI] [PubMed] [Google Scholar]
- Murata Y, Sun‐Wada G‐H, Yoshimizu T, Yamamoto A, Wada Y & Futai M (2002). Differential localization of the vacuolar H+ pump with G subunit isoforms (G1 and G2) in mouse neurons. J Biol Chem 277, 36296–36303. [DOI] [PubMed] [Google Scholar]
- Paixão S & Klein R (2010). Neuron–astrocyte communication and synaptic plasticity. Curr Opin Neurobiol 20, 466–473. [DOI] [PubMed] [Google Scholar]
- Pappas CA & Ransom BR (1993). A depolarization‐stimulated, bafilomycin‐inhibitable H+ pump in hippocampal astrocytes. Glia 9, 280–291. [DOI] [PubMed] [Google Scholar]
- Pappas CA & Ransom BR (1994). Depolarization‐induced alkalinization (DIA) in rat hippocampal astrocytes. J Neurophysiol 72, 2816–2826. [DOI] [PubMed] [Google Scholar]
- Parker JC (1983). Volume‐responsive sodium movements in dog red blood cells. Am J Physiol 244, C324–C330. [DOI] [PubMed] [Google Scholar]
- Parker MD & Boron WF (2013). The divergence, actions, roles, and relatives of sodium‐coupled bicarbonate transporters. Physiol Rev 93, 803–959. [DOI] [PMC free article] [PubMed] [Google Scholar]
- Parker MD, Musa‐Aziz R, Rojas JD, Choi I, Daly CM & Boron WF (2008). Characterization of human SLC4A10 as an electroneutral Na/HCO3 cotransporter (NBCn2) with Cl− self‐exchange activity. J Biol Chem 283, 12777–12788. [DOI] [PMC free article] [PubMed] [Google Scholar]
- Parpura V, Basarsky TA, Liu F, Jeftinija K, Jeftinija S & Haydon PG (1994). Glutamate‐mediated astrocyte–neuron signalling. Nature 369, 744–747. [DOI] [PubMed] [Google Scholar]
- Parpura V & Haydon PG (2000). Physiological astrocytic calcium levels stimulate glutamate release to modulate adjacent neurons. Proc Natl Acad Sci USA 97, 8629–8634. [DOI] [PMC free article] [PubMed] [Google Scholar]
- Pellerin L & Magistretti PJ (1994). Glutamate uptake into astrocytes stimulates aerobic glycolysis: a mechanism coupling neuronal activity to glucose utilization. Proc Natl Acad Sci USA 91, 10625–10629. [DOI] [PMC free article] [PubMed] [Google Scholar]
- Pierre K, Pellerin L, Debernardi R, Riederer BM & Magistretti PJ (2000). Cell‐specific localization of monocarboxylate transporters, MCT1 and MCT2, in the adult mouse brain revealed by double immunohistochemical labeling and confocal microscopy. Neuroscience 100, 617–627. [DOI] [PubMed] [Google Scholar]
- Porter JT & McCarthy KD (1996). Hippocampal astrocytes in situ respond to glutamate released from synaptic terminals. J Neurosci 16, 5073–5081. [DOI] [PMC free article] [PubMed] [Google Scholar]
- Putnam RW, Filosa JA & Ritucci NA (2004). Cellular mechanisms involved in CO2 and acid signaling in chemosensitive neurons. Am J Physiol Cell Physiol 287, C1493–C1526. [DOI] [PubMed] [Google Scholar]
- Rajendran VM, Geibel J & Binder HJ (1995). Chloride‐dependent Na‐H exchange. A novel mechanism of sodium transport in colonic crypts. J Biol Chem 270, 11051–11054. [DOI] [PubMed] [Google Scholar]
- Rajendran VM, Geibel J & Binder HJ (1999). Role of Cl channels in Cl‐dependent Na/H exchange. Am J Physiol Gastrointest Liver Physiol 276, G73–G78. [DOI] [PubMed] [Google Scholar]
- Ransom BR (2000). Glial modulation of neural excitability mediated by extracellular pH: a hypothesis revisited. Prog Brain Res 125, 217–228. [DOI] [PubMed] [Google Scholar]
- Ritucci NA, Chambers‐Kersh L, Dean JB & Putnam RW (1998). Intracellular pH regulation in neurons from chemosensitive and nonchemosensitive areas of the medulla. Am J Physiol 275, R1152–R1163. [DOI] [PubMed] [Google Scholar]
- Romero MF, Chen A‐P, Parker MD & Boron WF (2013). The SLC4 family of bicarbonate (HCO₃−) transporters. Mol Aspects Med 34, 159–182. [DOI] [PMC free article] [PubMed] [Google Scholar]
- Romero MF, Hediger MA, Boulpaep EL & Boron WF (1997). Expression cloning and characterization of a renal electrogenic Na+/HCO3 − cotransporter. Nature 387, 409–413. [DOI] [PubMed] [Google Scholar]
- Roos A & Boron WF (1981). Intracellular pH. Physiol Rev 61, 296–434. [DOI] [PubMed] [Google Scholar]
- Rose CR & Ransom BR (1996). Intracellular sodium homeostasis in rat hippocampal astrocytes. J Physiol 491, 291–305. [DOI] [PMC free article] [PubMed] [Google Scholar]
- Rose CR & Ransom BR (1997). Regulation of intracellular sodium in cultured rat hippocampal neurones. J Physiol 499, 573–587. [DOI] [PMC free article] [PubMed] [Google Scholar]
- Russell JM & Boron WF (1976). Role of choloride transport in regulation of intracellular pH. Nature 264, 73–74. [DOI] [PubMed] [Google Scholar]
- Salameh AI, Ruffin VA & Boron WF (2014). Effects of metabolic acidosis on intracellular pH responses in multiple cell types. Am J Physiol Regul Integr Comp Physiol 307, R1413–R1427. [DOI] [PMC free article] [PubMed] [Google Scholar]
- Sander T, Schulz H, Saar K, Gennaro E, Riggio MC, Bianchi A, Zara F, Luna D, Bulteau C, Kaminska A, Ville D, Cieuta C, Picard F, Prud'homme JF, Bate L, Sundquist A, Gardiner RM, Janssen GA, de Haan GJ, Kasteleijn‐Nolst‐Trenité DG, Bader A, Lindhout D, Riess O, Wienker TF, Janz D & Reis A (2000). Genome search for susceptibility loci of common idiopathic generalised epilepsies. Hum Mol Genet 9, 1465–1472. [DOI] [PubMed] [Google Scholar]
- Sander T, Toliat MR, Heils A, Leschik G, Becker C, Rüschendorf F, Rohde K, Mundlos S & Nürnberg P (2002). Association of the 867Asp variant of the human anion exchanger 3 gene with common subtypes of idiopathic generalized epilepsy. Epilepsy Res 51, 249–255. [DOI] [PubMed] [Google Scholar]
- Sardet C, Franchi A & Pouysségur J (1989). Molecular cloning, primary structure, and expression of the human growth factor‐activatable Na+/H+ antiporter. Cell 56, 271–280. [DOI] [PubMed] [Google Scholar]
- Schmitt BM, Berger UV, Douglas RM, Bevensee MO, Hediger MA, Haddad GG & Boron WF (2000). Na/HCO3 cotransporters in rat brain: expression in glia, neurons, and choroid plexus. J Neurosci 20, 6839–6848. [DOI] [PMC free article] [PubMed] [Google Scholar]
- Schwiening CJ & Boron WF (1994). Regulation of intracellular pH in pyramidal neurones from the rat hippocampus by Na+‐dependent Cl−–HCO3 − exchange. J Physiol 475, 59–67. [DOI] [PMC free article] [PubMed] [Google Scholar]
- Siebens A & Boron W (1987. a). Luminal and basolateral transport mechanisms involved in depolarization‐induced alkalinization in ambystoma proximal tubules. Kidney Int 31, 415 (http://www.kidney-international.org/article/S0085-2538(15)33884-9/pdf). [Google Scholar]
- Siebens AW & Boron WF (1987. b). Effect of electroneutral luminal and basolateral lactate transport on intracellular pH in salamander proximal tubules. J Gen Physiol 90, 799–831. [DOI] [PMC free article] [PubMed] [Google Scholar]
- Siebens AW & Boron WF (1989. a). Depolarization‐induced alkalinization in proximal tubules. I. Characteristics and dependence on Na+ . Am J Physiol 256, F342–F353. [DOI] [PubMed] [Google Scholar]
- Siebens AW & Boron WF (1989. b). Depolarization‐induced alkalinization in proximal tubules. II. Effects of lactate and SITS. Am J Physiol 256, F354–F365. [DOI] [PubMed] [Google Scholar]
- Song I, Volynski K, Brenner T, Ushkaryov Y, Walker M & Semyanov A (2013). Different transporter systems regulate extracellular GABA from vesicular and non‐vesicular sources. Front Cell Neurosci 7, 23. [DOI] [PMC free article] [PubMed] [Google Scholar]
- Svichar N, Esquenazi S, Chen H‐Y & Chesler M (2011). Preemptive regulation of intracellular pH in hippocampal neurons by a dual mechanism of depolarization‐induced alkalinization. J Neurosci 31, 6997–7004. [DOI] [PMC free article] [PubMed] [Google Scholar]
- Svichar N, Waheed A, Sly WS, Hennings JC, Hübner CA & Chesler M (2009). Carbonic anhydrases CA4 and CA14 both enhance AE3‐mediated Cl−‐HCO3 − exchange in hippocampal neurons. J Neurosci 29, 3252–3258. [DOI] [PMC free article] [PubMed] [Google Scholar]
- Tang CM, Dichter M & Morad M (1990). Modulation of the N‐methyl‐d‐aspartate channel by extracellular H+ . Proc Natl Acad Sci USA 87, 6445–6449. [DOI] [PMC free article] [PubMed] [Google Scholar]
- Theparambil SM, Naoshin Z, Thyssen A & Deitmer JW (2015). Reversed electrogenic sodium bicarbonate cotransporter 1 is the major acid loader during recovery from cytosolic alkalosis in mouse cortical astrocytes. J Physiol 593, 3533–3547. [DOI] [PMC free article] [PubMed] [Google Scholar]
- Thomas JA, Buchsbaum RN, Zimniak A & Racker E (1979). Intracellular pH measurements in Ehrlich ascites tumor cells utilizing spectroscopic probes generated in situ. Biochemistry (Mosc) 18, 2210–2218. [DOI] [PubMed] [Google Scholar]
- Tombaugh GC & Somjen GG (1996). Effects of extracellular pH on voltage‐gated Na+, K+ and Ca2+ currents in isolated rat CA1 neurons. J Physiol 493, 719–732. [DOI] [PMC free article] [PubMed] [Google Scholar]
- Traynelis SF, Wollmuth LP, McBain CJ, Menniti FS, Vance KM, Ogden KK, Hansen KB, Yuan H, Myers SJ & Dingledine R (2010). Glutamate receptor ion channels: structure, regulation, and function. Pharmacol Rev 62, 405–496. [DOI] [PMC free article] [PubMed] [Google Scholar]
- Vaughan‐Jones RD, Spitzer KW & Swietach P (2009). Intracellular pH regulation in heart. J Mol Cell Cardiol 46, 318–331. [DOI] [PubMed] [Google Scholar]
- Vilas GL, Johnson DE, Freund P & Casey JR (2009). Characterization of an epilepsy‐associated variant of the human Cl−/HCO3 − exchanger AE3. Am J Physiol Cell Physiol 297, C526‐C536. [DOI] [PubMed] [Google Scholar]
- Volterra A & Meldolesi J (2005). Astrocytes, from brain glue to communication elements: the revolution continues. Nat Rev Neurosci 6, 626–640. [DOI] [PubMed] [Google Scholar]
- Wang W, Bradley SR & Richerson GB (2002). Quantification of the response of rat medullary raphe neurones to independent changes in pHo and . J Physiol 540, 951–970. [DOI] [PMC free article] [PubMed] [Google Scholar]
- Williams JR & Payne JA (2004). Cation transport by the neuronal K‐Cl cotransporter KCC2: thermodynamics and kinetics of alternate transport modes. Am J Physiol Cell Physiol 287, C919–C931. [DOI] [PubMed] [Google Scholar]
- Wolosker H (2006). D‐Serine regulation of NMDA receptor activity. Sci STKE 2006, pe41. [DOI] [PubMed] [Google Scholar]
- Wolosker H, Sheth KN, Takahashi M, Mothet J‐P, Brady RO, Ferris CD & Snyder SH (1999). Purification of serine racemase: Biosynthesis of the neuromodulator d‐serine. Proc Natl Acad Sci USA 96, 721–725. [DOI] [PMC free article] [PubMed] [Google Scholar]
- Wu L‐J, Wu G, Sharif MRA, Baker A, Jia Y, Fahey FH, Luo HR, Feener EP & Clapham DE (2012). The voltage‐gated proton channel Hv1 enhances brain damage from ischemic stroke. Nat Neurosci 15, 565–573. [DOI] [PMC free article] [PubMed] [Google Scholar]
- Wu Y, Wang W & Richerson GB (2001). GABA transaminase inhibition induces spontaneous and enhances depolarization‐evoked GABA efflux via reversal of the GABA transporter. J Neurosci 21, 2630–2639. [DOI] [PMC free article] [PubMed] [Google Scholar]
- Zhou Y, Skelton L, Xu L, Chandler P, Berthiaume J & Boron WF (2016). Role of receptor protein tyrosine phosphatase γ in sensing extracellular CO2 and HCO3 − J Am Soc Nephrol (in press; DOI: 10.1681/ASN.2015040439). [DOI] [PMC free article] [PubMed] [Google Scholar]
Associated Data
This section collects any data citations, data availability statements, or supplementary materials included in this article.
Supplementary Materials
Disclaimer: Supporting information has been peer‐reviewed but not copyedited.
Supplementary Figs S1–10. Alternative approaches for analysing pHi trajectories for all cells in a particular data set. These analyses include: (1) plots of dpHi/dt vs. pHi, and (2) plots of exponential rate constants vs. (pHi)Ctrl.