

Abstract
Key points
Neurons in the medial nucleus of the trapezoid body of anaesthetized rats of postnatal day (P)2–6 showed burst firing with a preferred interval of about 100 ms, which was stable, and a second preferred interval of 5–30 ms, which shortened during development.
In 3 out of 132 cases, evidence for the presence of two large inputs was found.
In vivo whole‐cell recordings revealed that the excitability of the principal neuron and the size of its largest synaptic inputs were developmentally matched.
At P2–4, action potentials were triggered by barrages of small synaptic events that summated to plateau potentials, while at later stages firing depended on a single, large and often prespike‐associated input, which is probably the nascent calyx of Held.
Simulations with a Hodgkin–Huxley‐like model, which was based on fits of the intrinsic postsynaptic properties, suggested an essential role for the low‐threshold potassium conductance in this transition.
Abstract
In the adult, principal neurons of the medial nucleus of the trapezoid body (MNTB) are typically contacted by a single, giant terminal called the calyx of Held, whereas during early development a principal neuron receives inputs from many axons. How these changes in innervation impact the postsynaptic activity has not yet been studied in vivo. We therefore recorded spontaneous inputs and intrinsic properties of principal neurons in anaesthetized rat pups during the developmental period in which the calyx forms. A characteristic bursting pattern could already be observed at postnatal day (P)2, before formation of the calyx. At this age, action potentials (APs) were triggered by barrages of summating EPSPs causing plateau depolarizations. In contrast, at P5, a single EPSP reliably triggered APs, resulting in a close match between pre‐ and postsynaptic firing. Postsynaptic excitability and the size of the largest synaptic events were developmentally matched. The developmental changes in intrinsic properties were estimated by fitting in vivo current injections to a Hodgkin–Huxley‐type model of the principal neuron. Our simulations indicated that the developmental increases in I h, low‐threshold K+ channels and leak currents contributed to the reduction in postsynaptic excitability, but that low‐threshold K+ channels specifically functioned as a dampening influence in the near‐threshold range, thus precluding small inputs from triggering APs. Together, these coincident changes help to propagate bursting activity along the auditory brainstem, and are essential steps towards establishing the relay function of the calyx of Held synapse.
Keywords: excitability, synapse formation, response homeostasis
Key points
Neurons in the medial nucleus of the trapezoid body of anaesthetized rats of postnatal day (P)2–6 showed burst firing with a preferred interval of about 100 ms, which was stable, and a second preferred interval of 5–30 ms, which shortened during development.
In 3 out of 132 cases, evidence for the presence of two large inputs was found.
In vivo whole‐cell recordings revealed that the excitability of the principal neuron and the size of its largest synaptic inputs were developmentally matched.
At P2–4, action potentials were triggered by barrages of small synaptic events that summated to plateau potentials, while at later stages firing depended on a single, large and often prespike‐associated input, which is probably the nascent calyx of Held.
Simulations with a Hodgkin–Huxley‐like model, which was based on fits of the intrinsic postsynaptic properties, suggested an essential role for the low‐threshold potassium conductance in this transition.
Abbreviations
- AP
action potential
- CC
current clamp
- Cm
membrane capacitance
- eAP
extracellularly recorded action potential
- eEPSP
extracellularly recorded EPSP
- EPSP0
the EPSP that directly preceded an AP
- HH‐model
Hodgkin–Huxley‐like model
- HTK
high‐threshold potassium
- IAPthr
AP threshold current
- Ih
hyperpolarization‐activated cation current
- ISI
interspike interval
- LTK
low‐threshold potassium
- MNTB
medial nucleus of the trapezoid body
- P
postnatal
- RMP
resting membrane potential
- syn
synaptic
- VC
voltage clamp
- VGlut
vesicular glutamate transporter
Introduction
The calyx of Held synapse is a giant synapse in the auditory brainstem that relays incoming activity with high accuracy to the principal neuron of the contralateral medial nucleus of the trapezoid body (MNTB; Borst & Soria van Hoeve, 2012). The MNTB provides well‐timed inhibition to its ipsilateral auditory brainstem nuclei, which plays a role in among others sound localization. In newborn rodents the principal neuron is contacted by multiple axons, indicating that innervation is initially divergent, followed by the formation of the (proto)calyx at around P3 (Morest, 1968; Kandler & Friauf, 1993; Kil et al. 1995; Rodríguez‐Contreras et al. 2008; Holcomb et al. 2013 b). It is well established that a single globular bushy cell can form multiple calyces (Held, 1893; Kuwabara et al. 1991; Rodríguez‐Contreras et al. 2006). Conversely, there is anecdotal evidence that a single principal neuron can be contacted by more than one calyx (Wimmer et al. 2004; Rodríguez‐Contreras et al. 2006; Holcomb et al. 2013 b), and that a principal neuron can receive multiple large inputs during development (Bergsman et al. 2004; Hoffpauir et al. 2006), but otherwise the role of synapse competition and elimination in the development of the calyx of Held synapse remains largely unresolved. Current evidence indicates that in the adult each principal neuron will typically be innervated by a single calyx of Held (Morest, 1968; Kandler & Friauf, 1993; Nakamura & Cramer, 2011). Several factors make the calyx of Held a valuable model system for synapse development in the CNS, including the homogeneity of the MNTB, relative ease of identification of the principal neurons, its well‐defined function, and its accessibility both in vitro and in vivo. The calyx of Held thus shares many advantages with the neuromuscular junction as a model system for developmental studies, but comparatively little is known about calyceal synapse development.
Before hearing onset, principal neurons of the MNTB show bursting activity (Sonntag et al. 2009), which has a characteristic pattern that originates from the inner hair cells in the cochlea (Tritsch et al. 2010; Johnson et al. 2011; Sendin et al. 2014). The exact temporal pattern of this bursting activity is thought to be crucial for the establishment of precise tonotopy (Clause et al. 2014). Direct comparison of the pre‐ and postsynaptic activity indicated that the calyx is already reliably driving its postsynaptic partner after P4 (Crins et al. 2011). In contrast, little is known about spontaneous inputs before that period and their impact on principal neurons. Slice studies have shown that principal neurons are hyperexcitable during the first postnatal days (Hoffpauir et al. 2010; Rusu & Borst, 2011). The high membrane resistance, which was measured to be in the GΩ range, allows small synaptic currents to elicit an action potential (AP). As the calyx develops structurally, the principal neuron's membrane resistance decreases, thereby reducing its excitability (Hoffpauir et al. 2010; Rusu & Borst, 2011).
Within this developmental period, many ion channels are upregulated that could be responsible for this reduction in excitability (Hoffpauir et al. 2010; Ehmann et al. 2013; Kolson et al. 2016), including the low‐threshold K+ channels Kv1, hyperpolarization‐activated cation channels I h and leak channels (Leao et al. 2005; Berntson & Walmsley, 2008; Gao & Lu, 2008). Around the same time, auditory neurons switch from tonic to phasic firing in both rodents (Hoffpauir et al. 2010) and birds (Gao & Lu, 2008; Kuenzel et al. 2009), and the low‐threshold K+ channels may play an important role in this change (Brew & Forsythe, 1995; Peusner et al. 1998; Dodson et al. 2002; Johnston et al. 2010). Together, these slice experiments suggest a developmental switch in firing mode and excitability around the time the calyx of Held develops in rodents.
It is not yet known how changes in intrinsic properties of principal neurons relate to the large changes in the spontaneous physiological inputs around the time the calyx of Held forms and how this impacts firing patterns. We therefore made in vivo juxtacellular and whole‐cell recordings from principal MNTB neurons to measure their spiking activity in vivo, their intrinsic properties, the incoming synaptic activity and the postsynaptic responses in postnatal day (P)2–6 rat pups. A Hodgkin–Huxley‐type model allowed us to investigate the distinct roles of NMDA receptors, low‐threshold K+ channels, I h and the leak conductance in the measured developmental changes in the input–output relations of principal neurons, thus identifying essential steps towards the establishment of the adult relay synapse.
Methods
Ethical approval
All experimental procedures were in accordance with European legislation and approved by the Dutch Animal Ethics Committee of the Erasmus MC. The investigators declare that the reported experiments complied with the journal's ethical principles and their animal ethics checklist. Wistar dams (Harlan, Horst, The Netherlands) were given ad libitum access to food and water, and extra bedding material was provided. The day of birth was taken as P0.
Animal procedures
Two‐ to 6‐day‐old pups of either sex were anaesthetized with 2–3% isoflurane (Pharmachemie BV, Haarlem, The Netherlands) vaporized in medical oxygen (0.4–0.6 l min−1) and placed in supine position. The surgical procedures are described by Rodríguez‐Contreras et al. (2008) with some minor adjustments. Briefly, throughout the surgery the skin temperature was monitored dorsally and kept at 36°C by a heating pad (FHC Inc., Bowdoin, ME, USA). When the pup became unresponsive to a toe pinch, it was intubated with micro‐renathane tubing [OD x ID (mm), P2: 0.64×0.30, >P2: 0.84×0.36; Braintree Scientific, Inc., Braintree, MA, USA) and mechanically ventilated with a MicroVent (7 μl μg−1 + dead volume, 100 min−1; Hugo Sachs Elektronik ‐ Harvard Apparatus GmbH, March‐Hugstetten, Germany). The larynx, oesophagus and the dorsal tissue were removed to expose the skull in which a small cranial window (1.5×1.5 mm) was made to expose the basilar artery and the left and right anterior–inferior cerebellar artery. The upper cranial meninges overlying the MNTB were gently torn away.
The animal surgery took 45–90 min followed by a recovery phase of 30 min and the experimental phase. Within the recovery and experimental phase anaesthesia was kept at a level that adequately kept the animal unresponsive to a toe pinch (0.7–1.3% isoflurane). Pilot data suggested that surgical levels of anaesthesia suppressed the spontaneous bursting activity, but that the range of anaesthesia levels used during the recordings had no obvious effects on activity. To prevent dehydration, the animal was given intraperitoneal saline injections (30–80 μl every 2 h). The craniotomy was kept moist with Ringer's solution containing (in mm): 135 NaCl, 5.4 KCl, 1 MgCl2, 1.8 CaCl2, 5 Hepes with pH 7.2 adjusted with NaOH. After the experimental phase (2–8 h) the animal was deeply anaesthetized followed by either decapitation or transcardial perfusion with cold saline followed by cold phosphate‐buffered 4% paraformaldehyde to fix the brain for further histological procedures.
Electrophysiology
Borosilicate capillaries with filament (OD 1.50 mm, ID 0.87 mm, no. 1403574, Hilgenberg GmbH, Malsfeld, Germany) were pulled to long tapered pipettes (ID 1–1.5 μm) on a P‐97 Flaming/Brown micropipette puller (Sutter Instrument Co., Novato, CA, USA). Pipettes were filled with intracellular solution containing (in mm): 126 potassium gluconate, 20 KCl, 0.5 EGTA, 10 Hepes, 10 Na2phosphocreatine, 4 Mg‐ATP, 0.4 Na2‐GTP with pH 7.2 adjusted with KOH. The pipettes were mounted on a headstage that could be moved within a custom‐made setup in three dimensions by micromanipulators (Mini 25 with SM‐7, Luigs & Neumann, Ratingen, Germany). The headstage (CV 203BU, Molecular Devices Co., Sunnyvale, CA, USA) was connected to an Axopatch 200B amplifier (Molecular Devices Co.); signals were low‐pass filtered with a 4‐pole Bessel filter at 10 kHz, subsequently digitized at 25 kHz by an A/D converter (Digidata 1440A, Molecular Devices Co.) and acquired with Clampex 10.2 (Molecular Devices Co.) running on a Windows XP computer.
When the animal's body temperature was stabilized at 37°C, we started the experimental phase. The medial region of the brainstem, >200 μm rostral and >300 μm lateral from the bifurcation of the anterior–inferior cerebellar artery and the basilar artery, was probed for bursting activity by juxtacellular recordings. Pilot experiments indicated that postsynaptic firing frequency did not depend on isoflurane level, except for a depression at surgical levels. When bursting activity was found, a clean pipette was lowered for the whole‐cell recordings. We compensated for the −11 mV junction potential and stray pipette capacitance. Upon break‐in, the resting membrane potential (RMP) was noted, and passive properties of the neuron were estimated in voltage‐clamp (VC) mode based on 30–50 repetitions of a step from −70 to −75 mV. This was repeated between every recording to monitor the series resistance over time. Series resistance was on average 45.0 ± 1.3 MΩ (8–35% of total resistance; n = 60 cells) and remained uncompensated. In current clamp (CC), a series of constant current injections was used to estimate the voltage dependence of the membrane resistance, with the first step hyperpolarizing the cell to at least −100 mV, incrementing to current injections of at least +300 pA. Every step was repeated at least twice. Spontaneous activity recordings of at least 7 min duration were obtained, either in VC mode at a holding potential of −80 mV to minimize potassium and chloride currents, or in CC mode, or both if time permitted.
To confirm that we recorded from a principal neuron of the MNTB we used both histological and electrophysiological criteria. For histological verification either biocytin was added to the intracellular solution (2 mg ml−1) for further histological procedures, or Evans Blue was injected at the recorded location and, following decapitation, acute slices were made and checked under fluorescence for the injection site. In addition, the presence of a prespike was considered evidence that the recording was from the MNTB. All recordings near a verified recording site were also accepted. Reported recordings met at least one of these criteria.
Immunofluorescence
After perfusion the brain was carefully removed from the skull. Histological procedures were based on the free floating method, as described by Soria van Hoeve & Borst (2010) with minor modifications. Briefly, 25–40 μm coronal sections were cut on a freezing microtome and captured in 0.1 m phosphate‐buffered solution. When convenient, the sections were stored overnight at 4°C. Presynaptic terminals were stained with anti‐vesicular glutamate transporter (VGlut) 1 and 2 (guinea pig, 1:2000, polyclonal #ab5905 and #ab2251, EMD Millipore Corp., Temecula, CA, USA) and highly cross‐absorbed secondary antibodies produced in goat conjugated to AlexaFluor‐555 against guinea pig (1:200; Thermo Fisher Scientific, Waltham, MA, USA). Streptavidin conjugated to AlexaFluor‐488 (1:200, Thermo Fisher Scientific) was used to stain biocytin. Sytox Blue (1:1000, Thermo Fisher Scientific) was used to stain both the nucleus and, more weakly, the somatic cytoplasm. Sections were mounted and stored at 4°C until image acquisition; to prevent evaporation, glass edges were sealed with nail polish.
Image acquisition and processing
A Zeiss confocal microscope (LSM 700, Axio Imager Z2, Oberkochen, Germany), equipped with four diode lasers at 405, 488, 555 and 639 nm was used to acquire overview and z‐stack images of the immunostainings. The z‐stacks (1024×1024 pixels, voxel size was 310×310×500 nm) were obtained with a 40×/1.3 NA oil‐immersion plan‐apochromat objective with optimized pin hole settings, laser power and detector gain settings.
For three‐dimensional reconstruction the biocytin‐stained structure was automatically detected with the ‘Particle Analyser (3D)’ plugin of ImageJ with a manually set threshold. The particle analyser often returned multiple detected structures of which the experimenter chose the relevant structure to create a mask, which was used to restrict the fluorescent signals to the relevant structure plus its immediate 1 μm vicinity. Enlargement of the mask was performed using ‘Dilate (3D)’ (plugin: 3D Binary Filters, author: Benjamin Schmid). Images were background subtracted after masking. These masked images were imported into Volocity (Improvision, Coventry, UK) to render the z‐stacks of the neurons in three dimensions.
Analysis of electrophysiological recordings
The recordings were imported into Igor Pro 6.34A (WaveMetrics, Inc., Lake Oswego, OR, USA) and analysed by custom‐made functions. From the voltage clamp (VC) step recordings, series resistance was calculated as the applied voltage step amplitude divided by the peak current amplitude; membrane resistance was obtained by dividing the applied voltage step amplitude by the steady state current amplitude and subtracting the series resistance; membrane capacitance was calculated by the following equation, which takes into account the voltage drop across the series resistance:
| (1) |
where C m denotes membrane capacitance; It is the recorded current in VC, which is integrated from the peak current to a steady‐state current after 10 ms; I ss is steady‐state current; and V step is the applied voltage step of 5 mV.
A detection algorithm for spontaneous events was developed based on Ankri et al. (1994). EPSPs or EPSCs were detected based on two criteria: a maximum in the rate of rise (green circles in Fig. 3 E) that was above a manually set threshold (∼0.5 V s−1) and the existence of an event onset, which was defined as a preceding local maximum in the second derivative (blue circles in Fig. 3 E). This detection method was particularly sensitive to summing EPSPs, but often missed events on the falling phase of an AP or of big events. The event peak was detected as a local maximum in the original recording or, in the case of event summation, as the onset of the next event. Prespikes were detected together with the other events and subsequently categorized based on three threshold criteria set by the experimenter: rate of rise, rate of repolarization and amplitude in the original trace. If the onset of an event was detected within a prespike, the onset value of the prespike was used instead as the onset value of the event. EPSPs preceding an AP were subcategorized as preceding the first AP of a miniburst, with the miniburst defined as an AP preceded by an interspike interval of more than 40 ms and succeeded by a second AP within 40 ms (see Fig. 3 D). APs were detected by a simple manually set voltage threshold crossing; AP threshold was defined as the potential at which the second time derivative had its maximum.
Figure 3. Action potentials are typically triggered in vivo by summation of small EPSPs at P2 and by a single, strong input at P4 or older.
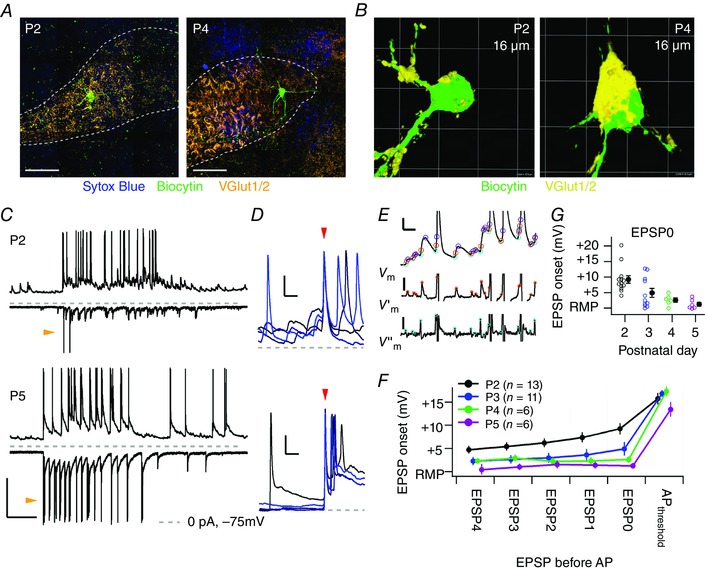
A, immunofluorescent stainings of the MNTB at P2 (left) and at P4 (right). Dotted line, MNTB borders; blue, nucleotide stain Sytox Blue; green, biocytin; orange, glutamate vesicle marker VGlut1/2. Scale bar = 50 μm. Ventral is to the bottom and medial is to the left. B, three‐dimensional reconstructions of biocytin‐stained neurons with nearby VGlut1/2 staining. C, example whole‐cell recordings from a principal neuron at P2 (top panel) and P5 (bottom panel) showing a period of increased activity; current‐clamp recordings (CC, top traces) show EPSPs and APs; voltage‐clamp recordings (VC, bottom traces) show EPSCs and, especially at P5, voltage‐clamp escaping action currents (orange arrowheads). Broken lines mark 0 pA for the VC recording and the −75 mV level for the CC recording. Bar = 30 mV, 500 pA and 500 ms. D, four example traces (colour‐coded) aligned on the first AP of a miniburst (red arrowhead) show the prelude to a miniburst at P2 (above) and P5 (below). At P2, multiple EPSPs summated to reach the AP threshold, whereas at P5 no summation was seen. Calibration bars = 10 mV, 10 ms. Grey dashed line marks the resting membrane potential of the recorded neuron. E, overview of the detection method based on the rate of rise. In the upper trace the CC recording with EPSPs and truncated APs obtained from a P2 pup is shown; the middle trace is the first time derivative of the CC recording; the lower trace is the second time derivative of the CC recording. Orange circles indicate the maximum rate of rise of the EPSP; light blue circles indicate the EPSP onset; purple circles indicate the EPSP peak. Calibration bars = 5 mV and 10 ms (top); 5 V s−1 (middle); 8 V s–2 (below). F, average onset membrane potential of the EPSPs preceding the first AP of the miniburst is plotted against the order number of the EPSP preceding the AP; EPSP0 is the EPSP reaching the AP threshold, EPSP1 the EPSP preceding EPSP0, etc. The membrane potentials are plotted relative to the resting membrane potential (RMP). Data points have been horizontally offset for display purposes. G, developmental changes in the average onset membrane potential of the EPSP directly preceding the first AP of the miniburst (EPSP0). The averages (filled circles with SEM) are also shown in F. [Colour figure can be viewed at wileyonlinelibrary.com]
Juxtacellular recordings were digitally high‐pass filtered at 1 Hz for visual purposes and analysed similarly as the spontaneous recordings; in juxtacellular recordings, prespikes were detected within 20 ms preceding either an eAP or an eEPSP to reduce spurious detection.
The high series resistances in our in vivo VC recordings resulted in an imperfect VC and an underestimation of the real currents (Williams & Mitchell, 2008). To partially correct for these errors we applied an off‐line software‐based deconvolution algorithm that takes capacitive filtering into account (Traynelis, 1998), which used the membrane capacitance as calculated in eqn (1). To reduce the noise after deconvolution, the VC recording was low‐pass filtered with a digital binomial filter at a cut‐off frequency of 0.6 kHz. This correction had a major impact on the fast peak component (see Fig. 4 A and B, blue traces), and EPSC amplitude increased about five times on average (range: 2.8–18.4; Fig. 4 G). The deconvolved amplitudes of the largest EPSCs were in the same range as the amplitudes of well‐clamped EPSCs recorded in slices at the same developmental age (Chuhma & Ohmori, 1998; Hoffpauir et al. 2010).
Figure 4. Emergence of a large input during development.
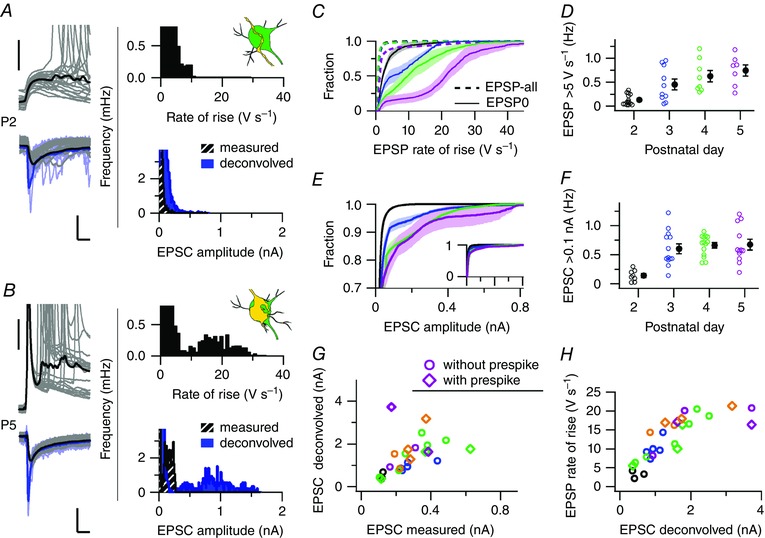
A, in a P2 principal neuron 20 EPSPs in CC (upper left) and 20 EPSCs in VC (lower left, grey), and the average big EPSP (black) and EPSC (black) aligned on the onset. VC recordings were deconvolved off‐line for capacitive filtering. The same EPSCs after deconvolution (light blue) and the average deconvolved EPSC (blue) are shown. Bars = 20 mV (upper), and 200 pA and 5 ms (lower). Upper right panel, the frequency distribution of EPSP rate of rise; lower right panel, the frequency distribution of EPSC amplitude. B, as A for a P5 principal neuron, illustrating the appearance of a separate population of large EPSPs and EPSCs. Bars as in A. C, averaged cumulative distributions of the maximal rate of rise of all EPSPs (dotted line) and the AP‐triggering EPSP (EPSP0, line) at the different ages (colour‐coded). A population of large EPSPs (>5 V s−1) emerges during development. Colours correspond to the age as in D. D, the frequency of large EPSPs (>5 V s−1) against postnatal day. E, truncated averaged cumulative distributions of the EPSC amplitude of different postnatal days (colour‐coded). Similar to C, large inputs (>100 pA) appeared during development. EPSCs were not deconvolved. Inset: the entire distributions with the same range of EPSC amplitudes. F, developmental increase in the frequency of large EPSCs (>100 pA). G, EPSC amplitudes before and after deconvolution. The data points are derived from a defined population of EPSCs based on either their rate of rise or the presence of a prespike. The deconvolution retrieved the fast peak of the EPSC, as shown in A and B. Circles are the large EPSCs, diamonds are the prespike‐related EPSCs. Colours correspond to age as in D and F, orange is P6. H, deconvolved EPSC amplitude against the rate of rise of the EPSP recorded from the same principal neuron. The two measures correlated almost linearly. Colours as in G. Open circles are single data points, filled circles are averages with SEM. [Colour figure can be viewed at wileyonlinelibrary.com]
The constant‐current injection recordings were corrected off‐line for the voltage drop over the series resistance and elicited APs were detected as before. AP half width was defined as the width halfway between the AP threshold and peak. The first APs elicited by the current injections were visually inspected to check their waveform. Steady‐state membrane potential values were defined as the median membrane potential from 500 to 600 ms after the start of current injections; values were rejected if there were multiple APs within this time period or if the median value was > −30 mV.
The Hodgkin–Huxley‐like model of a principal MNTB neuron
The Hodgkin–Huxley‐like model (HH‐model) was based on previous models of the MNTB neuron (Macica et al. 2003; Leao et al. 2005). Briefly, the model could be described by:
| (2) |
where C m is the membrane capacitance; dV/dt represents the change of the membrane potential; Il eak is the leak current, I Na is the sodium current; ILTK is the low‐threshold potassium current; I HTK is the high‐threshold potassium current; I h is the hyperpolarization‐activated current; I syn is the synaptic current obtained from the VC recordings; and I inj is the injected current. Except for I syn and I inj, the currents were described by the following equation:
| (3) |
where g max represents the maximal conductance; a is the activation rate; λ is the number of subunits to activate; γ represents the fraction of the total conductance that can inactivate; b is the inactivation rate; and V rev represents the reversal potential for current x. Values for these parameters are given in Table 2. The temporal change in subunit a and b was described by the following differential equation:
| (4) |
where s corresponds to subunit‐type h, l, m, n, p or u. For each subunit the voltage dependency of the rate constants was:
| (5) |
| (6) |
Table 2.
Conductance parameters for the Hodgkin–Huxley model
| I leak | I Na | I LTK | I HTK | I h | |
|---|---|---|---|---|---|
| a | 1 | m | l | n | u |
| b | – | h | – | P | – |
| λ | 1 | 3 | 3 | 3 | 1 |
| γ | 0 | 1 | 0 | 0.2 | 0 |
| V rev (mV) | −72 | 50 | −80 | −80 | −45 |
The constants Cα, kα, Cβ and kβ are listed in Table 1 and the relationship to the currents are given in Table 2. Differential equations were solved with Gear Method/Backwards Differentiation Formula implemented in Igor Pro 6.34A (function IntegrateODE).
Table 1.
Values of the subunit kinetics
To fit the steady‐state potentials of the CC steps, the equilibrium value for every subunit was calculated from:
| (7) |
The equilibrium values were used to fit the steady‐state potentials with V rev,leak, g leak, g LTK and g Ih as fitting variables to obtain their maximal conductance as a function of age. g Na and g HTK were excluded from the fits; their estimates were matched with AP properties as described in the Results (Fig. 9).
Figure 9. The Hodgkin–Huxley model reproduced the in vivo intrinsic properties of the principal neuron.
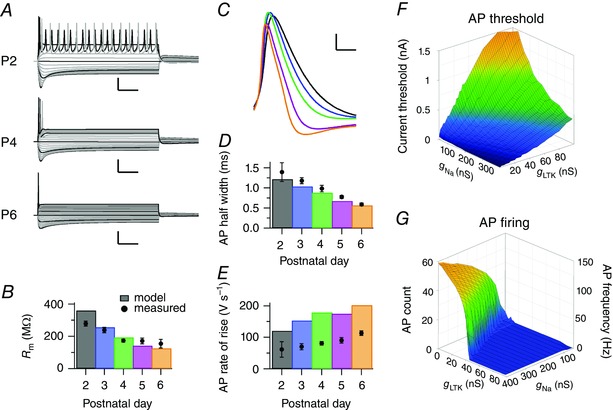
A, simulations for current injections using the standard model neuron for P2 (P2, top), P4 (P4, middle) and P6 (bottom). The first simulated current injection was at −200 pA; grey steps are incremental current injections of Δ20 pA; black steps of Δ100 pA. Calibration bars = 25 mV and 100 ms. B, bars, the developmental changes in membrane resistance according to the simulations, which were calculated from the steady‐state conductances at −70 to −75 mV; circles, average in vivo membrane resistance with SEM. C, average simulated AP waveforms of the first current‐injection elicited APs reveal similar developmental changes as in vivo (cf. Fig. 6 B). Calibration bars = 10 mV and 2 ms; colours correspond to age as in B. D, comparison of measured (filled circles) and simulated (bars) AP half widths shows similar developmental shortening. E, as D, except maximal rate of rise of the AP. F, relationship between g Na and g LTK and the minimum current injection needed to elicit an AP. Colours correspond to injected current. G, relationship between g Na and g LTK and AP frequency or number of evoked APs per 400 ms; g leak, g HTK and g Ih were kept constant at 2.5, 100 and 25 nS, respectively. Colours correspond to AP count; the blue plateau indicates one AP. [Colour figure can be viewed at wileyonlinelibrary.com]
For the synaptic conductance the reversal potential was set at 0 mV and the time course of I syn was based on the in vivo recordings after deconvolution using the algorithm described by Traynelis (1998). This could be done for a few stable recordings with low series resistance (< 35 MΩ) and with few clamp‐escaping APs. Prior to the deconvolution, the few clamp‐escaping APs were replaced by resized EPSCs derived from the same trace. Generally, the resized EPSC nicely overlaid the measured EPSC in the period before it was obscured by a clamp‐escaping AP. The deconvolved recording was used to calculate the synaptic conductance as:
| (8) |
where V h is −80 mV and V rev is 0 mV. Finally, the deconvolved recordings were linearly detrended.
The RMP was set at −70 mV in the model by current injection to facilitate the comparison between the different ages. Without the current injection, there was a trend that the RMP of the standard model neurons became slightly more negative with age (−67 mV for the P2 vs. −72 mV for the P6 standard model neuron). We corrected the measured C m in eqn (1) for the dendrite‐related capacitance with a factor of 0.6, yielding about 30 pF.
The model EPSC was composed of an AMPA and an NMDA conductance:
| (9) |
| (10) |
where Mg denotes the magnesium block which depended on the membrane potential as described by Steinert et al. (2010). Both g AMPA and g NMDA were described by a three state model composed of one opening state and two closing states:
| (11) |
Here, gx stands for the conductance of x, and x can be either AMPA or NMDA; κ is a scaling factor, which was 1 and 1.9 for AMPA and NMDA, respectively (Taschenberger & von Gersdorff, 2000; Hoffpauir et al. 2006); I peak is the EPSC amplitude as would be recorded in VC mode; V h and V rev are the holding and reversal potential, here 0 and −80 mV for both AMPA and NMDA; S open denotes the open state; S close,fast is the closing state with a fast decay time; γ denotes the relative fraction of fast closing state, set to 0.923 (Borst et al. 1995) and 0.778 (Steinert et al. 2010) for AMPA and NMDA, respectively; and S close,slow denotes the closing state with the slow decay time. The states followed the following equation:
| (12) |
| (13) |
where t is the time in ms; τrise is the opening time constant which was 0.15 and 0.8 ms; τdecay,fast was 1.05 and 25 ms; and τdecay,slow was 14.1 and 100 ms for AMPA and NMDA, respectively (Borst et al. 1995; Taschenberger & von Gersdorff, 2000; Steinert et al. 2010). NMDA currents were delayed by 3.03 ms to be comparable with Steinert et al. (2010).
In the simulations for which VC recordings were used as input, the NMDA conductance associated with each EPSC was calculated using eqn (11). These were summed to get the total NMDA conductance.
Statistical analysis
Values are reported as mean and SEM. Statistical significance was calculated by regression with every postnatal day as an independent variable. For frequencies, χ2 tests were performed. To assess the HH‐model fit, an F‐test for comparing nested models was done for every fitting parameter against the simpler model with P < 0.1 suggesting an improvement in the fit. The reduction of sums‐of‐squares is reported as a percentage. A linear regression model was used with the threshold current for evoking an AP as the outcome variable and the conductances g LTK, g leak and g Ih as predictors. The values of the conductances were determined with the HH‐model fit, and if a conductance did not make a significant contribution in the HH‐model fit, it was set to zero for the linear regression model. The slope values of the conductances in the regression model are reported, and their significance was tested with a post hoc t‐test. The impact of NMDA conductance was tested by a repeated‐measures ANOVA with neuron as the nesting variable, and ‘in vivo recording’, ‘model with g NMDA’ and ‘model without g NMDA’ as predictor variables. Post hoc paired t‐tests were used to assess the significance of the predictor variables. Post hoc testing was corrected with Bonferroni's method. Except for the fit improvement, P < 0.05 was considered significant.
Results
Juxtacellular bursting activity
An important feature of developing auditory nuclei is their bursting activity (Wang & Bergles, 2015). As early as P5, a characteristic bursting pattern has been observed at the MNTB (Tritsch et al. 2010). To investigate the developmental changes in this bursting pattern, we made in vivo juxtacellular recordings from rat pups aged P2–5 using a ventral approach (Fig. 1 A). Within this developmental period, the calyx of Held synapse forms, and the innervation of the principal neurons evolves from a divergent projection with conventional boutons at P2 to, typically, a single, very large, axosomatic synapse at P5 (Fig. 1 B; Kandler & Friauf, 1993; Hoffpauir et al. 2006; Rodríguez‐Contreras et al. 2008; Borst & Soria van Hoeve, 2012). At P2–5, periods of bursting activity could already be detected, and, typically, the recordings showed long periods of no activity (up to tens of seconds) followed by a period of increased activity (burst) that had two preferred firing frequencies at about 10 and 100 Hz, corresponding to interspike intervals of about 100 and 10 ms, respectively (Fig. 1 C–E). We will refer to the ∼100 Hz activity as miniburst, and define it as a sequence of APs with interspike intervals <40 ms. The interspike interval of 100 ms was remarkably consistent throughout development, in agreement with earlier work (Tritsch et al. 2010; Crins et al. 2011), whereas the miniburst interval clearly shortened (Fig. 1 D and E; P2: 20.0 ± 1.7 ms, P3: 13.4 ± 0.8 ms, P4: 10.4 ± 0.9 ms, P5: 8.9 ± 1.1 ms, F 3,67 = 18.4, P = 7 × 10⁻⁹), and the fraction of all intervals that were miniburst intervals increased (Fig. 1 F; P2: 26.6 ± 2.9%, P3: 38.0 ± 2.5%, P4: 42.9 ± 3.4%, P5: 46.5 ± 2.9%, F 3,67 = 8.3, P = 1 × 10⁻⁴). We conclude that a principal neuron can display its characteristic, pre‐hearing, bursting activity as early as P2.
Figure 1. Developmental changes in characteristic bursting pattern.
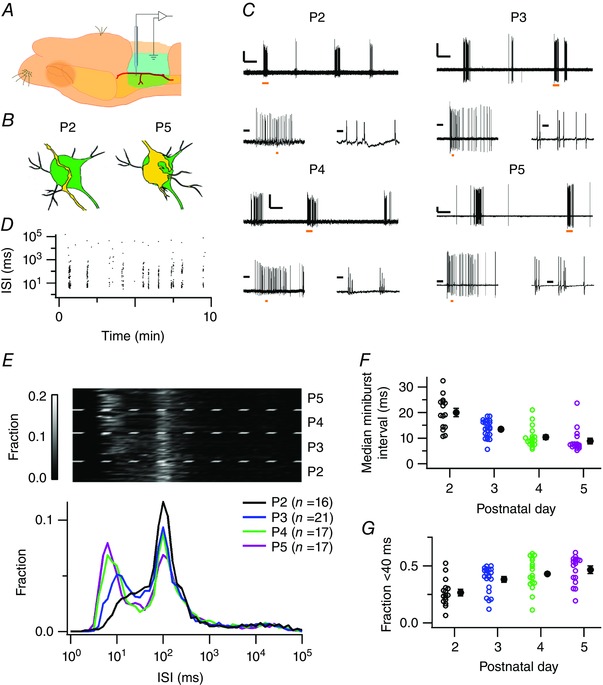
A, illustration of the experimental approach. The MNTB is ventrally approached for electrophysiological recordings, using the origin of the bifurcation of the anterior–inferior cerebellar artery as a landmark. B, illustration of the structural development of the axon innervating the principal neuron of the MNTB. Left: a P2 principal neuron (green) is innervated by a passing axon (yellow). Right: at P5, the same neuron is covered by a protocalyx. C, four representative juxtacellular recordings obtained at P2–5 showing alternating periods of high activity and silence (upper trace). For each postnatal day, the left lower panel shows a single burst; the right lower panel shows that a burst is composed of minibursts, defined as a period with interspike intervals (ISIs) <40 ms. Orange bars indicate the periods that are expanded in the other panels. Scale bars for each age: 1 mV; upper panel: 10 s; left lower panel: 0.5 s; right lower panel: 20 ms. D, ISI against the time of recording of the P5 example shown in C. E, top: ISIs of individual experiments were logarithmically binned and coded in grey scale. Every horizontal line represents the probability density function of the ISIs of a single recording; the recordings were grouped by pup age, separated by the broken lines. Bottom: probability density functions averaged per postnatal day. While the 100 ms interval was unchanged, the miniburst interval shortened during development. F, median miniburst interval against postnatal day. G, fraction of miniburst intervals against postnatal day. Open circles are single neurons, filled circles are averages with SEM. [Colour figure can be viewed at wileyonlinelibrary.com]
To address the relationship between pre‐ and postsynaptic activity, we took advantage of the juxtacellular recordings in which we observed an extracellularly recorded, clear prespike (Fig. 2 A). Prespikes were observed at P2, P3, P4 and P5 in 2 out of 16, 10 out of 21, 9 out of 17 and 10 out of 17 recordings, respectively, suggesting a developmental increase (χ2 3 = 8.6; P = 0.03). The prespike showed, similar to the postsynaptic activity, preferred intervals at around 100 and 10 ms (n = 21, data not shown). The miniburst interval of the prespike was shorter than the intervals recorded from its postsynaptic target neuron (8.2 ± 0.5 ms; difference: 2.0 ± 0.8 ms; paired t 20 = 2.6, P = 0.02), and did not show a clear developmental shortening (P2: 7 ± 1 ms; P3: 10 ± 1 ms; P4: 9 ± 1 ms; P5: 7 ± 1 ms; r = 0.4), suggesting that the developmental acceleration of the miniburst is due to a developmental change in either synapse strength or the properties of the target neuron. To assess the impact of prespike‐related synapses more comprehensively, we quantified the percentage of prespikes that triggered an extracellularly recorded AP (eAP), which increased developmentally (Fig. 2 C; P2: 34 ± 4%, P3: 66 ± 11%, P4: 75 ± 9%, P5: 87 ± 5%, F 3,20 = 3.8, P = 0.02). Conversely, at P2 most postsynaptic eAPs were not associated with a prespike, while at P5 virtually all eAPs were (Fig. 2 D; P2: 30 ± 10%, P3: 55 ± 9%, P4: 65 ± 13%, P5: 90 ± 2%, F 3,20 = 5.6, P = 0.006). Other developmental changes included the shortening of the prespike–eAP interval (Fig. 2 E; P2: 5.65 ± 0.22 ms, P3: 2.83 ± 0.06 ms, P4: 2.11 ± 0.25 ms, P5: 1.48 ± 0.08 ms; F 3,21 = 52.0, P = 7 × 10⁻¹⁰) and a decrease in its coefficient of variation (SD/mean) (Fig. 2 F; P2: 0.44 ± 0.12, P3: 0.54 ± 0.14, P4: 0.38 ± 0.13, P5: 0.26 ± 0.13; F 3,12 = 3.6, P = 0.04), suggesting a strong developmental increase of the calyceal impact on the activity of its principal neuron.
Figure 2. Increased dependency of postsynaptic activity on a calyceal input in in vivo juxtacellular recordings from P2–5 rat pups.
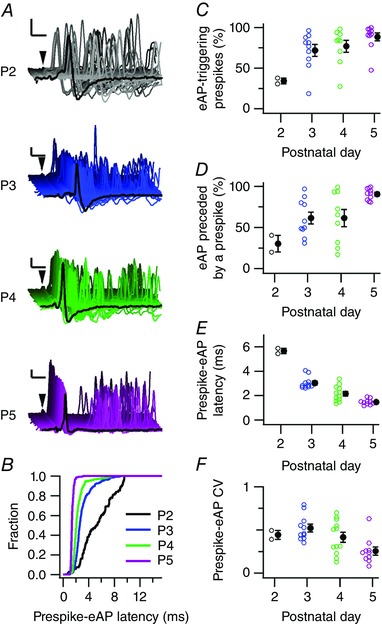
A, waterfall plots of aligned consecutive prespikes (arrowheads) from recordings from P2–5 pups. For each cell all recorded prespikes are shown. The jitter in the delay between prespike and postsynaptic eAP decreased with age. Black trace in front is a representative trace. Calibration bars are 2 ms and 1 mV. B, cumulative fraction of the prespike–eAP intervals of the example recordings in A, illustrating that the prespike interval became shorter and less variable during development. C, developmental increase in the fraction of prespikes that triggered a postsynaptic eAP. D, developmental increase in the fraction of eAPs that were preceded by a prespike. E, developmental decrease in average prespike–eAP latency. F, developmental changes in the coefficient of variation (CV) of the prespike–eAP latency. Open circles in C–F are single data points, filled circles are averages with SEM. [Colour figure can be viewed at wileyonlinelibrary.com]
Synaptic barrages trigger postsynaptic APs before a giant input emerges
The juxtacellular recordings suggested that at the youngest ages studied, many or all of the APs in principal neurons were triggered by multiple, small synapses. To study more directly how APs were triggered at the different postnatal ages, we made in vivo whole‐cell recordings of principal neurons. A few neurons that had been filled with biocytin via the patch pipette were successfully recovered histologically (n = 8 cells from 8 pups). Two examples are shown in Fig. 3 A. Immunocytochemical stainings with VGlut1/2 as a presynaptic marker showed the emergence of an axosomatic synapse between P2 and P4 (Fig. 3 B), in agreement with earlier developmental studies in rat pups (Kandler & Friauf, 1993; Rodríguez‐Contreras et al. 2008; Soria Van Hoeve & Borst, 2010).
If recording time permitted, principal neurons were recorded both in current (CC) and in voltage clamp (VC) (Fig. 3 C). In CC recordings, clear periods of increased activity could be observed at all ages, resulting in postsynaptic AP firing at frequencies similar to what we observed in the juxtacellular recordings. Figure 3 D illustrates that APs were generally triggered quite differently in P2 and in P5 neurons. At P2, small EPSPs summated to reach AP threshold, while at older ages a single EPSP could be sufficiently large to trigger an AP. To quantify how APs were triggered, we employed a custom‐made detection method (Fig. 3 E) to identify the EPSP that preceded the AP, as further detailed in the Methods. At P2, the EPSP that triggered the AP (EPSP0) started from a depolarized potential, while at P5 EPSP0 typically started close to the RMP, especially when we focused on the first AP of a miniburst (Fig. 3 F and G; P2: +9.2 ± 1.2 mV, P3: +4.9 ± 1.5 mV, P4: +2.6 ± 0.7 mV, P5: +1.4 ± 0.7 mV, F 3,31 = 6.7, P = 0.001). AP threshold did not change significantly during development (P2: −45.8 ± 1.6 mV, P3: −46.6 ± 1.1 mV, P4: −46.7 ± 1.7 mV, P5: −49.6 ± 2.3 mV, F 3,31 = 0.8, P = 0.53) and RMP did not change significantly (P2: −67 ± 2 mV, P3: −70 ± 1 mV, P4: −69 ± 2 mV, P5: −69 ± 1 mV, F 3,48 = 1, P = 0.33). Our data thus show that at P2–3, small EPSPs summated to reach AP threshold, while at P5 the largest EPSPs typically triggered postsynaptic APs singlehandedly.
Between P2 and P5 most principal neurons become innervated by a calyx. In the whole‐cell recordings we observed the appearance of a large input in both the CC and the VC mode (Fig. 4 A and B). The fraction of AP‐triggering EPSPs (EPSP0) with a rate of rise above 5 V s−1 increased during development (Fig. 4 C; P2: 0.19 ± 0.06, P3: 0.50 ± 0.10, P4: 0.68 ± 0.09, P5: 0.82 ± 0.08, F 3,32 = 9.5, P = 0.0001). The frequency of large EPSPs increased between P2 and P5 (Fig. 4 D; P2: 0.13 ± 0.03 Hz, P3: 0.45 ± 0.11 Hz, P4: 0.62 ± 0.12 Hz, P5: 0.75 ± 0.12, F 3,36 = 10.4, P = 5 × 10⁻⁵). Similarly, in the VC recordings a population of large EPSCs became progressively more distinct from smaller EPSCs (Fig. 4 E), and the frequency of EPSCs with an amplitude above 100 pA increased strongly as well (Fig. 4 F; P2: 0.14 ± 0.03 Hz, P3: 0.60 ± 0.08 Hz, P4: 0.66 ± 0.05 Hz, P5: 0.67 ± 0.09 Hz, F 3,43 = 9.3, P = 7 × 10⁻⁵). To relate EPSCs to EPSPs, recordings were made in both VC and CC from a total of 23 neurons. Although EPSCs and EPSPs of a single neuron were recorded consecutively, some inputs could be identified in both recordings owing to the bimodal distribution of event amplitudes (Fig. 4 A and B) or the presence of a prespike (data not shown). To take into account the effect of the series resistance on the amplitude of the EPSCs, we employed off‐line deconvolution (Fig. 4 G; see Methods). There was a strong correlation between the deconvolved EPSC amplitude and the rate of rise of the EPSP in the same cell (Fig. 4 H; r = 0.81). In summary, our in vivo evidence indicated that between P2 and P5 a single large input becomes responsible for AP generation in most principal neurons.
Anecdotal evidence for multiple protocalyces
Serial electron microscopy reconstructions of principal neurons showed that multiple large inputs, defined operationally as inputs with an apposed surface area of at least 25 μm2, can form on the same principal neuron during development (Holcomb et al. 2013 b). Their relative physiological impact on the principal neuron is still largely unknown. In principle, whole‐cell recordings do not allow us to unambiguously identify the inputs from different axons. However, in a total of three cells electrophysiological evidence for the presence of multiple large inputs was obtained.
In one P3 and in one P4 whole‐cell recording (2 out of 67), and in one P4 juxtacellular recording (1 out of 65), two types of big events could be distinguished based on the presence or absence of a prespike (Fig. 5 A and B). Single inputs should obey the refractory period, which was estimated to be 0.9 ms in adult mice (Lorteije et al. 2009), but we expect it to be longer in neonatal rats. In the two P4 recordings we found interevent intervals below 3 ms, with the smallest interval at 1.4 ms, while the smallest inter‐prespike interval in any of our recordings was 3.3 ms (Fig. 5 C). Altogether, it seems likely that for these two P4 recordings the two events arose from terminals from distinct globular bushy cells.
Figure 5. Anecdotal evidence for multiple large inputs.
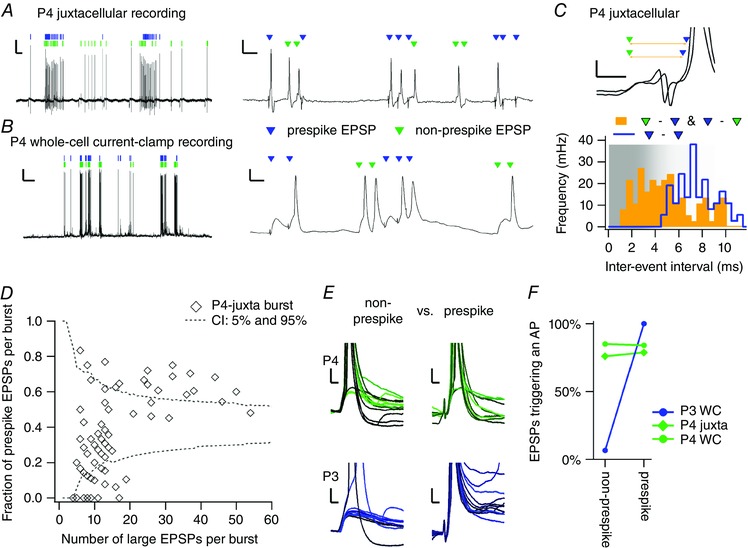
A, juxtacellular recording of a P4 principal neuron with two inputs that often trigger an AP, of which one showed a prespike (blue triangle) and the other did not (green triangle). They were co‐active in the same bursts (left) and in the same miniburst (right). Calibration bars = 2 mV, 500 ms (left panel) and 10 ms (right panel). B, similar to A, but for a whole‐cell recording of a P4 principal neuron. C, two examples from the P4 juxtacellular recording where the non‐prespike‐related EPSP (green) was followed within 3 ms by a prespike‐related EPSP (blue). The yellow line indicates the inter‐event interval. Bars = 1 mV and 1 ms. Bottom, frequency of the inter‐event intervals; orange, intervals between prespike‐related and non‐prespike‐related EPSPs; blue, intervals between prespike‐related EPSPs. The shaded area depicts the intervals that might only be obtained from distinct inputs. D, fraction of prespike‐related EPSPs against the total number of large EPSPs (prespike + non‐prespike) within a single burst recorded from the P4 juxtacellular recording shown in A. Every diamond represents a burst. Dotted line indicates the confidence intervals based on the expected binomial distribution with the number of prespike‐EPSP/all large EPSPs. E, comparison of the synaptic strength of both large inputs. From the two whole‐cell recordings (P3 and P4) examples of the non‐prespike EPSP aligned on the maximal rate of rise (left) and of the prespike EPSP aligned on the prespike (right). In the P4 whole‐cell recording (top panel), both kinds of EPSPs were comparable in size and ability to trigger APs. In contrast, in the P3 whole‐cell example (bottom panel) the prespike‐related EPSPs were bigger and reliably triggered an AP while the non‐prespike EPSPs only rarely did. Bars = 5 mV and 2 ms. F, comparison of the percentage of EPSPs that triggered an AP for non‐prespike and prespike‐related EPSPs. A single line represents a single recording; the P3 whole‐cell recording is indicated with a blue circle, and was illustrated in E; the P4 juxtacellular recording is shown as a green diamond, and is illustrated in A and C; the P4 whole‐cell recording is shown as a green circle, and is illustrated in B and E. [Colour figure can be viewed at wileyonlinelibrary.com]
In the two P4 recordings the two big events came in at preferred intervals, in agreement with an origin from globular bushy cells, and they co‐occurred within a burst, and even in the same miniburst (Fig. 5 A and B). For the juxtacellular recording, a total of 511 prespike‐related EPSPs, recorded extracellularly (eEPSP; 41% of large eEPSPs), were detected against 721 non‐prespike eEPSPs (59 % of large eEPSPs). To quantify their co‐occurrence, the fraction of prespike‐related eEPSPs within each burst was calculated (Fig. 5 D). It seemed that, compared to the predictions of a binomial distribution, prespike‐related eEPSPs dominated in the bursts with >15 large eEPSPs while being sparse in the bursts with fewer large eEPSPs. Nevertheless, in 15 out of the 18 bursts with 4–6 large eEPSPs, at least one prespike‐related eEPSP was present, indicating that the prespike‐related EPSP and the non‐prespike eEPSP co‐occurred regularly. In the P4 whole‐cell recording, every burst contained a prespike‐related EPSP, with 39% of large EPSPs being prespike‐related; in the P3 whole‐cell recording the prespike‐related EPSP clearly dominated, as 337 prespike‐related EPSPs were detected against 31 large, non‐prespike EPSPs (8% of large EPSPs), and these non‐prespike large EPSPs were present in only 11 of 25 bursts. In summary, in the three cells with evidence for multiple large inputs, the prespike‐related and non‐prespike inputs were regularly active together, suggesting a common origin for their activity.
Based on the ultrastructural reconstructions showing multiple large somatic inputs (Holcomb et al. 2013 b), we expected to find prespikes for both large synapses, as the prespike is the electrophysiological hallmark for the presence of a calyx. Moreover, the size of the prespike appears to scale with the surface area of the axon terminal, as we observed in the juxtacellular recordings an increased prespike amplitude during development (data not shown). Hence, two major axosomatic synapses would be expected to result in two distinct prespike waveforms. However, in none of the recordings did we find evidence that the prespikes constituted two different populations, nor did we observe inter‐prespike intervals below 3 ms. Nevertheless, for the two P4 recordings the EPSPs seemed of comparable size and shape as they regularly triggered postsynaptic APs at almost equal probability (Fig. 5 D and E). Only in the P3 whole‐cell recording was the prespike‐related EPSP clearly bigger and stronger than the non‐prespike EPSP (Fig. 5 D and E, blue). Especially in the two P4 recordings, it remained unclear why a prespike was recorded for only one of the large inputs.
Intrinsic properties of the principal neuron
In the adult situation, the principal neuron responds to a calyceal AP with no more than a single AP. To enable its reliability and precision, the principal neuron needs to change its firing properties during development (Borst & Soria van Hoeve, 2012). The in vivo intrinsic properties of principal neurons were investigated by whole‐cell constant‐current injections (Fig. 6 A). At P5–6, even upon strong, depolarizing current injections, we observed only phasic firing by the principal neurons. In contrast, at P2–3, all neurons fired multiple APs in response to current injections (Fig. 6 A and E). The first interspike interval (ISI) shortened (Fig. 6 B and C; P2: 16.8 ± 1.6 ms, P3: 12.6 ± 1.1 ms, P4: 11.4 ± 0.9 ms, P5: 8.9 ± 1.8 ms; F 4,11 = 4.7, P = 0.02), the AP half width was reduced (Fig. 6 D; P2: 1.40 ± 0.23 ms, P3: 1.18 ± 0.08 ms, P4: 0.97 ± 0.06 ms, P5: 0.76 ± 0.04 ms, P6: 0.60 ± 0.02 ms; F 4,22 = 16, P = 3 × 10⁻⁶), and the maximal rate of rise of the first AP increased during development (Fig. 6 F; P2: 62 ± 25 V s−1 , P3: 70 ± 10 V s−1, P4: 95 ± 11 V s−1, P5: 101 ± 15 V s−1, P6: 117 ± 6 V s−1; F 4,22 = 2.9, P = 0.045; Taschenberger & von Gersdorff, 2000; Hoffpauir et al. 2010); these values may be underestimations because of high series resistances. Although the shape of the evoked first AP was quite similar within a principal neuron (Fig. 6 A), the AP waveform was highly variable during spontaneous activity. The APs showed considerable amplitude depression and broadening within minibursts (Figs 3 D and 5 A), to which the synaptic conductances, inactivation of Na+ channels and activation of K+ channels may contribute. The minimal current needed for AP generation increased significantly with age (Fig. 6 E; P2: 90 ± 20 pA, P3: 300 ± 40 pA, P4: 230 ± 30 pA, P5: 420 ± 30 pA, P6: 430 ± 50 pA, F 4,22 = 9.6, P = 0.0001), indicating a developmental decrease in the intrinsic excitability of the principal neuron.
Figure 6. Developmental changes in postsynaptic action potentials.
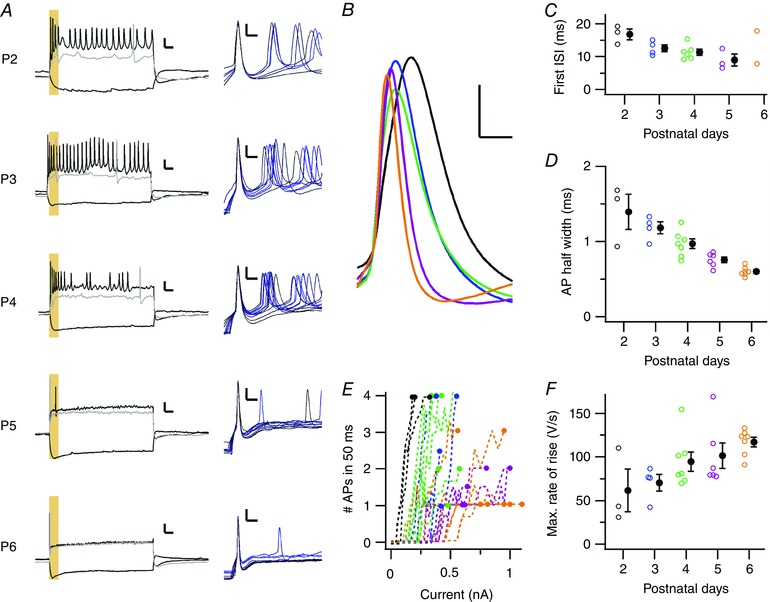
A, left, response of principal neurons to constant current injections at different postnatal days. Responses to a hyperpolarizing and two depolarizing current injections of 600 ms are shown. The response of the principal neuron to the smallest current injection that elicited AP firing is shown in grey. The yellow box indicates the first 50 ms of current injections. Right, the APs that were elicited at the start of the current injections are shown aligned on the peak potential. Colour corresponds to injected current amplitude. Bars = 20 mV and 50 ms in the left panels and 10 mV and 5 ms in the right panels. B, the average waveforms of the AP elicited at the start of the current injections in the five neurons shown in A are aligned on their AP threshold, illustrating that the AP kinetics become faster with age. Bars = 10 mV and 1 ms. Colours correspond to age as in C. C, developmental changes in first interspike interval (ISI). Around P5 the neurons typically fired only a single AP. D, developmental changes in AP half width. E, relationship between average number of APs elicited within the first 50 ms of the current injection (yellow box in A) and strength of current injection. Every line represents an average count of a single recorded neuron; the age is colour‐coded as in C. F, developmental change in maximal rate of rise of the AP. Open circles in C, D and F are single data points, filled circles are averages with SEM. [Colour figure can be viewed at wileyonlinelibrary.com]
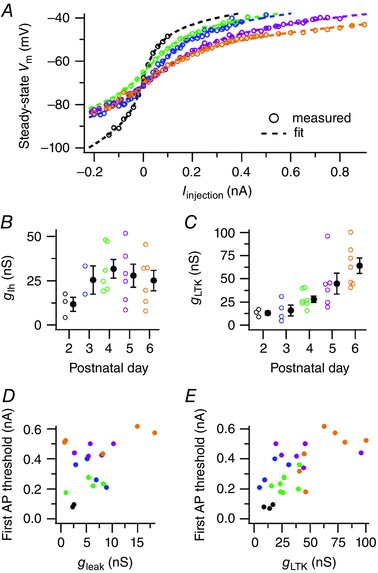
The passive properties of the principal neuron were estimated from −5 mV hyperpolarizing voltage steps from the holding potential of −70 mV, as detailed in the Methods. Its membrane capacitance remained relatively stable (P2: 47.0 ± 1.2 pF, P3: 48.0 ± 1.3 pF, P4: 49.5 ± 1.4 pF, P5: 49.9 ± 2.5 pF, P6: 47.9 ± 2.8 pF), in contrast to a developmental decline in membrane resistance (Fig. 9 E; P2: 279 ± 16 MΩ, P3: 238 ± 17 MΩ, P4: 174 ± 9 MΩ, P5: 172 ± 17 MΩ, P6: 155 ± 27 MΩ, F 4,55 = 9.3, P = 8 × 10⁻⁶). In adult mice a membrane resistance of about 80 MΩ has been reported in vivo (Lorteije et al. 2009), suggesting that the membrane resistance will continue to decline further (Scott et al. 2005). We conclude that even though, in agreement with previous reports, we did find that the excitability of the principal neuron decreased during development, surprisingly, the in vivo membrane resistance was at most half of the membrane resistance determined in neonatal slices (Hoffpauir et al. 2010; Rusu & Borst, 2011).
Matching of excitability and size of synaptic inputs
We next investigated to what extent the size of its largest synaptic inputs was matched with the intrinsic excitability of a principal neuron in the neurons in which both were recorded. First, we calculated the steady‐state potentials as the median of the last 100 ms of the constant‐current injections and plotted the I–V curve (Fig. 7 A and B). The slope resistance decreased both at depolarized and at hyperpolarized potentials, similar to previous findings (Banks & Smith, 1992), probably owing to the activation of hyperpolarization‐activated cation channels (g Ih) and low‐threshold K+ channels (g LTK) at hyperpolarized and depolarized potentials, respectively. We fitted the I–V curve between −50 and −45 mV with a straight line to measure the membrane resistance around AP threshold (Fig. 7 B). The membrane resistance around AP threshold significantly correlated inversely to the largest EPSP (−0.38 ± 0.09 μV s−1 Ω−1, t 18 = −4.0, P = 0.001, r = −0.68; Fig. 7 C) and the largest deconvolved EPSC (−0.04 ± 0.01 nA MΩ−1, t 23 = −3.7, P = 0.001, r = −0.61; Fig. 7 D). Although we cannot exclude the possibility of age as a confounding factor, this suggests that postsynaptic intrinsic excitability and size of synaptic inputs are homeostatically matched.
Figure 7. Matching of excitability and synaptic inputs of principal neurons.
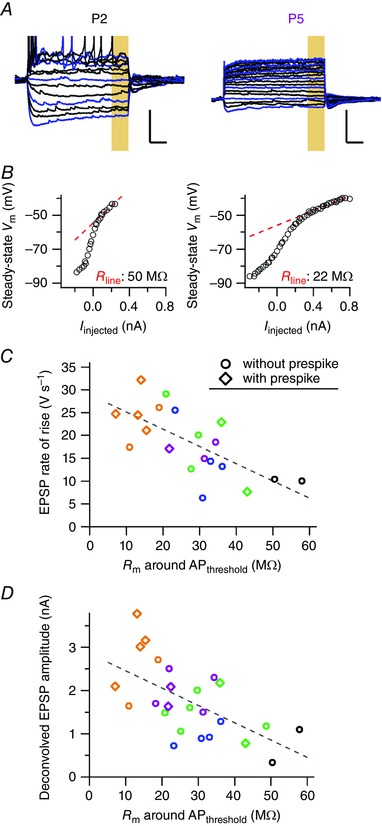
A, membrane potential during constant‐current injections in a principal neuron from a P2 (left) and a P5 (right) rat pup. Displayed constant‐current injection responses start at −120 pA; blue, multiples of 60 pA; black, multiples of 20 pA. Bars = 20 mV and 100 ms. B, Corresponding I–V curves derived from the last 100 ms of the constant‐current injection (yellow box in A). The steady‐state membrane potentials between −50 and −45 mV were fitted and the slope of the fitted line (red dotted line) gave the steady‐state membrane resistance around AP threshold for both neurons. C, the average rate of rise of large EPSPs (>5 V s−1) against the membrane resistance around AP threshold. D, the deconvolved amplitude of large EPSCs (>0.1 nA) against the membrane resistance around AP threshold. For C and D, the dotted line correspond to a linear fit; black, blue, green, magenta and orange correspond to P2, P3, P4, P5 and P6, respectively; every point corresponds to a single neuron. [Colour figure can be viewed at wileyonlinelibrary.com]
An HH‐model captures the development of principal neurons in vivo
The observed, large developmental changes in intrinsic properties appeared to involve several different types of ion channels. To understand their contribution to the developmental changes in the way APs were triggered, we constructed an HH‐model for the principal neuron. This model neuron contained five conductances: a leak conductance g leak, g Ih, g LTK, a high‐threshold potassium channel g HTK and a sodium conductance g Na. Their gating kinetics were based on previous models for the principal neuron of the MNTB (Macica et al. 2003; Leao et al. 2005; see Methods), and were kept constant throughout development. Their maximal conductances were estimated for the different ages based on the steady‐state potentials of the in vivo constant‐current injections (Fig. 7 A and B), and subsequently fitted by HH‐models to find the minimal HH‐model that could account for them (Fig. 8 A). After the passive model, which contained a leak conductance g leak and its reversal potential, was fitted, the improvement of the fit by the addition of g LTK or g Ih was tested for each cell individually. For all recordings, the addition of g LTK significantly improved the fit compared to the passive model (range of explained sums‐of‐squares: 17–87%); for 22 out of 27 recordings g Ih contributed significantly (9–60%) and for one additional recording g Ih was included as it almost reached significance (5% contribution; P = 0.1). To test the passive component of the model, the g leak + g LTK + g Ih model was compared against the g LTK + g Ih model, and for 20 out of 27 recordings g leak significantly improved the fit (9–89%); the fitted leak reversal potentials showed a developmental trend from −62 ± 5 mV at P2 to −87 ± 9 mV at P5, but this trend was not statistically significant (F 4,15 = 2.2, P = 0.13). The fitted reversal potentials were compatible with a dominant role for K+ channels in this leak conductance (Berntson & Walmsley, 2008).
Figure 8. Hodgkin–Huxley model fit of voltage‐dependent changes in membrane resistance.
A, relationship between steady‐state membrane potentials against the injected current of five principal neurons. Broken lines show results of HH‐model fit. Individual points show averages from multiple current‐injections of a single cell; see B for colour lookup. B, developmental changes in fitted g Ih. Individual data points represent cells for which g Ih made a significant contribution to the fit. C, developmental changes in fitted g LTK. D, relationship between the minimal injected current needed for AP firing and fitted g leak. Only cells in which the leak conductance significantly contributed to the fit are displayed. E, relationship between the minimal injected current for AP firing and fitted g LTK. For B and C, open circles represent a single neuron, filled circles averages with SEM. For D and E, circles represent single neurons. [Colour figure can be viewed at wileyonlinelibrary.com]
It was previously shown that the expression of low‐threshold potassium channels in the MNTB increases during development (Hoffpauir et al. 2010; Kolson et al. 2016). Our fit results showed an increase of all three conductances during development, but only for g LTK was the developmental trend statistically significant (Fig. 8 B and C; P2: 13 ± 2 nS, P3: 16 ± 6 nS, P4: 28 ± 3 nS, P5: 47 ± 11 nS, P6: 64 ± 8 nS, F 4,22 = 6.9, P = 0.0009). Low‐threshold potassium channels start to open at depolarized potentials, thereby increasing the current needed to elicit an AP (I APthr). Indeed, g LTK correlated with the I APthr obtained from the same neuron (Fig. 8 E; 3.4 ± 0.8 vs. 0 pA ns−1, t 23 = 4.5, Bonferroni‐corrected P = 0.0005, r = 0.7) and similarly g leak significantly raised I APthr (Fig. 8 D; 22 ± 5 vs. 0 pA ns−1, t 23 = 4.6, Bonferroni‐corrected P = 0.0004, r = 0.8), even when controlling for the effect of g LTK (F 2,24 = 21.8, P = 9 × 10⁻⁵). We therefore conclude that the developmental increase in g LTK and g leak significantly reduced the excitability of the postsynaptic neuron.
Next, the overall impact of the fitted conductances on the principal cell properties was assessed. We simulated the response of the model neuron to constant‐current injections (Fig. 9 A) using parameters based on the average HH‐model fits at the different ages (standard model neuron; Table 3). The values for g Na and g HTK were increased to replicate the developmental change in AP properties measured in vivo (Fig. 9 C–E; Taschenberger & von Gersdorff, 2000; Leão et al. 2005; Hoffpauir et al. 2010). With the resulting set of parameters, the standard model neurons reproduced the developmental switch from continuous to single AP firing (Fig. 9 A), and had a similar membrane resistance as the in vivo recordings (Fig. 9 B). Interestingly, g LTK strongly affected the spiking behaviour of the standard model neurons. The increase in g LTK elevated the minimal current needed to elicit an AP (Fig. 9 F) and gave simulated I APthr values similar to the I APthr measured in vivo (cf. Fig. 8 F). In response to constant‐current injection, the P2 standard model neuron intrinsically fired at miniburst frequencies; g LTK could restrict AP firing to a single AP or could even silence the model neuron if the sodium conductance was sufficiently low (Fig. 9 G). The switch from single AP to tonic firing followed the ratio 1:10 for g LTK:g Na, although the exact ratio also depended on the other conductances. Comparing the fitted g LTK values for the individual neurons with our simulations, our simulations predicted that the principal neuron would be likely to switch to phasic firing at P4–5 (Fig. 8 C), consistent with the in vivo response of the neurons to constant‐current injections. These converging results suggest that our HH‐model forms an adequate approximation of the in vivo developmental changes in the intrinsic properties of the principal neuron.
Table 3.
Age‐specific model parameters
| P2 | P3 | P4 | P5 | P6 | |
|---|---|---|---|---|---|
| g leak (nS) | 2 | 2.3 | 2.8 | 4.5 | 5.5 |
| g Na (nS) | 150 | 180 | 210 | 250 | 300 |
| g LTK (nS) | 11 | 14 | 20 | 50 | 70 |
| g HTK (nS) | 30 | 50 | 80 | 140 | 300 |
| g Ih (nS) | 12 | 25 | 37 | 36 | 31 |
Values for g leak, g LTK and g Ih were derived from fitting in vivo current injections to a Hodgkin–Huxley‐type model. Values for g Na and g HTK were adjusted to match the in vivo AP properties. C m was 30 pF for all ages; it was calculated using the first 10 ms from a voltage‐step (−70 to −75 mV) and adjusted for dendritic capacitances.
To test how accurately we could simulate postsynaptic activity based on the recorded intrinsic properties of the neuron and the recorded incoming activity, we selected the 12 neurons for which the intrinsic properties had been measured and adequate VC‐ and CC‐recordings had been obtained. The aim was to use the recorded EPSCs as input to a model neuron with fitted conductances from the recorded neuron and compare the modelled with the in vivo CC recording. We first focused on the large EPSCs (>100 pA; cf. Fig. 4), and with the calculated NMDA conductance, the modelled EPSPs’ rate of rise approached the in vivo EPSPs’ rate of rise (r = 0.9, model/measured = 0.95 ± 0.07). We then selected from the 12 neurons six VC recordings – two for P4 and one for each of the other postnatal days – for which voltage control was relatively good, as judged by the paucity of clamp‐escaping action currents. The full VC recording processed by the model neuron resulted in a modelled CC recording with epochs of high activity with AP firing as seen in vivo, except the miniburst intervals were less prevalent (Fig. 10 A, C and D).
Figure 10. Contribution of the NMDA conductance to the minibursts.
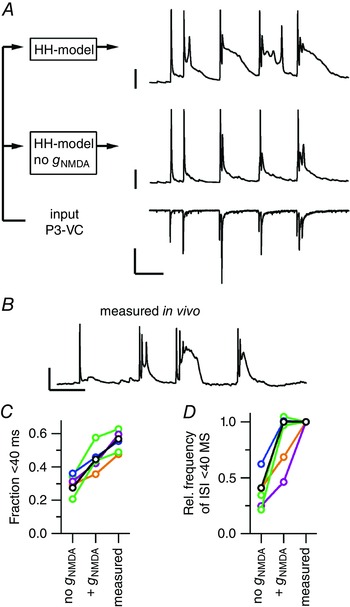
A, left‐hand scheme indicates the modelling conditions with a P3 voltage‐clamp recording as input for the Hodgkin–Huxley model (HH‐model) either with or without the NMDA conductance with parameters based on the in vivo recorded neuron. Right, P3 voltage‐clamp recording that was used as input for the model (bottom), modelled current‐clamp recording without NMDA conductance (middle), modelled current‐clamp recording with NMDA conductance (top). Calibration bars = 1 nA (bottom), 25 mV (middle, top) and 100 ms. B, representative trace from the in vivo current‐clamp recording from the same neuron as in A. Calibration bars = 25 mV and 100 ms. C, the fraction of interspike intervals < 40 ms for six neurons (lines) for either the modelled values or the in vivo recording. D, as C, but for the frequency of intervals < 40 ms relative to the in vivo recording. Colours in C and D correspond to age: P2 black, P3 blue, P4 green, P5 magenta, P6 orange; the P3 neuron is shown in A and B. [Colour figure can be viewed at wileyonlinelibrary.com]
A major part of the synaptic conductance is carried through NMDA receptors, and this conductance was calculated within the model (see Methods). To investigate how the NMDA conductance contributed to AP generation in our in vivo recordings, we simulated the same recordings again, except we left out g NMDA. As a consequence, the fraction of APs occurring within minibursts was reduced from 0.45 ± 0.03 to 0.30 ± 0.02, which was clearly lower than what was measured in vivo (0.55 ± 0.02; Fig. 10 C; repeated‐measures F 2,10 = 58, P = 3 × 10⁻⁶, model no g NMDA vs. model with g NMDA: t5 = 4.7, Bonferroni‐corrected P = 0.01). In addition, the frequency of miniburst intervals halved in the absence of the NMDA conductance (Fig. 10 D; ratio of model no g NMDA vs. model with g NMDA: 0.45 ± 0.06). Without the NMDA conductance the ‘shoulder’ potential that followed the AP was less pronounced, and it seemed that in our simulations the shoulder potential was extended compared to the in vivo recording (Fig. 10 A and B). Also, the NMDA conductance did not seem to facilitate miniburst firing in our P5 and P6 simulations. In summary, the simulations suggest that the NMDA conductance makes an important contribution to the shoulder potential that facilitates secondary APs and miniburst firing at the younger ages.
Contribution of developmental increases in g LTK and g leak to synaptically triggered APs
A key difference between principal neurons at P2 and P5 was that at P2, APs were typically triggered by summating EPSPs, whereas at P5 APs were typically triggered by a single EPSP, which started close to the resting potential. To investigate the role of the onset membrane potential and the changes in voltage‐dependent ion channels to the developmental changes in the minimum EPSP size needed to trigger an AP, we used EPSCs of different amplitude as input to the models representing the different ages. In the P2 standard model neuron, even very small EPSCs could already trigger an AP from a depolarized onset potential, whereas in the P5 standard model neuron, much larger EPSCs were needed, and excitability decreased again at very depolarized membrane potentials (Fig. 11 A). In Fig. 11 B we systematically tested what minimum EPSC size was needed to trigger an AP at different onset membrane potentials for the standard model neurons (Table 3, cf. Fig. 9). Large EPSCs were needed to trigger an AP at the older ages, even at depolarized onset potentials. In contrast, at the younger ages, small EPSCs could trigger an AP at depolarized potentials. To understand the relative contribution of g LTK and g leak to these developmental changes, we systematically varied the maximal conductance of g LTK and g leak within the P2 standard model neuron to see how they influence the relationship between the membrane potential and the minimum EPSC needed to trigger an AP. As g LTK increased, even at depolarized membrane potentials large EPSCs became necessary to trigger an AP, probably due to the activation of g LTK at these potentials (Fig. 11 C). In contrast, whereas an increase in g leak also decreased excitability, at depolarized potentials small EPSCs could still trigger an AP (Fig. 11 D). Because of its slow kinetics, g Ih had a similar effect as g leak (data not shown). These results suggest that all three conductances could decrease excitability, but that the recruitment of g LTK has the additional effect of strongly limiting the contribution of EPSP summation to AP generation at the older ages.
Figure 11. Dissection of the effect of the low‐threshold potassium conductance and the leak conductance on postsynaptic firing induced by one or multiple EPSCs.
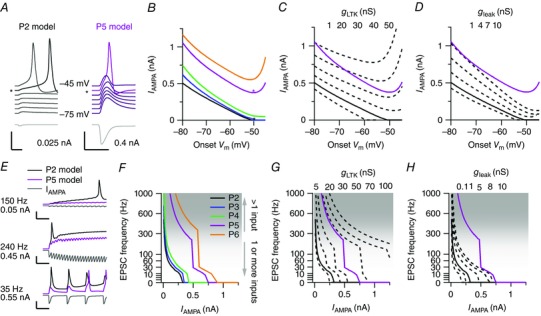
A, left, P2 model output in response to a 25 pA EPSC (grey, bottom panel) at onset membrane potentials ranging between −45 mV (top) and −75 mV (bottom). Right, P5 model output in response to 400 pA EPSC. The asterisk indicates the most negative onset membrane potential at which an AP was detected. Note that in the P5 model the EPSC did not elicit an AP at the −45 mV onset membrane potential. Both calibration bars = 20 mV, 300 pA and 10 ms. Colours are added for visual aid. B, relationship between the EPSC amplitude minimally needed to trigger an AP and the onset potential for different parameter sets, as illustrated in A. The asterisks correspond to the traces indicated with an asterisk in A. C, relationship between EPSC amplitude and the onset potential at different g LTK values for the P2 model (broken lines, values given at the top). Continuous lines indicate the standard P2 and P5 model for reference. D, as in C, but for g leak. E, three examples of EPSC trains (bottom, grey) with different frequencies and amplitudes and the corresponding output of the P2 model (top, black) and P5 model (top, magenta). Top traces start at −70 mV. Calibration bars = 25 mV, 500 pA and 20 ms. F, relationship between amplitude minimally needed to trigger an AP and the EPSC frequency for different parameter sets. Shaded area illustrates the frequency range that is unlikely to be attained by a single axon. G, relationship between the amplitude minimally needed to trigger an AP and EPSC frequency at different g LTK values for the P2 model (broken lines, values given at the top side). Continuous lines show the standard P2 and P5 model for reference. H, as in G but for different g leak values. For C, D, G and H, the conductance values listed on top from left to right correspond to the traces from left to right. For F–H, the resting membrane potential was set at −70 mV. [Colour figure can be viewed at wileyonlinelibrary.com]
To test this more directly, we simulated an 0.8 s epoch of bursting activity by generating a train of identical synapse conductances g syn that were based on the model EPSC time course (see Methods). These train simulations confirmed that at high frequencies even small EPSCs could trigger an AP in the P2 standard model neuron, but that for the P5 standard model neuron large EPSCs were needed (Fig. 11 E). This was confirmed in a more systematic test of the minimum EPSC needed to trigger an AP as a function of both EPSC amplitude and frequency within the train for the different age model neurons (Fig. 11 F). While for the P2 model neuron the EPSC frequency and amplitude showed a simple, inverse relationship, for the P5 and P6 standard model neuron a vertical plateau in the amplitude–frequency relationship appeared; at these settings very high frequencies were needed to substantially lower the EPSC size needed to trigger an AP. To understand the relative impact of g LTK and g leak on these changes, we again systematically altered their conductances within the P2 standard model neuron. The increase in g LTK drastically increased the frequency needed to trigger an AP with a small EPSC, and at increased g LTK, the vertical plateau appeared, suggesting that g LTK differentially changed excitability for smaller and bigger EPSC amplitudes (Fig. 11 G). In contrast, g leak also affected the minimum frequency needed for an AP, but did so more homogeneously for all amplitudes. The effect of g Ih was again comparable to that of g leak (data not shown).
At the older ages, EPSPs decayed back to baseline faster than at the younger ages, among others because the increase in g leak and g Ih decreased the membrane time constant around the RMP. Hence, at low frequencies, the AP threshold had to be reached with only minor pre‐depolarization (Fig. 11 E, lower panel). The minimum EPSC amplitude that singlehandedly could elicit AP firing corresponds to the vertical plateau – the region where a small decrease in EPSC amplitude demands a disproportionate increase in EPSC frequency to elicit an AP (compare Fig. 11 B with F, Fig. 11 C with G). The vertical plateau marks the transition from a situation where a single, large EPSC triggers an AP without the need of substantial pre‐depolarization, to a situation where only high‐frequency bursting, which causes rapid summation, can activate the sodium conductance before g LTK activates substantially. With increasing g LTK the frequencies needed for small EPSCs to elicit an AP quickly rose, making it unlikely that barrages of small EPSCs during epochs of high activity, as recorded in vivo, would be able to ‘outrun’ the activation of g LTK and elicit APs.
With an EPSP rise time of ∼3 ms within the P5 standard model neuron, at frequencies over 300 Hz the distinction with the single large EPSC regime blurs. Given that, based on our juxtacellular recordings, a single axon has a maximal firing frequency of ∼300 Hz with maximally six APs, it becomes very unlikely that any input will independently generate a postsynaptic AP, unless the synapse is large, which explains the observed, increased dependency of postsynaptic firing on a prespike‐related input in our juxtacellular recordings. We conclude that both g LTK and g leak decrease excitability, but that g LTK is particularly effective in suppressing AP generation by EPSP summation, thus biasing the principal neuron to progressively larger inputs.
Discussion
We made in vivo recordings from principal neurons of the rat MNTB to study the developmental changes in intrinsic properties and synaptic inputs during the first neonatal week, the period when the calyx of Held synapse forms. The main advantage of our in vivo approach was the possibility to study the MNTB development within an intact, spontaneously active system, which allowed us to record the impact of the developing calyceal synapses. Principal neurons showed complex bursting activity that was triggered by spontaneous inputs, consisting of a stable component at around 10 Hz and a faster component that became more prominent and accelerated during development. Postsynaptic firing became increasingly dependent on a prespike‐associated input. Whole‐cell recordings revealed a developmental change in the way postsynaptic APs were triggered by the spontaneous inputs: at P2, barrages of small EPSPs caused the neuron to fire multiple APs elicited from a plateau depolarization, while at P5, APs were typically triggered by a single, large EPSP. At the same time, the intrinsic excitability of the principal neuron changed considerably; these changes included a substantial increase in the conductance of the low‐threshold K+ channel, g LTK. According to HH‐model simulations, this increase of g LTK reduced EPSP summation, thus necessitating large inputs for triggering APs.
Developmental changes in burst firing patterns
Our juxtacellular recordings agree well with our earlier developmental study, for which the youngest age studied was P4 (Crins et al. 2011). The present data show an increase in synaptic latencies at the youngest ages and fewer recordings containing prespikes. A complex bursting pattern could already be observed as early as P2. Its 10 Hz component, which has been associated with calcium spike intervals of hair cells (Tritsch et al. 2010), remained remarkably stable, whereas the fast component was slower and less pronounced at the youngest ages. At P2, APs were typically triggered by summating EPSPs. The prominent presence of the 10 Hz peak already at that age, in combination with the observation that the EPSPs that triggered the spikes were on average larger than the other EPSPs, indicates that already well before the calyx develops, relatively large inputs at ∼100 ms intervals play a key role in triggering APs in the principal neurons. The miniburst component did show developmental shortening. Multiple mechanisms may contribute to this. At these young ages, burst generation in the cochlea is just starting to occur and the maximal instantaneous firing rate in the auditory nerve is still <100 Hz (Tritsch et al. 2007; Tritsch & Bergles, 2010). The maturation of the modified endbulb of Held synapse may precede that of the calyx of Held synapse, but is still far from mature at P2–3 (Marrs & Spirou, 2012). Interestingly, however, no developmental shortening was observed for the miniburst prespike intervals, and these intervals were shorter than those of their postsynaptic counterparts. This indicates that developmental processes within the MNTB can also make a clear contribution to the developmental shortening of miniburst intervals of the principal neurons.
In the two cases in which we distinguished multiple large inputs by the presence or absence of a prespike, their activity was strongly correlated and their co‐occurrence extended to single minibursts, suggesting convergence of temporally co‐active axons. Little is currently known about the spatial organization of pre‐hearing spontaneous activity within the auditory brainstem, but these recordings thus provide anecdotal evidence that neurons wiring together may tend to fire together.
Developmental changes in inputs
In a relatively short period, we observed the emergence of large inputs that could trigger an AP by themselves. These large inputs were often associated with prespikes, and thus can be expected to occupy a large portion of the postsynaptic somatic surface. An important, unresolved question regarding the development of the calyx of Held synapse is to what extent there is competition between large inputs for somatic space. In P2–6 mice, ultrastructural reconstructions of principal neurons and their axosomatic synapses indicated that 25/119 principal neurons were innervated by multiple large axosomatic terminals (Holcomb et al. 2013 b). In another study, 7/101 neurons from P7–15 mice showed evidence for multiple large inputs (>440 pA; Bergsman et al. 2004). In contrast, we found evidence for the presence of multiple large inputs, here defined as inputs >5 V s−1 or 100 pA (∼500 pA after deconvolution), in only 3/132 recordings. In each case one input was preceded by a prespike while the other was not. We did not find evidence for the presence of prespikes of different size, which would be evidence for the presence of multiple, large somatic inputs. As disparate as these studies are, the difference seems substantial, and might be explained by a species difference, a bias against recording from cells with multiple large somatic inputs, the presence of large somatic terminals firing infrequently or having small impact, or large inputs with very similar characteristics. Even though our data are compatible with the view that the presence of multiple protocalyces is a rare phenomenon, without a detailed structure–function analysis of nascent calyces it is currently not possible to resolve the apparent discrepancies with earlier studies.
Model limitations
We used an HH‐model to infer the relative importance of developmental changes in intrinsic properties for the excitability of the principal neurons. A limitation of our model was that we assumed a single compartment, whereas our stainings revealed extensive dendrites and an axon. As the dendrites and axons charge slowly, the capacitive load becomes time dependent. Our capacitance estimates were based on the first 10 ms of a 5 mV step and were about 50 pF, which still represents an underestimation of the postsynaptic capacitance owing to limited spatial clamp. However, other reported MNTB models used 10−20 pF, which better approximates the somatic capacitance (Macica et al. 2003; Leao et al. 2005), indicating that our capacitance measurements included non‐somatic membrane. Although we corrected for the dendritic capacitance (see Methods), the model results are sensitive to the chosen value. Another limitation of our simulations is that the synaptic conductances were obtained from VC recordings at −80 mV, where the NMDA component will be minimal, while it is known to be quite large at neonatal ages in the principal neurons (Taschenberger & von Gersdorff, 2000; Hoffpauir et al. 2006). As the NMDA component is rather slow, it is the NMDA conductance that will be most sensitive to the size of the dendritic capacitance. Lastly, slow voltage‐dependent conductances that affect the AP, additional activity‐dependent conductances and short‐term synaptic depression were not included in our model (Taschenberger et al. 2005; Yang et al. 2007; Hardman & Forsythe, 2009; Crins et al. 2011). Any deviation will alter the outcome of the simulations for long periods of activity. Therefore, the simulations might be fairly reliable for short periods, such as EPSPs or current injections, but will be less reliable when modelling seconds of high synaptic activity, as recorded in vivo.
Developmental changes in excitability
We observed a large developmental decrease in the excitability of the principal neurons, which was due, among other things, to a decrease in their resting membrane resistance and an increase in low‐threshold K+ channels. The developmental decrease in the membrane resistance was in agreement with earlier slice studies in the MNTB (Hoffpauir et al. 2010; Rusu & Borst, 2011), in other auditory synapses (Kuba et al. 2002; Gao & Lu, 2008; Marrs & Spirou, 2012) or in other brain areas (Spitzer et al. 2002; Shah & Crair, 2008). The absolute size of the membrane resistance, however, was only half of the ex vivo value. Apart from the absence of spontaneous presynaptic activity ex vivo, possible factors explaining this difference include a difference in the composition of the external medium, e.g. a higher neurotransmitter concentration in vivo, and the cutting of dendritic branches or the axon during slicing, as suggested by the lower membrane capacitance reported in slices (Rusu & Borst, 2011).
The membrane resistance was highest close to the RMP. In the depolarizing direction we found evidence for a developmental increase in the conductance of low‐threshold K+ channels. Based on the HH‐model fits, g LTK increased four‐fold between P2 and P6. The reported changes in the HH‐model conductances are to be considered as approximate values, as they were measured indirectly and were not pharmacologically confirmed; we also assumed that gating kinetics were constant during development, which may not be correct (Moody & Bosma, 2005). There are, however, several arguments that the increase in g LTK is real. Every principal neuron at P2 fired repetitively and at P5–6 most neurons fired only a single AP. Our model reproduced the essential role of g LTK in this change (Dodson et al. 2002; Brew et al. 2003; Hoffpauir et al. 2010). Moreover, the increase is in general agreement with the postnatal increase in mRNA expression for Kv1 channels in MNTB neurons (Hoffpauir et al. 2010; Kolson et al. 2016). A similar developmental increase in low‐threshold K+ channels has also been observed at other auditory synapses (Kuba et al. 2002; Gao & Lu, 2008). The alternative possibility that this change was due to a very large increase in g HTK seems highly unlikely, as this would have a major negative impact on the principal neuron's ability to fire APs.
By being located at the initial segment, the Kv1 channels are in an optimal position to control AP generation (Dodson et al. 2002). Following the increased expression of low‐threshold K+ channels, the neurons become dependent on a large input, which had to be sufficiently fast to ‘outrun’ the activation of the Kv1 channels. In this respect they have a similar function as in fast‐spiking cortical interneurons (Goldberg et al. 2008). Our simulations also allowed us to delineate the different role of leak channels and low‐threshold K+ channels: both decreased excitability, but low‐threshold K+ channels were especially effective in preventing EPSP summation, thus effectively restricting AP generation to large inputs.
Despite the increase in K+ channels, no clear developmental hyperpolarization of the RMP was observed, in contrast to the situation at many other synapses (Ramoa & McCormick, 1994; Zhou & Hablitz, 1996; Warren & Jones, 1997; Belleau & Warren, 2000). Possibly, a concomitant change in the expression of I h (Rothman & Manis, 2003) or in other channels or transporters that are active at rest (Berntson & Walmsley, 2008; Kim & von Gersdorff, 2012) limited the impact of the K+ channels on the RMP.
Plateau potentials
During high‐frequency bursting, MNTB neurons demonstrated a plateau depolarization in vivo. Plateau depolarizations have also been observed during high‐frequency calyceal stimulation in slice recordings, and were shown to be NMDA‐dependent (Futai et al. 2001; Leão & von Gersdorff, 2002; Joshi et al. 2007) and attenuated by presynaptic activation of adrenergic receptors (Leão & von Gersdorff, 2002). Our simulations in which we used the recorded VC activity as input to the HH‐model were in agreement with an important role for NMDAR activity, even though for definitive confirmation pharmacological blockage would be needed. These plateau potentials are also commonly observed in the developing neocortex, where they may play an important role in network oscillations and synaptic maturation (Allene & Cossart, 2010). One possible function of these plateau potentials might be to activate L‐type Ca2+ channels (Dilger et al. 2015), which are an important source for postsynaptic Ca2+ entry (Bollmann et al. 1998), and are known to be important for survival of MNTB neurons (Hirtz et al. 2011; Satheesh et al. 2012; Ebbers et al. 2015). Calcium channels have a rather uniform distribution on the postsynaptic soma of principal neurons and can therefore substantially raise nuclear Ca2+ concentrations owing to the eccentric location of the nucleus (Bollmann et al. 1998), which is often away from the calyx synapse (Holcomb et al. 2013 a); the nuclear Ca2+ increases may play an important role in synaptic development and neuronal survival (West & Greenberg, 2011). The developmental increase in low‐threshold potassium channels can limit the impact of plateau potentials (Sanchez et al. 2012), and, together with the developmental downregulation of NMDA channels (Taschenberger & von Gersdorff, 2000; Futai et al. 2001; Steinert et al. 2010), can be expected to restrict the options for large changes in the synaptic makeup of principal neurons.
Relationship between innervation and excitability
We did not observe any cells with a very clear mismatch between excitability and size of the inputs. Cells with high excitability had small inputs and cells with low excitability received large inputs. This suggests a temporal, homeostatic matching between protocalyx formation and the reduction of the excitability of principal neurons, and raises the question of how this matching is accomplished (Moody & Bosma, 2005; Walmsley et al. 2006; Davis, 2013). Several transcription factors have recently been identified that can regulate Kv1 expression (Wolfram et al. 2014; Dehorter et al. 2015; Rodríguez‐Tornos et al. 2016). Interestingly, one of them, the transcription factor Er81, is activity‐dependent (Dehorter et al. 2015), suggesting one way in which the morphological and electrophysiological changes might be coupled. Two transcription factors in Drosophila, Islet and Lim3, together control both Shaker, the Drosophila homologue of Kv1, and several genes related to synaptogenesis, suggesting a second way in which excitability and connectivity might be coupled. Thirdly, the transcription factor Cux1 controls Kv1 expression levels, and it has been suggested that the resulting changes in excitability may also influence synaptic innervation (Rodríguez‐Tornos et al. 2016). In addition, the contribution of Kv1 might be fine‐tuned by activity‐dependent, post‐translational modifications, leading to changes in gating kinetics or protein trafficking (reviewed by Kaczmarek et al. 2005; Johnston et al. 2010). Thus, there are several ways in which changes in synaptic inputs and postsynaptic excitability might be coupled (Turrigiano & Nelson, 2004; Davis, 2013; Wolfram & Baines, 2013; Santiago & Bashaw, 2014; Kratsios et al. 2015; Yin & Yuan, 2015). Elucidation of the homeostatic mechanisms that ensure that the activity patterns that are generated at the cochlea are propagated to more central structures even though there are major changes in the strength of synaptic connections will require a combination of molecular, anatomical and functional studies.
Additional information
Competing interests
The authors declare no competing financial interests.
Author contributions
JGGB and MCS designed experiments. MCS and MST acquired the data. MCS performed the modelling work. All authors contributed to the analysis and interpretation of the data. JGGB and MCS drafted the paper, and all authors edited and revised the paper. All authors approved the final version of the manuscript. All authors agree to be accountable for all aspects of the work in ensuring that questions related to the accuracy and integrity of any part of the work are appropriately investigated and resolved. All persons designated as authors qualify for authorship, and all those who qualify are listed.
Funding
This work was financially supported by the Earth and Life Sciences‐Netherlands Organisation of Scientific Research (#823.02.006, ‘Development of a giant synapse’) and by the Dutch Fund for Economic Structure Reinforcement (FES, 0908 ‘NeuroBasic PharmaPhenomics project’).
Acknowledgements
Confocal scanning microscope was accessed via the Optical Imaging Center at Erasmus MC. We thank Kees Donkersloot for technical support, John Soria van Hoeve for surgical training, Rüdiger Geis for helpful discussions and Elize Haasdijk for support with histology.
References
- Allene C & Cossart R (2010). Early NMDA receptor‐driven waves of activity in the developing neocortex: physiological or pathological network oscillations? J Physiol 588, 83–91. [DOI] [PMC free article] [PubMed] [Google Scholar]
- Ankri N, Legendre P, Faber DS & Korn H (1994). Automatic detection of spontaneous synaptic responses in central neurons. J Neurosci Methods 52, 87–100. [DOI] [PubMed] [Google Scholar]
- Banks MI & Smith PH (1992). Intracellular recordings from neurobiotin‐labeled cells in brain slices of the rat medial nucleus of the trapezoid body. J Neurosci 12, 2819–2837. [DOI] [PMC free article] [PubMed] [Google Scholar]
- Belleau ML & Warren RA (2000). Postnatal development of electrophysiological properties of nucleus accumbens neurons. J Neurophysiol 84, 2204–2216. [DOI] [PubMed] [Google Scholar]
- Bergsman JB, De Camilli P & McCormick DA (2004). Multiple large inputs to principal cells in the mouse medial nucleus of the trapezoid body. J Neurophysiol 92, 545–552. [DOI] [PubMed] [Google Scholar]
- Berntson AK & Walmsley B (2008). Characterization of a potassium‐based leak conductance in the medial nucleus of the trapezoid body. Hear Res 244, 98–106. [DOI] [PubMed] [Google Scholar]
- Bollmann JH, Helmchen F, Borst JGG & Sakmann B (1998). Postsynaptic Ca2+ influx mediated by three different pathways during synaptic transmission at a calyx‐type synapse. J Neurosci 18, 10409–10419. [DOI] [PMC free article] [PubMed] [Google Scholar]
- Borst JGG, Helmchen F & Sakmann B (1995). Pre‐ and postsynaptic whole‐cell recordings in the medial nucleus of the trapezoid body of the rat. J Physiol 489, 825–840. [DOI] [PMC free article] [PubMed] [Google Scholar]
- Borst JGG & Soria van Hoeve J (2012). The calyx of Held synapse: from model synapse to auditory relay. Annu Rev Physiol 74, 199–224. [DOI] [PubMed] [Google Scholar]
- Brew HM & Forsythe ID (1995). Two voltage‐dependent K+ conductances with complementary functions in postsynaptic integration at a central auditory synapse. J Neurosci 15, 8011–8022. [DOI] [PMC free article] [PubMed] [Google Scholar]
- Brew HM, Hallows JL & Tempel BL (2003). Hyperexcitability and reduced low threshold potassium currents in auditory neurons of mice lacking the channel subunit Kv1.1. J Physiol 548, 1–20. [DOI] [PMC free article] [PubMed] [Google Scholar]
- Chuhma N & Ohmori H (1998). Postnatal development of phase‐locked high‐fidelity synaptic transmission in the medial nucleus of the trapezoid body of the rat. J Neurosci 18, 512–520. [DOI] [PMC free article] [PubMed] [Google Scholar]
- Clause A, Kim G, Sonntag M, Weisz CJC, Vetter DE, Rübsamen R & Kandler K (2014). The precise temporal pattern of prehearing spontaneous activity is necessary for tonotopic map refinement. Neuron 82, 822–835. [DOI] [PMC free article] [PubMed] [Google Scholar]
- Crins TTH, Rusu SI, Rodríguez‐Contreras A & Borst JGG (2011). Developmental changes in short‐term plasticity at the rat calyx of Held synapse. J Neurosci 31, 11706–11717. [DOI] [PMC free article] [PubMed] [Google Scholar]
- Davis GW (2013). Homeostatic signaling and the stabilization of neural function. Neuron 80, 718–728. [DOI] [PMC free article] [PubMed] [Google Scholar]
- Dehorter N, Ciceri G, Bartolini G, Lim L, del Pino I & Marin O (2015). Tuning of fast‐spiking interneuron properties by an activity‐dependent transcriptional switch. Science 349, 1216–1220. [DOI] [PMC free article] [PubMed] [Google Scholar]
- Dilger EK, Krahe TE, Morhardt DR, Seabrook TA, Shin HS & Guido W (2015). Absence of plateau potentials in dLGN cells leads to a breakdown in retinogeniculate refinement. J Neurosci 35, 3652–3662. [DOI] [PMC free article] [PubMed] [Google Scholar]
- Dodson PD, Barker MC & Forsythe ID (2002). Two heteromeric Kv1 potassium channels differentially regulate action potential firing. J Neurosci 22, 6953–6961. [DOI] [PMC free article] [PubMed] [Google Scholar]
- Ebbers L, Satheesh SV, Janz K, Rüttiger L, Blosa M, Hofmann F, Morawski M, Griesemer D, Knipper M, Friauf E & Nothwang HG (2015). L‐type calcium channel Cav1.2 is required for maintenance of auditory brainstem nuclei. J Biol Chem 290, 23692–23710. [DOI] [PMC free article] [PubMed] [Google Scholar]
- Ehmann H, Hartwich H, Salzig C, Hartmann N, Clément‐Ziza M, Ushakov K, Avraham KB, Bininda‐Emonds ORP, Hartmann AK, Lang P, Friauf E & Nothwang HG (2013). Time‐dependent gene expression analysis of the developing superior olivary complex. J Biol Chem 288, 25865–25879. [DOI] [PMC free article] [PubMed] [Google Scholar]
- Futai K, Okada M, Matsuyama K & Takahashi T (2001). High‐fidelity transmission acquired via a developmental decrease in NMDA receptor expression at an auditory synapse. J Neurosci 21, 3342–3349. [DOI] [PMC free article] [PubMed] [Google Scholar]
- Gao H & Lu Y (2008). Early development of intrinsic and synaptic properties of chicken nucleus laminaris neurons. Neuroscience 153, 131–143. [DOI] [PubMed] [Google Scholar]
- Goldberg EM, Clark BD, Zagha E, Nahmani M, Erisir A & Rudy B (2008). K+ channels at the axon initial segment dampen near‐threshold excitability of neocortical fast‐spiking GABAergic interneurons. Neuron 58, 387–400. [DOI] [PMC free article] [PubMed] [Google Scholar]
- Hardman RM & Forsythe ID (2009). Ether‐à‐go‐go‐related gene K+ channels contribute to threshold excitability of mouse auditory brainstem neurons. J Physiol 587, 2487–2497. [DOI] [PMC free article] [PubMed] [Google Scholar]
- Held H (1893). Die centrale Gehörleitung. Archiv fur Anatomie und Physiologie, Anatomie Abtheil, 201–248. [Google Scholar]
- Hirtz JJ, Boesen M, Braun N, Deitmer JW, Kramer F, Lohr C, Müller B, Nothwang HG, Striessnig J, Löhrke S & Friauf E (2011). Cav1.3 calcium channels are required for normal development of the auditory brainstem. J Neurosci 31, 8280–8294. [DOI] [PMC free article] [PubMed] [Google Scholar]
- Hoffpauir BK, Grimes JL, Mathers PH & Spirou GA (2006). Synaptogenesis of the calyx of Held: rapid onset of function and one‐to‐one morphological innervation. J Neurosci 26, 5511–5523. [DOI] [PMC free article] [PubMed] [Google Scholar]
- Hoffpauir BK, Kolson DR, Mathers PH & Spirou GA (2010). Maturation of synaptic partners: functional phenotype and synaptic organization tuned in synchrony. J Physiol 588, 4365–4385. [DOI] [PMC free article] [PubMed] [Google Scholar]
- Holcomb PS, Deerinck TJ, Ellisman MH & Spirou GA (2013. a). Construction of a polarized neuron. J Physiol 591, 3145–3150. [DOI] [PMC free article] [PubMed] [Google Scholar]
- Holcomb PS, Hoffpauir BK, Hoyson MC, Jackson DR, Deerinck TJ, Marrs GS, Dehoff M, Wu J, Ellisman MH & Spirou GA (2013. b). Synaptic inputs compete during rapid formation of the calyx of Held: a new model system for neural development. J Neurosci 33, 12954–12969. [DOI] [PMC free article] [PubMed] [Google Scholar]
- Johnson SL, Eckrich T, Kuhn S, Zampini V, Franz C, Ranatunga KM, Roberts TP, Masetto S, Knipper M, Kros CJ & Marcotti W (2011). Position‐dependent patterning of spontaneous action potentials in immature cochlear inner hair cells. Nat Neurosci 14, 711–717. [DOI] [PMC free article] [PubMed] [Google Scholar]
- Johnston J, Forsythe ID & Kopp‐Scheinpflug C (2010). Going native: voltage‐gated potassium channels controlling neuronal excitability. J Physiol 588, 3187–3200. [DOI] [PMC free article] [PubMed] [Google Scholar]
- Joshi I, Yang Y‐M & Wang L‐Y (2007). Coincident activation of metabotropic glutamate receptors and NMDA receptors (NMDARs) downregulates perisynaptic/extrasynaptic NMDARs and enhances high‐fidelity neurotransmission at the developing calyx of Held synapse. J Neurosci 27, 9989–9999. [DOI] [PMC free article] [PubMed] [Google Scholar]
- Kaczmarek LK, Bhattacharjee A, Desai R, Gan L, Song P, von Hehn CAA, Whim MD & Yang B (2005). Regulation of the timing of MNTB neurons by short‐term and long‐term modulation of potassium channels. Hear Res 206, 133–145. [DOI] [PubMed] [Google Scholar]
- Kandler K & Friauf E (1993). Pre‐ and postnatal development of efferent connections of the cochlear nucleus in the rat. J Comp Neurol 328, 161–184. [DOI] [PubMed] [Google Scholar]
- Kil J, Kageyama GH, Semple MN & Kitzes LM (1995). Development of ventral cochlear nucleus projections to the superior olivary complex in gerbil. J Comp Neurol 353, 317–340. [DOI] [PubMed] [Google Scholar]
- Kim JH & von Gersdorff H (2012). Suppression of spikes during posttetanic hyperpolarization in auditory neurons: the role of temperature, I h currents, and the Na+–K+–ATPase pump. J Neurophysiol 108, 1924–1932. [DOI] [PMC free article] [PubMed] [Google Scholar]
- Kolson DR, Wan J, Wu J, Dehoff M, Brandebura AN, Qian J, Mathers PH & Spirou GA (2016). Temporal patterns of gene expression during calyx of Held development. Dev Neurobiol 76, 166–189. [DOI] [PMC free article] [PubMed] [Google Scholar]
- Kratsios P, B Pinan‐Lucarré, Kerk SY, Weinreb A, Bessereau JL & Hobert O (2015). Transcriptional coordination of synaptogenesis and neurotransmitter signaling. Curr Biol 25, 1282–1295. [DOI] [PMC free article] [PubMed] [Google Scholar]
- Kuba H, Koyano K & Ohmori H (2002). Development of membrane conductance improves coincidence detection in the nucleus laminaris of the chicken. J Physiol 540, 529–542. [DOI] [PMC free article] [PubMed] [Google Scholar]
- Kuenzel T, Wirth MJ, Luksch H, Wagner H & Mey J (2009). Increase of Kv3.1b expression in avian auditory brainstem neurons correlates with synaptogenesis in vivo and in vitro . Brain Res 1302, 64–75. [DOI] [PubMed] [Google Scholar]
- Kuwabara N, DiCaprio RA & Zook JM (1991). Afferents to the medial nucleus of the trapezoid body and their collateral projections. J Comp Neurol 314, 684–706. [DOI] [PubMed] [Google Scholar]
- Leão RM, Kushmerick C, Pinaud R, Renden R, Li G‐L, Taschenberger H, Spirou G, Levinson SR & von Gersdorff H (2005). Presynaptic Na+ channels: locus, development, and recovery from inactivation at a high‐fidelity synapse. J Neurosci 25, 3724–3738. [DOI] [PMC free article] [PubMed] [Google Scholar]
- Leão RM & von Gersdorff H (2002). Noradrenaline increases high‐frequency firing at the calyx of Held synapse during development by inhibiting glutamate release. J Neurophysiol 87, 2297–2306. [DOI] [PubMed] [Google Scholar]
- Leao RN, Svahn K, Berntson A & Walmsley B (2005). Hyperpolarization‐activated (I h) currents in auditory brainstem neurons of normal and congenitally deaf mice. Eur J Neurosci 22, 147–157. [DOI] [PubMed] [Google Scholar]
- Lorteije JAM, Rusu SI, Kushmerick C & Borst JGG (2009). Reliability and precision of the mouse calyx of Held synapse. J Neurosci 29, 13770–13784. [DOI] [PMC free article] [PubMed] [Google Scholar]
- Macica CM, von Hehn CAA, Wang L‐Y, Ho C‐S, Yokoyama S, Joho RH & Kaczmarek LK (2003). Modulation of the Kv3.1b potassium channel isoform adjusts the fidelity of the firing pattern of auditory neurons. J Neurosci 23, 1133–1141. [DOI] [PMC free article] [PubMed] [Google Scholar]
- Marrs GS & Spirou GA (2012). Embryonic assembly of auditory circuits: spiral ganglion and brainstem. J Physiol 590, 2391–2408. [DOI] [PMC free article] [PubMed] [Google Scholar]
- Moody WJ & Bosma MM (2005). Ion channel development, spontaneous activity, and activity‐dependent development in nerve and muscle cells. Physiol Rev 85, 883–941. [DOI] [PubMed] [Google Scholar]
- Morest DK (1968). The growth of synaptic endings in the mammalian brain: a study of the calyces of the trapezoid body. Z Anat Entwicklungsgesch 127, 201–220. [DOI] [PubMed] [Google Scholar]
- Nakamura PA & Cramer KS (2011). Formation and maturation of the calyx of Held. Hear Res 276, 70–78. [DOI] [PMC free article] [PubMed] [Google Scholar]
- Peusner KD, Gamkrelidze G & Giaume C (1998). Potassium currents and excitability in second‐order auditory and vestibular neurons. J Neurosci Res 53, 511–520. [DOI] [PubMed] [Google Scholar]
- Ramoa AS & McCormick DA (1994). Developmental changes in electrophysiological properties of LGNd neurons during reorganization of retinogeniculate connections. J Neurosci 14, 2089–2097. [DOI] [PMC free article] [PubMed] [Google Scholar]
- Rodríguez‐Contreras A, de Lange RPJ, Lucassen PJ & Borst JGG (2006). Branching of calyceal afferents during postnatal development in the rat auditory brainstem. J Comp Neurol 496, 214–228. [DOI] [PubMed] [Google Scholar]
- Rodríguez‐Contreras A, van Hoeve JS, Habets RLP, Locher H & Borst JGG (2008). Dynamic development of the calyx of Held synapse. Proc Natl Acad Sci USA 105, 5603–5608. [DOI] [PMC free article] [PubMed] [Google Scholar]
- Rodríguez‐Tornos FM, Briz CG, Weiss LA, Sebastián‐Serrano A, Ares S, Navarrete M, Frangeul L, Galazo M, Jabaudon D, Esteban JA & Nieto M (2016). Cux1 enables interhemispheric connections of layer II/III neurons by regulating Kv1‐dependent firing. Neuron 89, 494–506. [DOI] [PubMed] [Google Scholar]
- Rothman JS & Manis PB (2003). The roles potassium currents play in regulating the electrical activity of ventral cochlear nucleus neurons. J Neurophysiol 89, 3097–3113. [DOI] [PubMed] [Google Scholar]
- Rusu SI & Borst JGG (2011). Developmental changes in intrinsic excitability of principal neurons in the rat medial nucleus of the trapezoid body. Dev Neurobiol 71, 284–295. [DOI] [PubMed] [Google Scholar]
- Sanchez JT, Seidl AH, Rubel EW & Barria A (2012). Control of neuronal excitability by NMDA‐type glutamate receptors in early developing binaural auditory neurons. J Physiol 590, 4801–4818. [DOI] [PMC free article] [PubMed] [Google Scholar]
- Santiago C & Bashaw GJ (2014). Transcription factors and effectors that regulate neuronal morphology. Development 141, 4667–4680. [DOI] [PMC free article] [PubMed] [Google Scholar]
- Satheesh SV, Kunert K, Rüttiger L, Zuccotti A, Schönig K, Friauf E, Knipper M, Bartsch D & Nothwang HG (2012). Retrocochlear function of the peripheral deafness gene Cacna1d. Hum Mol Genet 21, 3896–3909. [DOI] [PubMed] [Google Scholar]
- Scott LL, Mathews PJ & Golding NL (2005). Posthearing developmental refinement of temporal processing in principal neurons of the medial superior olive. J Neurosci 25, 7887–7895. [DOI] [PMC free article] [PubMed] [Google Scholar]
- Sendin G, Bourien J, Rassendren F, Puel JL & Nouvian R (2014). Spatiotemporal pattern of action potential firing in developing inner hair cells of the mouse cochlea. Proc Natl Acad Sci USA 111, 1999–2004. [DOI] [PMC free article] [PubMed] [Google Scholar]
- Shah RD & Crair MC (2008). Mechanisms of response homeostasis during retinocollicular map formation. J Physiol 586, 4363–4369. [DOI] [PMC free article] [PubMed] [Google Scholar]
- Sonntag M, Englitz B, Kopp‐Scheinpflug C & Rübsamen R (2009). Early postnatal development of spontaneous and acoustically evoked discharge activity of principal cells of the medial nucleus of the trapezoid body: an in vivo study in mice. J Neurosci 29, 9510–9520. [DOI] [PMC free article] [PubMed] [Google Scholar]
- Soria Van Hoeve J & Borst JGG (2010). Delayed appearance of the scaffolding proteins PSD‐95 and Homer‐1 at the developing rat calyx of Held synapse. J Comp Neurol 518, 4581–4590. [DOI] [PubMed] [Google Scholar]
- Spitzer NC, Kingston PA, Manning TJ & Conklin MW (2002). Outside and in: development of neuronal excitability. Curr Opin Neurobiol 12, 315–323. [DOI] [PubMed] [Google Scholar]
- Steinert JR, Postlethwaite M, Jordan MD, Chernova T, Robinson SW & Forsythe ID (2010). NMDAR‐mediated EPSCs are maintained and accelerate in time course during maturation of mouse and rat auditory brainstem in vitro . J Physiol 588, 447–463. [DOI] [PMC free article] [PubMed] [Google Scholar]
- Taschenberger H, Scheuss V & Neher E (2005). Release kinetics, quantal parameters and their modulation during short‐term depression at a developing synapse in the rat CNS. J Physiol 568, 513–537. [DOI] [PMC free article] [PubMed] [Google Scholar]
- Taschenberger H & von Gersdorff H (2000). Fine‐tuning an auditory synapse for speed and fidelity: developmental changes in presynaptic waveform, EPSC kinetics, and synaptic plasticity. J Neurosci 20, 9162–9173. [DOI] [PMC free article] [PubMed] [Google Scholar]
- Traynelis SF (1998). Software‐based correction of single compartment series resistance errors. J Neurosci Methods 86, 25–34. [DOI] [PubMed] [Google Scholar]
- Tritsch NX & Bergles DE (2010). Developmental regulation of spontaneous activity in the mammalian cochlea. J Neurosci 30, 1539–1550. [DOI] [PMC free article] [PubMed] [Google Scholar]
- Tritsch NX, Rodríguez‐Contreras A, Crins TTH, Wang HC, Borst JGG & Bergles DE (2010). Calcium action potentials in hair cells pattern auditory neuron activity before hearing onset. Nat Neurosci 13, 1050–1052. [DOI] [PMC free article] [PubMed] [Google Scholar]
- Tritsch NX, Yi E, Gale JE, Glowatzki E & Bergles DE (2007). The origin of spontaneous activity in the developing auditory system. Nature 450, 50–55. [DOI] [PubMed] [Google Scholar]
- Turrigiano GG & Nelson SB (2004). Homeostatic plasticity in the developing nervous system. Nat Rev Neurosci 5, 97–107. [DOI] [PubMed] [Google Scholar]
- Walmsley B, Berntson A, Leao RN & Fyffe REW (2006). Activity‐dependent regulation of synaptic strength and neuronal excitability in central auditory pathways. J Physiol 572, 313–321. [DOI] [PMC free article] [PubMed] [Google Scholar]
- Wang HC & Bergles DE (2015). Spontaneous activity in the developing auditory system. Cell Tissue Res 361, 65–75. [DOI] [PMC free article] [PubMed] [Google Scholar]
- Warren RA & Jones EG (1997). Maturation of neuronal form and function in a mouse thalamo‐cortical circuit. J Neurosci 17, 277–295. [DOI] [PMC free article] [PubMed] [Google Scholar]
- West AE & Greenberg ME (2011). Neuronal activity‐regulated gene transcription in synapse development and cognitive function. Cold Spring Harb Perspect Biol 3, a005744. [DOI] [PMC free article] [PubMed] [Google Scholar]
- Williams SR & Mitchell SJ (2008). Direct measurement of somatic voltage clamp errors in central neurons. Nat Neurosci 11, 790–798. [DOI] [PubMed] [Google Scholar]
- Wimmer VC, Nevian T & Kuner T (2004). Targeted in vivo expression of proteins in the calyx of Held. Pflugers Arch 449, 319–333. [DOI] [PubMed] [Google Scholar]
- Wolfram V & Baines RA (2013). Blurring the boundaries: developmental and activity‐dependent determinants of neural circuits. Trends Neurosci 36, 610–619. [DOI] [PMC free article] [PubMed] [Google Scholar]
- Wolfram V, Southall TD, Günay C, Prinz AA, Brand AH & Baines RA (2014). The transcription factors islet and Lim3 combinatorially regulate ion channel gene expression. J Neurosci 34, 2538–2543. [DOI] [PMC free article] [PubMed] [Google Scholar]
- Yang B, Desai R & Kaczmarek LK (2007). Slack and Slick KNa channels regulate the accuracy of timing of auditory neurons. J Neurosci 27, 2617–2627. [DOI] [PMC free article] [PubMed] [Google Scholar]
- Yin J & Yuan Q (2015). Structural homeostasis in the nervous system: a balancing act for wiring plasticity and stability. Front Cell Neurosci 8, 439. [DOI] [PMC free article] [PubMed] [Google Scholar]
- Zhou F‐M & Hablitz JJ (1996). Postnatal development of membrane properties of layer I neurons in rat neocortex. J Neurosci 16, 1131–1139. [DOI] [PMC free article] [PubMed] [Google Scholar]