

Abstract
Key points
Spinocerebellar ataxia type 1 (SCA1) is a progressive neurodegenerative disease caused by a gene defect, leading to movement disorder such as cerebellar ataxia.
It remains largely unknown which functional defect contributes to the cerebellar ataxic phenotype in SCA1.
In this study, we report progressive dysfunction of metabotropic glutamate receptor (mGluR) signalling, which leads to smaller slow synaptic responses, reduced dendritic Ca2+ signals and impaired synaptic plasticity at cerebellar synapses, in the early disease stage of SCA1 model mice.
We also show that enhancement of mGluR signalling by a clinically available drug, baclofen, leads to improvement of motor performance in SCA1 mice.
SCA1 is an incurable disease with no effective treatment, and our results may provide mechanistic grounds for targeting mGluRs and a novel drug therapy with baclofen to treat SCA1 patients in the future.
Abstract
Spinocerebellar ataxia type 1 (SCA1) is a progressive neurodegenerative disease that presents with cerebellar ataxia and motor learning defects. Previous studies have indicated that the pathology of SCA1, as well as other ataxic diseases, is related to signalling pathways mediated by the metabotropic glutamate receptor type 1 (mGluR1), which is indispensable for proper motor coordination and learning. However, the functional contribution of mGluR signalling to SCA1 pathology is unclear. In the present study, we show that SCA1 model mice develop a functional impairment of mGluR signalling which mediates slow synaptic responses, dendritic Ca2+ signals, and short‐ and long‐term synaptic plasticity at parallel fibre (PF)–Purkinje cell (PC) synapses in a progressive manner from the early disease stage (5 postnatal weeks) prior to PC death. Notably, impairment of mGluR‐mediated dendritic Ca2+ signals linearly correlated with a reduction of PC capacitance (cell surface area) in disease progression. Enhancement of mGluR signalling by baclofen, a clinically available GABAB receptor agonist, led to an improvement of motor performance in SCA1 mice and the improvement lasted ∼1 week after a single application of baclofen. Moreover, the restoration of motor performance in baclofen‐treated SCA1 mice matched the functional recovery of mGluR‐mediated slow synaptic currents and mGluR‐dependent short‐ and long‐term synaptic plasticity. These results suggest that impairment of synaptic mGluR cascades is one of the important contributing factors to cerebellar ataxia in early and middle stages of SCA1 pathology, and that modulation of mGluR signalling by baclofen or other clinical interventions may be therapeutic targets to treat SCA1.
Keywords: calcium imaging, cerebellar ataxia, metabotropic glutamate receptor, purkinje cell, synaptic plasticity
Key points
Spinocerebellar ataxia type 1 (SCA1) is a progressive neurodegenerative disease caused by a gene defect, leading to movement disorder such as cerebellar ataxia.
It remains largely unknown which functional defect contributes to the cerebellar ataxic phenotype in SCA1.
In this study, we report progressive dysfunction of metabotropic glutamate receptor (mGluR) signalling, which leads to smaller slow synaptic responses, reduced dendritic Ca2+ signals and impaired synaptic plasticity at cerebellar synapses, in the early disease stage of SCA1 model mice.
We also show that enhancement of mGluR signalling by a clinically available drug, baclofen, leads to improvement of motor performance in SCA1 mice.
SCA1 is an incurable disease with no effective treatment, and our results may provide mechanistic grounds for targeting mGluRs and a novel drug therapy with baclofen to treat SCA1 patients in the future.
Abbreviations
- ATXN1[Q30]
human Ataxin‐1 with 30 repeats containing a 28‐glutamine tract interrupted by two histidines
- ATXN1[Q76]
human Ataxin‐1 with 76 uninterrupted glutamine repeats
- BDNF
brain‐derived neurotrophic factor
- Calbindin
calbindin D‐28k
- C57BL/6 mice
C57 black 6 mice
- CF
climbing fibre
- CPCCOEt
7‐hydroxyiminocyclopropan[b]chromen‐1a‐carboxylate ethyl ester
- ER
endoplasmic reticulum
- D‐AP5
D‐(‐)‐2‐amino‐5‐phosphonopentanoic acid
- GFP
green fluorescent protein
- GPCR
G‐protein‐coupled receptor
- IP3
inositol 1,4,5‐triphosphate
- LTD
long‐term depression
- mGluR
metabotropic glutamate receptor
- mGluR1
metabotropic glutamate receptor type 1
- MSCV
murine embryonic stem cell virus
- NBQX
2,3‐dioxo‐6‐nitro‐1,2,3,4‐tetrahydrobenzo[f]quinoxaline‐7‐sulfonamide
- PAM
positive allosteric modulator
- PC
Purkinje cell
- PF
parallel fibre
- PPD
paired‐pulse depression
- PPF
paired‐pulse facilitation
- RORα
retinoid‐related orphan receptor α
- SCA1
spinocerebellar ataxia type 1
- SCA1‐Tg
heterozygous transgenic SCA1 model mice
- ROI
region of interest
- SERCA2
sarcoplasmic endoplasmic reticulum calcium ATPase type 2
- SSE
synaptically evoked suppression of excitation
- TRPC3
cation‐permeable canonical transient receptor potential type 3
- TU
transduction units
Introduction
Spinocerebellar ataxia type 1 (SCA1) is an inherited neurodegenerative disease, caused by a mutant Ataxin‐1 gene with an abnormally expanded polyglutamine tract (Orr, 2012). SCA1 exhibits cerebellar ataxia and motor learning defects in a progressive manner (Orr, 2012). SCA1 pathogenesis is closely related to gene regulation by the transcription factor retinoid‐related orphan receptor α (RORα), which is abundantly expressed in cerebellar Purkinje cells (PCs) (Serra et al. 2006). Normal Ataxin‐1 forms a transcriptional complex with RORα via the transcriptional coactivator Tip60 and this complex transactivates RORα target genes (Serra et al. 2006). The mutant disease‐causing Ataxin‐1 prevents its interaction with RORα and enhances RORα degradation with unknown mechanisms, causing a subsequent decrease in RORα‐mediated gene expression (Serra et al. 2006). Downregulated gene sets in SCA1 model mice overlap considerably with those in mice with classical RORα‐deficient mutation, staggerer (Serra et al. 2006), which causes congenital ataxia and cerebellar hypoplasia (Sidman et al. 1962).
Our previous study showed that metabotropic glutamate receptor type 1 (mGluR1)‐mediated signalling at cerebellar parallel fibre (PF)–PC synapses is completely disrupted in homozygous staggerer mutant mice (Mitsumura et al. 2011). Moreover, previous studies have implied that the pathology of SCA1, as well as other ataxic diseases (Schorge et al. 2010; Bezprozvanny, 2011; Becker, 2014), is closely related to signalling pathways mediated by mGluR1 (Lin et al. 2000; Serra et al. 2004, 2006; Zu et al. 2004), which is essential for proper motor coordination and learning (Ferraguti et al. 2008; Kano et al. 2008). Specifically, mGluR1‐related signalling molecules including mGluR1, Homer‐3 (adaptor protein of mGluR1), cation‐permeable canonical transient receptor potential type 3 (TRPC3) channels, protein kinase Cγ and inositol 1,4,5‐triphosphate (IP3) receptor 1 are reduced in SCA1 model mice (Lin et al. 2000; Serra et al. 2004, 2006). On the other hand, it has been proven that abnormalities in cerebellar mGluR1 signalling induce cerebellar ataxia in mice and adult human patients with Hodgkin's disease (paraneoplastic cerebellar ataxia), where autoantibodies against mGluR1 are produced (Ferraguti et al. 2008; Kano et al. 2008). Therefore, impairment of cerebellar mGluR signalling may play an important role in clinical ataxic phenotypes, and it is a reasonable hypothesis that impaired mGluR signalling may be one of the major causes of ataxia in SCA1 pathology. However, the functional contribution of mGluR signalling to SCA1 pathology remains unclear. In the present study, we show that SCA1 model mice (Burright et al. 1995) develop impairment of mGluR1‐mediated responses at PF‐PC synapses in a progressive manner before PC death. Slow synaptic responses and short‐ and long‐term synaptic plasticity, which are all mediated by mGluR1s (Ferraguti et al. 2008; Kano et al. 2008; Hartmann et al. 2011), were disrupted in PCs of SCA1 mice. Furthermore, fast confocal Ca2+ imaging revealed that PCs in SCA1 mice exhibit reduced mGluR1‐mediated dendritic Ca2+ signals, which were not detected in a previous widefield fluorescence imaging study (Inoue et al. 2001). Utilizing a modulatory effect of baclofen, a clinically approved GABAB receptor agonist, on mGluR1s (Tabata & Kano, 2006), we found that enhancement of cerebellar mGluR1 signalling by baclofen led to an improvement of motor performance in SCA1 mice for ∼1 week. In SCA1 mice treated with baclofen, the restoration of motor performance matched the functional recovery of mGluR1‐mediated slow synaptic responses, and short‐ and long‐term synaptic plasticity. These results suggest that disrupted mGluR signalling, including reduced dendritic Ca2+ signals and impaired synaptic plasticity at PF‐PC synapses, contributes to SCA1 pathology and thus we propose that enhancement of cerebellar mGluR signalling by baclofen or other drugs (Notartomaso et al. 2013) can ameliorate ataxia in SCA1.
Methods
Ethical approval
All procedures for the care and treatment of animals were carried out according to the Japanese Act on the Welfare and Management of Animals and the Guidelines for the Proper Conduct of Animal Experiments issued by the Science Council of Japan. The experimental protocols were approved by Gunma University Animal Care and Experimentation Committee (07‐015 and 04‐44), and comply with the principles outlined in UK legislation on animal studies. All efforts were made to minimize suffering and to reduce the number of animals used in this study. In most experiments, we used transgenic SCA1 model mice (SCA1‐Tg; heterozygous B05 line carrying the human Ataxin‐1 gene with an extended 82 glutamine tract under control of the PC‐specific L7 promoter) and wild‐type (WT) mice of both sexes of the FVB background (Burright et al. 1995). For viral expression experiments, C57BL/6 mice were used. SCA1‐Tg mice were kindly provided by Dr Harry T. Orr at the University of Minnesota, Minneapolis, MN, USA.
Electrophysiology
Parasagittal cerebellar slices (200 μm in thickness) were prepared, and whole‐cell recordings were conducted as described previously (Torashima et al. 2009). Briefly, mice were deeply anaesthetized by inhalation of isoflurane (3%) and killed by decapitation. The whole brain was quickly dissected out and immersed for several minutes in an ice‐cold solution containing the following (in mm): 234 sucrose, 26 NaHCO3, 2.5 KCl, 1.25 NaH2PO4, 11 glucose, 10 MgSO4 and 0.5 CaCl2; pH 7.4, when bubbled with 95% O2 and 5% CO2. Parasagittal slices of cerebellar vermis were obtained using a microslicer (ZERO1; Dosaka EM, Kyoto, Japan). The slices were maintained for at least 45 min before starting the recordings in an extracellular solution containing the following (in mm): 125 NaCl, 2.5 KCl, 2 CaCl2, 1 MgCl2, 1.25 NaH2PO4, 26 NaHCO3, 10 d‐glucose and 0.05–0.1 picrotoxin. This solution was bubbled continuously with a mixture of 95% O2 and 5% CO2 at room temperature. Whole‐cell recordings were made from PCs using an intracellular solution containing the following (in mm): 140 caesium gluconate, 8 KCl, 10 Hepes, 1 MgCl2, 2 MgATP, 0.4 NaGTP, 0.2 EGTA (pH 7.3 adjusted with CsOH). PCs were voltage‐clamped at −70 mV to record PF excitatory postsynaptic currents (EPSCs) and at −10 mV to record climbing fibre (CF) EPSCs. Selective stimulation of CFs and PFs was confirmed by paired‐pulse depression and paired‐pulse facilitation of EPSC amplitudes (at a 50‐ms interstimulus interval), respectively. For the recordings of mGluR1‐mediated slow EPSCs, the strength of the electrical stimulation was adjusted to produce AMPA receptor‐mediated fast EPSCs with an amplitude of ∼500 pA. We subsequently applied 2,3‐dioxo‐6‐nitro‐1,2,3,4‐tetrahydrobenzo[f]quinoxaline‐7‐sulfonamide (NBQX, 20 μm), an AMPA‐type glutamate receptor antagonist, and slow EPSCs were elicited by applying 10 or 25 electrical stimuli to PFs at 200 Hz.
For analysis of long‐term depression (LTD), PF EPSCs were monitored every 10 s. We always confirmed the stability of PF EPSCs for at least 10 min before LTD induction. Series resistance (pipette access resistance) was continuously monitored every 10 s by applying small hyperpolarizing pulses. When the resistance values changed by >20% of its basal value during the course of the experiment, those data were discarded. To induce LTD, we applied conjunctive stimulation which consisted of 30 single PF stimuli paired with single 200 ms depolarizing pulses (−70 to +20 mV) repeated at 1 Hz. Averaged amplitudes of PF EPSCs over 1 min were normalized to the baseline value, which was the average of the 5 min responses (30 traces) that occurred just before the conjunctive stimulation.
To examine short‐term synaptic depression (SSE, synaptically evoked suppression of excitation), PF EPSCs were recorded every 5 s. After monitoring basal PF EPSCs for 1 min, we applied PF burst stimulation (a train of 50 stimuli at 100 Hz) to induce SSE. The amplitudes of subsequent PF EPSCs were normalized to the mean basal value of two basal responses evoked before the induction stimulation.
Lentiviral vectors and cerebellar injection
Normal non‐pathogenic ATXN1[Q30] (human Ataxin‐1 with 30 repeats containing a 28‐glutamine tract interrupted by two histidines) (Burright et al. 1995; Orr, 2012) and pathogenic ATXN1[Q76] (human Ataxin‐1 with 76 uninterrupted glutamine repeats) genes were fused with the green fluorescent protein (GFP) gene at their 3′ ends by subcloning each ATXN1 cDNA together with GFP cDNA into a pcDNA3.1 expression vector (Invitrogen, Carlsbad, CA, USA). Next, GFP‐ATXN1[Q30] and GFP‐ATXN1[Q76] vectors were transferred from pcDNA3.1 into the pCL20c lentiviral vector plasmid, which expresses transgenes under control of the murine embryonic stem cell virus (MSCV) promoter. HIV‐derived lentiviral vectors pseudotyped with vesicular stomatitis virus G protein were used in this study (Torashima et al. 2006). The detailed procedure for viral vector production was described in a previous report (Torashima et al. 2006). Viral titres were assessed by counting the number of GFP‐expressing cells following the transduction of HEK 293T cells (Torashima et al. 2006). We used lentiviral vectors expressing GFP‐ATXN1[Q30], GFP‐ATXN1[Q76] or GFP alone with titres of 3.9 ± 0.8 × 10¹⁰ transduction units (TU)/ml (10 batches), 3.9 ± 0.7 × 10¹⁰ TU/ml (10 batches) and 5.0 ± 1.0 × 10¹⁰ TU/ml (3 batches), respectively. The viral solutions were stored at 4°C and used within 1 week. Ten microlitres of lentiviral vector solution was injected into the subarachnoid space over the cerebellar vermis (near lobule VI) of 3‐week‐old (P21‐P25) WT C57BL/6 mice (Torashima et al. 2006) anaesthetized with a mixture of ketamine/xylazine [100/10 mg (kg body weight)−1]. Seven days are reported to be long enough for efficient transduction after lentivirus injection (Torashima et al. 2006; Takayama et al. 2008). Most of the transduced cells were limited to PCs under control of the MSCV promoter (Takayama et al. 2008) (Fig. 5 A–C).
Figure 5. Nuclear aggregate formation, morphology and basal PF EPSC in PCs with virally expressed abnormal Ataxin‐1.
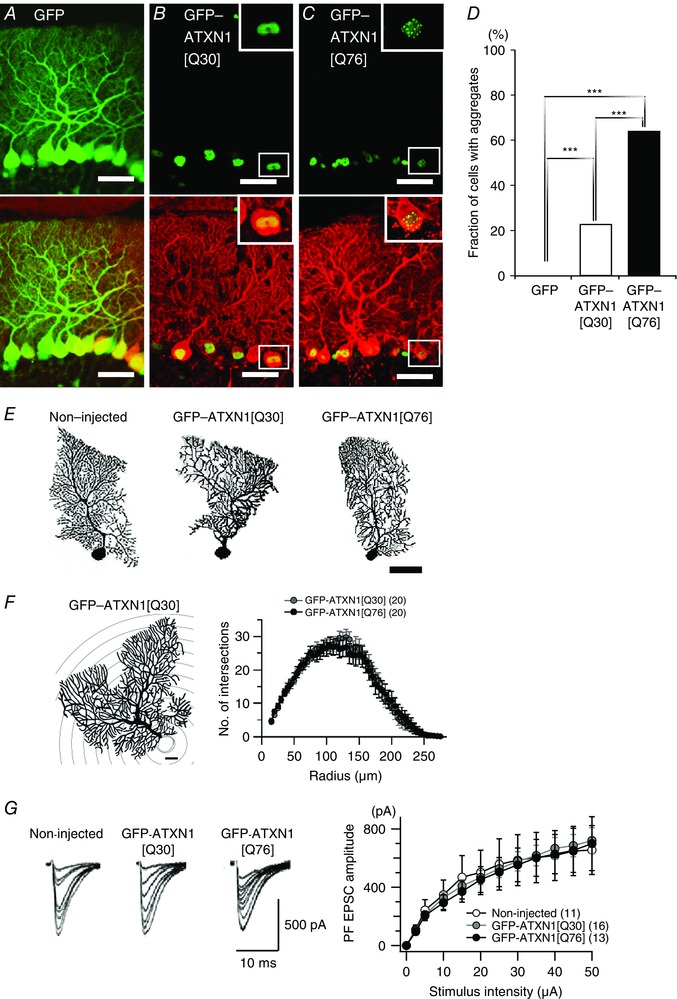
A–C, cerebellar slices from mice treated with lentiviral vectors were immunostained 8 weeks after viral injection. Upper and lower panels show native GFP fluorescence and GFP signal overlapped with Calbindin immunofluorescence, respectively. Insets show enlarged PC somas from white‐boxed areas in the corresponding images. Scale bars = 50 μm. PCs expressing lentivirally transduced GFP (A), non‐pathogenic GFP‐ATXN1[Q30] (B) or abnormal GFP‐ATXN1[Q76] (C). D, summary graph showing the percentages of aggregate‐positive PCs. More than 400 PCs from three mice were examined in each condition. *** P < 0.0001; Fisher's exact test followed by Holm's multiple pairwise correction. E, representative biocytin‐labelled PC images 8 weeks after injection. Scale bar = 50 μm. F, Sholl analysis to examine the complexity of the PC morphology. Left, schematic representation of the analysis. Sampling concentric shells with 20 μm radius steps are shown for illustration. The PC soma (grey) was excluded from the analysis. Scale bar = 20 μm. Right, the average number of intersections between the dendrites and the concentric shells at different distances from the soma. G, stimulus intensity–EPSC amplitude relationship of PF‐PC EPSCs from non‐injected mice and those that received lentiviral vectors expressing GFP‐ATXN1[Q30] or GFP‐ATXN1[Q76]. Left panel shows representative traces of PF EPSCs elicited by increasing electrical stimulation intensity. The number of PCs examined in each group is shown in parentheses. Two‐way repeated measures ANOVAs indicate no significant difference in the dendritic complexity of PCs (F right, genotype effect, F 1,38 = 0.08, P = 0.77; interaction, F 52,1976 = 0.31, P > 0.99) or the PF EPSC amplitudes (G right, genotype effect, F 2,37 = 0.02, P = 0.98; interaction, F 22,407 = 0.16, P > 0.99). [Colour figure can be viewed at wileyonlinelibrary.com]
Baclofen administration
We applied baclofen (Tocris Bioscience, Bristol, UK) to 12‐week‐old WT and SCA1‐Tg mice, directly to the cerebellum. Ten microlitres of PBS with or without 5 nm baclofen was injected using the same method as for the virus injection described above. A rotarod test was started after recovery from anaesthesia (∼3 h after baclofen injection; Day 0). For the electrophysiological experiments of PBS‐ or baclofen‐treated SCA1‐Tg mice (Fig. 8 B–D), those mice also underwent the rotarod tasks.
Figure 8. Baclofen improves rotarod motor performance in SCA1‐Tg mice and the improvement corresponds to restoration of mGluR signalling.
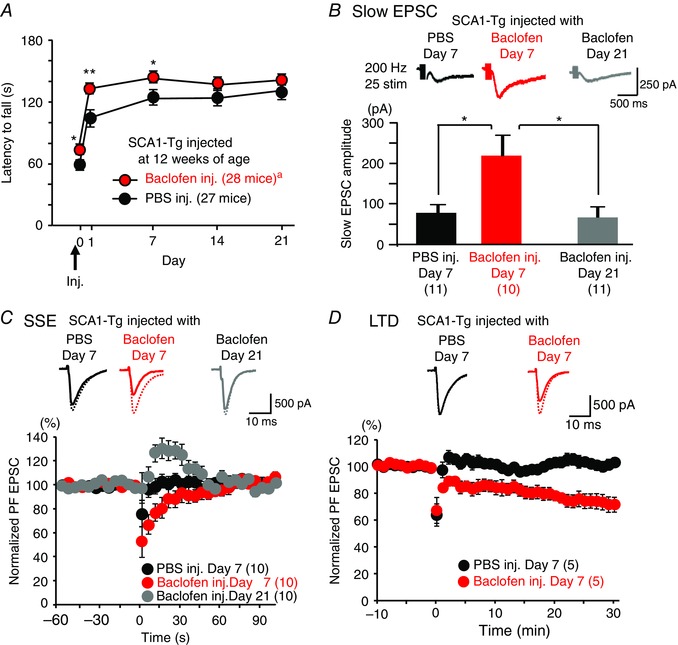
A, motor performance examined by an accelerating rotarod test. Baclofen (5 nm) or PBS was applied to the cerebellum of 12‐week‐old SCA1‐Tg mice 3 h before the rotarod test on day 0 (inj.). aThe sample size is different on days 14 and 21 (27 mice). B and C, transient recovery of mGluR‐mediated slow EPSCs (B) and SSE (C) in cerebellar PCs obtained from the baclofen‐treated SCA1‐Tg mice. This recovery effect lasted until day 7 (red) but vanished at day 21 (grey) after a single application of baclofen (5 nm) to the cerebellum of SCA1‐Tg mice. Upper panel in C shows representative basal EPSCs (broken lines, the last EPSCs just before SSE induction) and the following second EPSCs after SSE induction (continuous lines). D, rescue of LTD in PCs from the baclofen‐treated SCA1‐Tg mice at day 7 after the single baclofen infusion to 12‐week‐old SCA1‐Tg mice (red), in comparison with the PBS‐treated SCA1‐Tg mice at day 7. Upper panel shows fast EPSC traces representative of the baseline responses (broken lines, the last EPSC before LTD induction) and the EPSC 30 min after the conjunctive stimulation for LTD. In C and D, induction stimuli for SSE and LTD were applied at time 0. * P < 0.05; ** P < 0.005. [Colour figure can be viewed at wileyonlinelibrary.com]
Rotarod test
The motor behaviour of SCA1‐Tg mice was assessed by rotarod tests with an accelerating protocol [3 min acceleration from 4 to 40 r.p.m.] at days 0, 1, 7, 14 and 21. The Rota‐Rod Treadmill (MK‐610; Muromachi Kikai, Tokyo, Japan) consisted of a gridded plastic rod (3 cm in diameter, 10 cm long) flanked by two large round black plates (50 cm in diameter). The accelerating protocol contains four trials, with a 30 min interval between trials. We recorded the retention time that the mice spent on the rod. The cutoff time was set to 180 s, and when the retention time (i.e. latency to fall) was over the cutoff time, the trial was interrupted and the cutoff time was recorded. The retention time was automatically measured, and time averaged across all the trials per day was used in the statistical analysis. For mice treated with lentiviral vectors, a constant speed protocol (8 r.p.m.) was used (10 trials at 1 week following injection and 5 trials at 4 and 8 weeks following injection; 30 min rest between trials).
Kinematics of mouse hindlimb
Kinematic analysis of virus‐treated mouse hindlimb was performed as described previously (Endo et al. 2009). Briefly, the mice were anaesthetized with isoflurane (2%), and circular reflective markers (2 mm in diameter) were placed on the shaved skin of the left hindlimb at the iliac crest, the greater trochanter, the knee joint, the malleolus lateralis, the fifth metatarsophalangeal joint and the toe. Limb movements were captured at 200 frames s−1 using a high‐speed digital image camera system (HAS‐220, DITECT, Inc., Tokyo, Japan). Motion analysis was limited to the sagittal plane parallel to the direction of walking. Custom‐designed image analysis software (DIPP‐Motion Pro 2D; DITECT, Inc.) was used to extract the two‐dimensional coordinates of the different joint markers and to reconstruct the stick diagram representation of the hindlimb.
Biocytin infusion to PCs and immunohistochemistry
For visualization of PC morphology, 0.5% biocytin (Sigma‐Aldrich, St Louis, MO, USA) diluted in the intracellular solution was infused by passive diffusion through a patch pipette into whole cell‐clamped PCs. Cerebellar slices were then fixed with 4% paraformaldehyde. After overnight fixation at 4°C, the slices were rinsed in 0.1 m PBS adjusted to pH 7.4 (3 times, 5 min each), permeabilized and blocked with PBS containing 2% (v/v) normal donkey serum, 0.1% (v/v) Triton X‐100 and 0.05% NaN3 (blocking solution). The slices were then rinsed in 0.1 m PBS, pH 7.4 (3 times, 5 min each), and treated with streptavidin‐conjugated Alexa 594 (2 μg ml−1, Invitrogen) for 2 h at room temperature. Visualized PC morphology was analysed using a confocal laser‐scanning microscope (LSM 5 PASCAL, Carl Zeiss, Oberkochen, Germany). The cerebellar slices were scanned with an 8‐bit grey scale at 1 μm intervals in a Z‐stack mode to project a whole dendritic tree onto a planar image. For Sholl analysis, the dendritic arbors of the visualized PCs were traced manually, and the number of intersections between the arbor and a series of sampling concentric shells with incremental distance from the centre of the soma (Fig. 5 F; 15 μm starting radius; 5 μm radius step size) was counted by the Sholl analysis plug‐in in ImageJ software (Ferreira et al. 2014).
For immunohistochemistry, mice were perfused transcardially with a fixative containing 4% paraformaldehyde in 0.1 m phosphate buffer after being anaesthetized deeply. The whole brain was removed and postfixed in the same fixative for 5–6 h or overnight. The cerebellar vermis was cut into 50 μm sagittal sections. After a blocking step for ∼30 min at room temperature, the free‐floating sections were treated with mouse monoclonal anti‐calbindin D‐28 k (Calbindin) (1:1000, Swant, Bellinzona, Switzerland) and/or rabbit polyclonal anti‐mGluR1α (1:300, Frontier Institute, Ishikari, Japan) antibodies overnight at 4°C. Then, the slices were visualized by several hours of incubation at room temperature with Alexa Fluor 594‐conjugated donkey anti‐mouse IgG (1:1000, Life Technologies, Carlsbad, CA, USA), Alexa Fluor 680‐conjugated donkey anti‐mouse IgG (1:1000, Life Technologies) or Alexa Fluor 488‐conjugated donkey anti‐rabbit IgG (1:1000, Life Technologies). The antibodies were dissolved in a PBS solution containing 2% (w/v) bovine serum albumin, 1% (v/v) normal donkey serum, 0.3% (v/v) Triton X‐100 and 0.03% NaN3. Confocal fluorescence images of the cerebellar slices were obtained from the corresponding region of the cerebellum for comparison (Fig. 2 D, near the base of lobule VI).
Figure 2. Progressive disruption of mGluR1‐mediated slow EPSCs and synaptic plasticity at PF‐PC synapses in SCA1‐Tg mice.
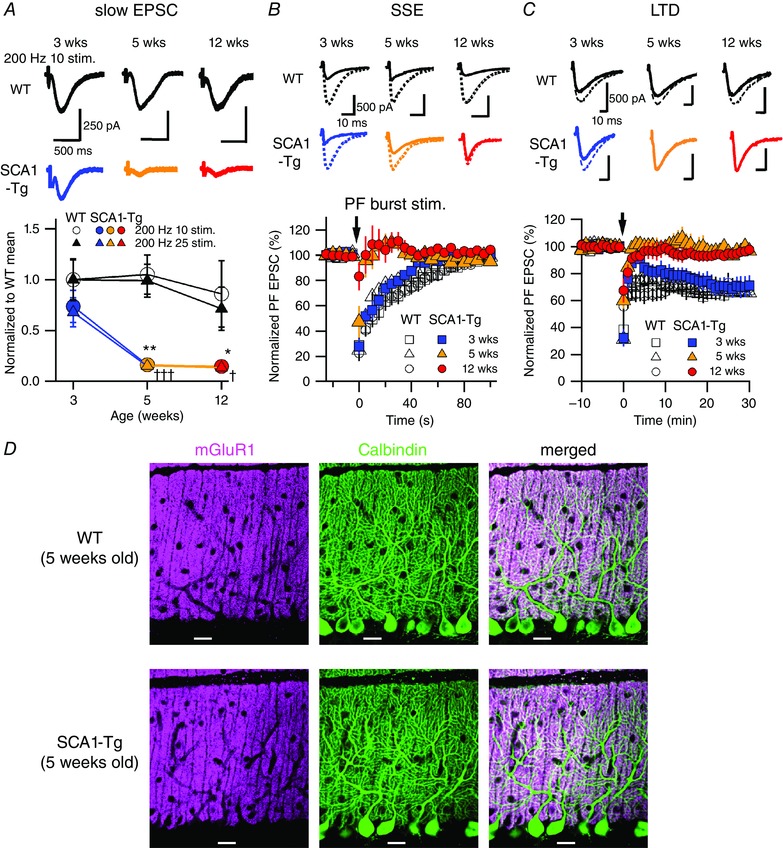
A, traces of mGluR1‐mediated slow EPSCs recorded from PCs in WT mice (top) and in SCA1‐Tg mice (middle) with AMPA receptors blocked by NBQX (20 μm). Stimulus artefacts are partially truncated. Bottom, pooled data of the recorded slow EPSCs normalized to the 3‐week‐old WT mean value in 10 or 25 pulses at 200 Hz. Two‐way ANOVAs with genotype (WT and SCA1‐Tg) and age (3, 5 and 12 weeks old) as factors indicate significant effects of genotype with no significant interaction (genotype × age) in both the stimulus patterns (200 Hz 10 stim.; genotype F 1,64 = 17.16, P = 0.0001; age F 2,64 = 2.21, P = 0.12; interaction F 2,64 = 1.68, P = 0.20; comparison between WT and SCA1‐Tg mice, 3 weeks P = 0.28, 5 weeks ** P < 0.005, 12 weeks * P < 0.05: 200 Hz 25 stim.; genotype F 1,64 = 22.53, P < 0.0001; age F 2,64 = 4.14, P = 0.02; interaction F 2,64 = 1.59, P = 0.21; comparison between WT and SCA1‐Tg mice, 3 weeks P = 0.11, 5 weeks ††† P < 0.001, 12 weeks † P < 0.05). B and C, top and middle, traces of AMPA receptor‐mediated fast PF‐evoked EPSCs before (broken lines) and after (continuous lines) induction of mGluR1‐dependent short‐term (B, SSE; 1st EPSC traces after the PF bursts) and long‐term synaptic plasticity (C, LTD; EPSC traces 30 min after the conjunctive stimuli). Bottom, pooled data of the fast EPSC amplitudes normalized to the baseline period before and after the induction stimuli (arrows) of SSE (B) and LTD (C). D, confocal images of the cerebellar slices double‐immunostained for mGluR1 (magenta) and Calbindin (green; a PC‐specific marker). Scale bars = 20 μm. [Colour figure can be viewed at wileyonlinelibrary.com]
Confocal Ca2+ imaging
Parasagittal slices (250–300 μm in thickness) of the cerebellar vermis were prepared and maintained in a solution (ACSF) containing (in mm) 125 NaCl, 2.5 KCl, 2 CaCl2, 1 MgCl2, 1.25 NaH2PO4, 26 NaHCO3 and 20 d‐glucose, and bubbled with 95% O2 and 5% CO2 at room temperature for more than 1 h before the beginning of recordings. Whole‐cell recordings were performed from the somata of PCs (voltage clamped at −70 mV) using patch pipettes (2.5–4 MΩ) pulled from borosilicate glass (Harvard Apparatus, Holliston, MA, USA). The pipette solution contained (in mm) 135–140 potassium gluconate, 10 Hepes, 5 KCl, 5 NaCl, 5 Mg‐ATP, 0.5 Na‐GTP and 0.1 Oregon Green 488 BAPTA‐1 (a high‐affinity Ca2+ indicator dye); pH 7.3. PCs were loaded with the dye for at least 25 min through the patch pipette to let the dye diffuse into the dendrites. During recordings, ACSF extracellular solution was always supplemented with picrotoxin (50–100 μm) to block the inhibitory synaptic transmission mediated by GABAA receptors. PFs were stimulated by applying square pulses (60 μs, 5–100 μA) through a glass pipette filled with the extracellular solution. To facilitate locating the stimulated dendritic area of PCs in a confocal image, the stimulation pipette tip was visualized by dipping it in a PBS solution containing 0.1–0.2% Alexa Fluor 488‐conjugated goat anti‐rabbit IgG (Life Technologies) for 3–10 s before use (Ishikawa et al. 2010). Fluorescence of the stimulus pipette tip, placed on the surface of the molecular layer, never interfered with PC dendritic Ca2+ signals, because the focal plane of the pipette tip was always well above that of the recorded PC dendrites. For recording Ca2+ signals, confocal fluorescence images were acquired at ∼30 frames s−1 (33 ms exposure time, 512 × 512 pixels, no binning) with a 40× water immersion objective (LUMPLFLN 40XW, Olympus, Tokyo, Japan), a water‐cooled CCD camera (iXon3 DU‐897E‐CS0‐#BV‐500, Andor, Belfast, UK) and a high‐speed spinning‐disc confocal unit (CSU‐X1, Yokogawa Electric, Tokyo, Japan) attached to an upright microscope (BX51WI, Olympus). An imaging area of the PC dendrites (i.e. a focal plane of the dye‐filled recorded PC) was selected such that the visible region of a monoplanar PC dendritic arbor was as large as possible to minimize overlooking out‐of‐focus dendritic Ca2+ signals. More than five regions of interest (ROIs) of similar size (usually tens of ROIs) were chosen on the active dendritic processes, and each ROI included as little non‐fluorescent extracellular space as possible to avoid underestimation of fluorescence (Fig. 3 A, insets). The validity of ROI position was always confirmed on an averaged image or a maximum‐intensity projected image of more than 300 frames (Fig. 3 A, insets). The sizes of the ROIs were much smaller than the entire size of dendritic Ca2+ signal radial spread from a stimulus point. Therefore, with our method, we could minimize the chance of missing or underestimating Ca2+ signals. Mean fluorescence at time t (Ft) in each ROI was background‐subtracted, and Ca2+‐dependent relative increase in fluorescence was measured by calculating ΔF/F basal, where F basal is the basal fluorescence intensity averaged during pre‐stimulus frames and ΔF = Ft – F basal. The background fluorescence was obtained from a region lacking structure of the recorded cell in the same frame. The dendritic Ca2+ trace (ΔF/F basal) from each ROI showed similarity, with some variation (Fig. 3 A). To quantify the Ca2+ signals, peak values, integrals and half‐decay times were measured from all Ca2+ traces, and their maximum values were taken to represent the single recorded cells. To activate mGluRs located perisynaptically at PF‐PC synapses, a brief high‐frequency train stimulus was applied (Mitsumura et al. 2011) and the stimulus strength was adjusted such that amplitudes of the first AMPA receptor‐mediated EPSCs ranged over a few hundred picoamps without direct stimulation of the recorded PCs or CF activation. After identifying dendritic Ca2+ signals evoked by the PF train stimulus, NBQX (10–20 μm) and D‐(‐)‐2‐amino‐5‐phosphonopentanoic acid (D‐AP5, 50–100 μm) were applied extracellularly to isolate mGluR‐mediated dendritic Ca2+ signals, which produce delayed Ca2+ transients (Finch & Augustine, 1998; Takechi et al. 1998). In cases when an initial fast rise of dendritic Ca2+ transient was still obvious and substantial during the stimulus train but fast AMPA receptor‐mediated EPSCs were completely blocked, the remaining early Ca2+ signal was considered to be caused by PC local depolarization due to direct electrical stimulation of the recorded PC, because the fast signal was not affected by the selective mGluR1 antagonist, 7‐hydroxyiminocyclopropan[b]chromen‐1a‐carboxylate ethyl ester (CPCCOEt, 100–200 μm). That PC local depolarization probably activates voltage‐gated Ca2+ channels in PCs (Eilers et al. 1995) and consequently creates the NBQX‐ and CPCCOEt‐insensitive fast Ca2+ signals. Such data were not included in further analysis.
Figure 3. Progressive impairment of local dendritic Ca2+ signalling at PF‐PC synapses in SCA1‐Tg mice.
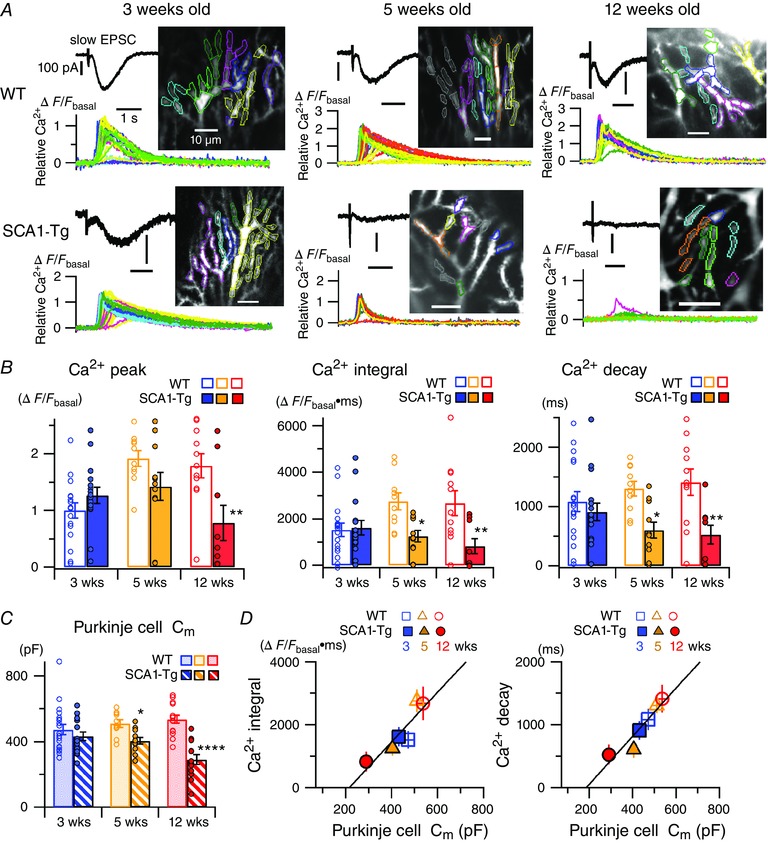
A, traces of mGluR‐mediated PC responses to short PF burst stimulation (10 pulses at 200 Hz) in the presence of NBQX (10–20 μm) and d‐AP5 (50–100 μm). Black and coloured traces show an electrical response (i.e. slow EPSC) and local dendritic Ca2+ signals in a single sweep recording, respectively, in each panel. Inset images show regions of interest (ROIs) on the dendrites of the recorded cells and the individual Ca2+ traces originate from the ROIs with the same colour code in each panel. B and C, pooled data of quantified Ca2+ signals (B, see Methods) and membrane capacitance (C m) (C) of the recorded PCs in 3‐, 5‐ and 12‐week‐old mice. Symbols and bars indicate individual data points and mean values of the data, respectively. Multiple comparisons between WT and SCA1‐Tg mice at each age after two‐way ANOVAs indicate significant differences (* P < 0.05, ** P < 0.005, **** P < 0.0001). All the ANOVAs demonstrate significant genotype effects in Ca2+ peak (F 1,68 = 6.58, P < 0.05), Ca2+ integral (F 1,68 = 13.72, P < 0.0005), Ca2+ decay (F 1,68 = 17.15, P < 0.0001) and C m of PCs (F 1,81 = 31.87, P < 0.0001). D, linear correlation between mean C m values and mean values of the Ca2+ integrals (left, Pearson's correlation coefficient, r = 0.90) or those of the Ca2+ decays (right, r = 0.94). [Colour figure can be viewed at wileyonlinelibrary.com]
The passive electrical properties of the PCs were estimated using averaged traces of ∼20 current responses (acquisition; low‐pass filtered at 10 kHz and sampled at 50 kHz) evoked by hyperpolarizing voltage pulses (from −70 to −75 mV, 500 ms duration). Liquid junction potentials were not corrected in this study. Analysis of electrophysiological and imaging data was performed using pClamp10 (Molecular Devices, Sunnyvale, CA, USA), Andor iQ software (Andor), and Igor Pro (WaveMetrics, Inc., Lake Oswego, OR, USA) with NeuroMatic software (http://www.neuromatic.thinkrandom.com/) and custom‐written procedures.
Statistical analysis
Pooled data are expressed as the mean ± SEM. Statistical analyses of differences were determined by the unpaired Student's t test (Figs 4 D, 7 C, 8 A and D), the Fisher's exact test (Fig. 5 D), repeated‐measures two‐way ANOVA (Figs 1, 4 A, 5 F and G), two‐way ANOVA for independent samples (Figs 2, 3 and Table 1) or one‐way ANOVA (Figs 4 B, 6, 7 A, B and 8 B, C), and the Holm‐Sidak's method or the Tukey's method was used for multiple comparison tests, using GraphPad Prism7 software (Graphpad Software, La Jolla, CA, USA) or the R software statistical package (www.r-project.org). Differences were considered significant at P < 0.05.
Figure 4. Progressive impairment of motor behaviour in mice expressing virally transduced abnormal Ataxin‐1.
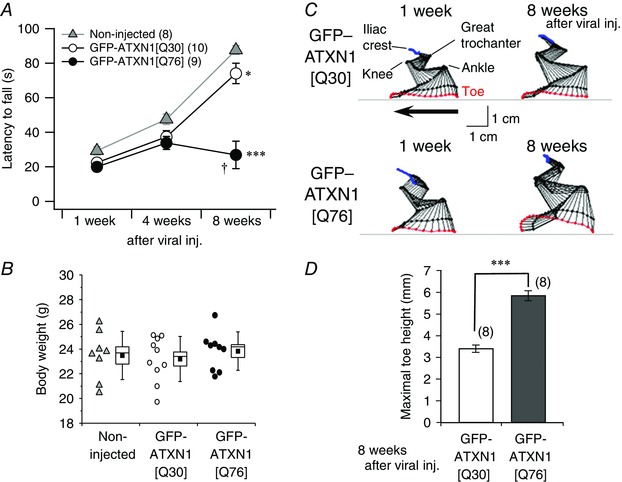
A, averaged data of rotarod performance in naive mice (grey triangles) and age‐matched mice treated with lentiviral vectors expressing normal GFP‐ATXN1[Q30] (open circles) and pathogenic GFP‐ATXN1[Q76] (filled circles) at 1, 4 and 8 weeks after viral injection (viral inj.). The number of mice tested in each group is shown in parentheses. A two‐way repeated measures ANOVA indicates significant effects of genotype (F 2,24 = 21.5, P < 0.0001), time (F 2,48 = 78.0, P < 0.0001) and interaction (F 2,24 = 21.5, P < 0.0001). Multiple comparison tests between genotype at 8 weeks after viral injection show significant differences (* P < 0.05, *** P < 0.0001 in comparison with non‐injected mice; † P < 0.05 compared with GFP‐ATXN1[Q30] mice). B, body weights of the mice not treated and treated with lentiviral vectors expressing GFP‐ATXN1[Q30] or GFP‐ATXN1[Q76] 8 weeks after injection. C, hindlimb kinematic analysis of the mice treated with lentiviral vectors expressing GFP‐ATXN1[Q30] (upper panel) or GFP‐ATXN1[Q76] (lower panel). Stick diagram depicting left hindlimb movement in the mice at 1 and 8 weeks following injection. The arrow indicates the direction of limb movement. D, summary graph showing the maximum toe height of the left hindlimb while walking. *** P < 0.0001. [Colour figure can be viewed at wileyonlinelibrary.com]
Figure 7. Acute bath application of 5 nM baclofen partially enhances remaining mGluR signalling in cerebellar slices of 12‐week‐old SCA1‐Tg mice.
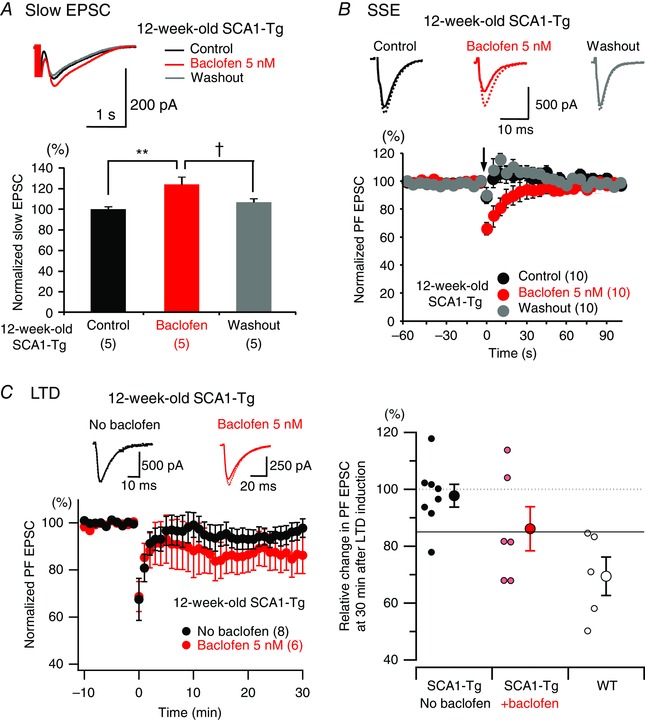
A and B, upper panels show representative traces of remaining slow EPSCs (A, evoked by PF burst stimulation with 25 electrical pulses at 200 Hz; averaged traces from 20 responses) and AMPA receptor‐mediated fast PF EPSCs in SSE experiments (B, broken lines indicate basal PF EPSCs before SSE induction and continuous lines indicate the first EPSCs after the induction) before application (Control, black), in the presence (Baclofen, red) and after washing out (Washout, grey) of 5 nm baclofen. Bar graphs in A show summarized data of the averaged value from 20 responses in each PC of 12‐week‐old SCA1‐Tg mice (** P < 0.01 between Control and Baclofen groups; † P < 0.05 between Baclofen and Washout groups; significance determined by one‐way ANOVA followed by Tukey's post hoc test). Lower panel in B shows the time course of the normalized PF EPSC amplitudes in the SSE experiment of 12‐week‐old SCA1‐Tg mice. C, left upper panel indicates representative basal PF EPSCs (the last EPSC before the induction, broken lines) and the EPSC 30 min after LTD induction (continuous lines). Left lower panel shows the time course of the normalized PF EPSC in LTD experiment of 12‐week‐old SCA1‐Tg mice in the absence and presence of baclofen (5 nm). Baclofen was bath‐applied > 10 min prior to LTD induction. The LTD data set in the absence of baclofen (No baclofen) is the same as presented in Fig. 2 C. Right, relative change in PF EPSC amplitude 30 min after LTD induction in SCA1‐Tg cerebellar slices without baclofen (black filled circles), those in the presence of baclofen (red filled circles) and WT cerebellar slices (open circles). Larger symbols represent mean values and smaller symbols correspond to individual data points. The solid horizontal line indicates 85% relative change, which can be used as a criterion for successful LTD because all the data points in WT range below this line. [Colour figure can be viewed at wileyonlinelibrary.com]
Figure 1. No major change was observed in basal fast excitatory synaptic transmission at PF‐PC synapses in SCA1‐Tg PCs.
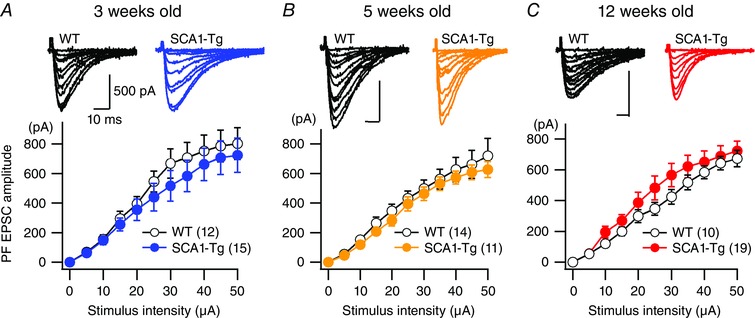
A–C, averaged relationship between stimulus intensity and PF EPSC amplitude of 3‐week‐old (A, presymptomatic), 5‐week‐old (B, early disease stage) and 12‐week‐old (C, middle disease stage) WT (open circles) and SCA1‐Tg (filled circles) mice. Upper panels show representative traces of PF EPSCs. The numbers of tested PCs are indicated in parentheses and all of the data in each condition were obtained from at least three mice in this and subsequent figures and table. At all the ages examined, a repeated‐measures ANOVA indicates no significance for genotype (3 weeks old, F 1,25 = 0.50, P = 0.48; 5 weeks old, F 1,23 = 0.47, P = 0.50; 12 weeks old, F 1,26 = 0.86, P = 0.36) and genotype × stimulus intensity interaction (3 weeks old, F 10,250 = 0.46, P = 0.91; 5 weeks old, F 10,230 = 0.25, P = 0.99; 12 weeks old, F 10,260 = 0.823, P = 0.61). [Colour figure can be viewed at wileyonlinelibrary.com]
Table 1.
Basal AMPA receptor‐mediated fast excitatory postsynaptic current (EPSC) properties of Purkinje cells (PCs) in WT and SCA1‐Tg mice
| PF EPSC | CF EPSC | |||||||
|---|---|---|---|---|---|---|---|---|
| 10–90% | Decay time | 10–90% | Decay time | |||||
| Mice | rise time (ms) | constant (ms) | PPF ratio | Amplitude (pA) | rise time (ms) | constant (ms) | PPD ratio | |
| 3 weeks old | WT | 2.9 ± 0.4 (13) | 9.4 ± 0.9 (13) | 1.7 ± 0.1 (7) | 814.6 ± 80.3 (10) | 1.3 ± 0.2 (9) | 7.9 ± 0.4 (10) | 0.74 ± 0.02 (10) |
| SCA1‐Tg | 2.5 ± 0.2 (15) | 7.9 ± 0.8 (15) | 1.8 ± 0.1 (8) | 801.9 ± 81.3 (10) | 1.2 ± 0.1 (10) | 8.0 ± 0.8 (10) | 0.74 ± 0.01 (10) | |
| 5 weeks old | WT | 3.0 ± 0.2 (14) | 10.9 ± 0.8 (14) | 1.7 ± 0.1 (14) | 840.7 ± 101.4 (10) | 1.3 ± 0.07 (10) | 8.1 ± 0.8 (10) | 0.65 ± 0.04 (10) |
| SCA1‐Tg | 2.6 ± 0.4 (11) | *7.4 ± 0.8 (11) | 1.7 ± 0.1 (11) | 783.1 ± 59.7 (10) | 1.3 ± 0.1 (10) | 8.3 ± 0.7 (10) | 0.70 ± 0.07 (10) | |
| 12 weeks old | WT | 2.8 ± 0.3 (9) | 10.0 ± 1.0 (9) | 1.6 ± 0.2 (9) | 797.3 ± 66.8 (10) | 1.4 ± 0.1 (10) | 8.1 ± 0.8 (10) | 0.71 ± 0.04 (10) |
| SCA1‐Tg | *1.7 ± 0.2 (16) | *, *5.2 ± 0.7 (19) | 1.6 ± 0.1 (19) | 883.2±108.3 (10) | *1.1 ± 0.1 (10) | 7.8 ± 0.5 (10) | 0.76 ± 0.03 (10) | |
PF EPSCs and CF EPSCs were analysed regarding their kinetics (10–90% rise time and decay time constant) and amplitudes. Paired pulse facilitation (PPF) of PF EPSCs and paired pulse depression (PPD) of CF EPSCs were analysed from the responses evoked by two stimuli with an interstimulus interval of 50 ms. Ratios of PPF and PPD were measured as the second EPSC amplitude normalized to the first one. Two‐way ANOVAs with genotype and age as two factors indicate significant effects of genotype only in rise time and decay time constant of PF EPSCs with no age effect or interaction (rise time; genotype, F 1,72 = 7.46, P < 0.01; age, F 2,72 = 1.98, P = 0.16; interaction, F 2,72 = 0.80, P = 0.45: decay time constant; genotype, F 1,75 = 20.42, P < 0.0001; age, F 2,75 = 1.41, P = 0.25; interaction, F 2,75 = 1.84, P = 0.17). Post hoc tests between WT and SCA1‐Tg mice (genotypes) show significant differences at 5 weeks in decay time and at 12 weeks of age in both rise and decay time of PF EPSCs. Multiple comparison test indicates a significant difference of CF EPSC rise time at 12 weeks of age between WT and SCA1‐Tg mice. * P < 0.05, ** P < 0.001. All values are shown as the mean ± SEM. Numbers in parentheses indicate the numbers of Purkinje cells tested.
Figure 6. Impairment of mGluR‐mediated slow EPSCs, SSE and LTD at PF‐PC synapses in mice expressing virally transduced abnormal Ataxin‐1.
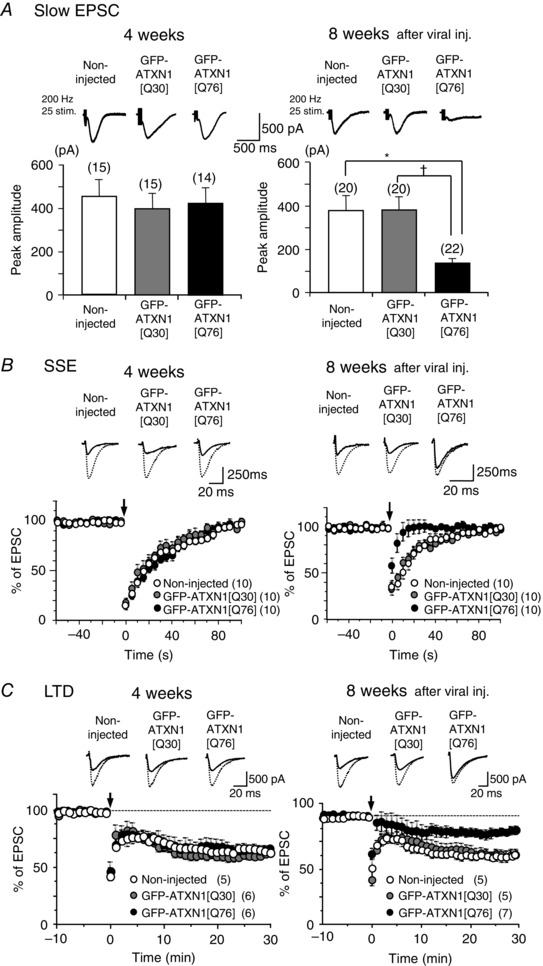
A, upper panel shows representative traces of mGluR‐mediated slow EPSCs recorded from PCs in age‐matched non‐injected mice and those injected with lentiviral vectors expressing non‐pathogenic GFP‐ATXN1[Q30] or abnormal GFP‐ATXN1[Q76]. Stimulus artefacts are partially truncated. Lower panels show pooled data of the slow EPSC amplitudes. * P < 0.01, † P < 0.01; multiple comparison test after one‐way ANOVA. B and C, upper panels show representative traces of AMPA receptor‐mediated fast PF EPSCs before (broken lines) and after (continuous lines) induction of mGluR‐dependent SSE (4 weeks, the first EPSC traces after induction; 8 weeks, the second EPSC traces after induction) or LTD (EPSC traces 30 min after induction). Lower panels show pooled data for the fast PF EPSC amplitudes normalized to the baseline period before and after induction of SSE or LTD at time 0 (arrows).
Results
SCA1 transgenic model mice (Burright et al. 1995) (SCA1‐Tg) exhibit progressive motor deficits (Orr, 2012). Motor abnormality with no major histopathological abnormality starts at ∼5 weeks of age (early disease stage), and SCA1‐Tg mice begin to show clear signs of ataxia by home cage behaviour with significant PC morphological alterations (but without PC loss) at 12 weeks of age (middle disease stage) (Clark et al. 1997; Zu et al. 2004). Taking into account this disease progression time course, we utilized SCA1‐Tg mice at three different ages (3, 5 and 12 weeks, which correspond to presymptomatic, early and middle stages of the disease, respectively) in the present study.
At cerebellar PF‐PC synapses, glutamate is released and activates AMPA receptors, which cause fast EPSCs in PCs (Hartmann et al. 2011). First, we characterized basal synaptic responses at PF‐PC synapses in SCA1‐Tg mice by recording fast AMPA receptor‐mediated EPSCs in response to various stimulus intensities. At all the three ages (3 weeks old at the presymptomatic stage; 5 weeks old at the early disease stage; 12 weeks old at the middle disease stage), there was no significant difference in the amplitudes of the fast EPSCs between WT and SCA1‐Tg mice (Fig. 1, genotype effect; 3 weeks old, P = 0.48; 5 weeks old, P = 0.50; 12 weeks old, P = 0.36). The only notable difference was that the kinetics of the AMPA receptor‐mediated EPSCs was faster in SCA1‐Tg mice than WT mice after 5 weeks of age [Table 1; rise time, post hoc test between WT and SCA1‐Tg mice at 12 weeks of age (P < 0.05) after two‐way ANOVA (only genotype significant, F 1,72 = 7.46, P < 0.01); decay time constant, post hoc tests between WT and SCA1‐Tg mice at 5 weeks (P < 0.05) and 12 weeks (P < 0.001) of age followed by two‐way ANOVA (only genotype significant, F 1.75 = 20.42, P < 0.0001)]. This is in line with the previous studies (Inoue et al. 2001; Watase et al. 2002; Barnes et al. 2011) (but see also Hourez et al. 2011). Even at CF‐PC synapses, SCA1‐Tg mice displayed no major abnormalities in CF to PC innervation (data not shown) or in basal AMPA receptor‐mediated EPSCs (Table 1) (but see also Barnes et al. 2011; Hourez et al. 2011). Although the slight changes in the kinetics of basal EPSCs at PF‐PC or CF‐PC synapses may be ascribed to SCA1‐Tg PCs becoming electrotonically more compact at later stages (Fig. 3 C) due to progressive dendritic atrophy (Clark et al. 1997), the results above suggest that basal AMPA receptor‐mediated fast synaptic transmission to PCs remains nearly intact in SCA1‐Tg mice.
Progressive impairment of mGluR1‐mediated slow currents and synaptic plasticity at cerebellar synapses in SCA1 mice
At cerebellar synapses, perisynaptically located mGluRs are activated by the accumulation of synaptically released glutamate in response to closely timed repetitive PF excitation, and then generate slow EPSCs and synaptic plasticity (Kano et al. 2008; Hartmann et al. 2011). To characterize age‐dependent functional abnormalities in mGluR signalling at PF‐PC synapses in SCA1‐Tg mice, we examined mGluR‐mediated slow EPSCs at the three different ages. In the presence of NBQX (10–20 μm) to block AMPA receptor‐mediated fast EPSCs, PF burst stimulation (10 or 25 pulses at 200 Hz) efficiently evoked slow EPSCs in WT mice at all the ages examined (Fig. 2 A, top). In contrast, mGluR‐mediated slow synaptic responses were significantly reduced in SCA1‐Tg mice at 5 weeks of age (10 pulses, 0.16 ± 0.03, the normalized value to the 3‐week‐old WT mean, comparison between WT and SCA1‐Tg mice after two‐way ANOVA, P < 0.005; 25 pulses, 0.15 ± 0.03, P < 0.001; n = 11 from 4 mice) and older (10 pulses, 0.15 ± 0.03, the normalized value to the 3‐week‐old WT mean, P < 0.05; 20 pulses, 0.13 ± 0.03, P < 0.05; n = 11 from 4 mice), but not at 3 weeks (10 pulses, 0.74 ± 0.16, the normalized value to the 3‐week‐old WT mean, comparison between WT and SCA1‐Tg mice after two‐way ANOVA, P = 0.28; 20 pulses, 0.68 ± 0.14, P = 0.11; n = 15 from 4 mice) (Fig. 2 A). These results may be explained in part by molecular evidence that the gene encoding TRPC3 is downregulated in SCA1‐Tg mice at 4 weeks of age (Lin et al. 2000), because opening of TRPC3 channels underlies the generation of the slow EPSCs downstream of mGluR1 signalling (Hartmann et al. 2008).
The synaptic activation of mGluR1 at PF‐PC synapses induces the local release of endocannabinoid from PCs (Safo et al. 2006; Kano et al. 2008). The released endocannabinoid acts retrogradely on cannabinoid receptors on presynaptic PFs, and then suppresses glutamate release from PF terminals for tens of seconds (Safo et al. 2006; Kano et al. 2008). We examined this type of short‐term plasticity, termed synaptically evoked suppression of excitation (SSE), by monitoring AMPA receptor‐mediated fast EPSCs at PF‐PC synapses after PF burst stimulation to induce SSE (Mitsumura et al. 2011). The SSE measured in WT mice at all ages was similar to that in 3‐week‐old (presymptomatic) SCA1‐Tg mice (Fig. 2 B, black and blue; normalized amplitude of the first EPSC after PF burst: 3‐week‐old WT, 28.7±8.8%, n = 10; 5‐week‐old WT, 24.9±7.8%, n = 10; 12‐week‐old WT, 22.6±6.3%, n = 11; 3‐week‐old SCA1‐Tg, 27.8±6.2%, n = 10). On the other hand, older (5 and 12 weeks old) SCA1‐Tg mice showed progressive impairment of SSE (normalized amplitude of the first EPSC after PF burst: 5‐week‐old SCA1‐Tg, 47.2±12.6%, n = 10; 12‐week‐old SCA1‐Tg, 83.2±11.1%, n = 10; two‐way ANOVA; genotype effect, F 1,55 = 13.6, P < 0.001; age effect, F 2,55 = 3.9, P < 0.05; interaction, F 2,55 = 6.0, P < 0.005) with a dramatically reduced duration of suppression and with slight facilitation (Fig. 2 B). In addition to SSE, another form of synaptic plasticity, i.e. LTD, of fast EPSCs at PF‐PC synapses also requires postsynaptic mGluR1 signalling in PCs (Kano et al. 2008; Gao et al. 2012). We therefore examined LTD in SCA1‐Tg mice. LTD was induced at PF‐PC synapses in 3‐week‐old SCA1‐Tg mice (normalized PF EPSC amplitude at 30 min after induction: 71.1±7.5%, n = 5 from 5 mice) to the same degree as in WT mice at all ages (3 weeks old, 67.7±3.6%, n = 5 from 5 mice; 5 weeks old, 65.9±2.8%, n = 5 from 5 mice; 12 weeks old, 69.4±6.8%, n = 5 from 5 mice) (Fig. 2 C). In contrast, 5‐ and 12‐week‐old SCA1‐Tg mice failed to induce LTD (Fig. 2 C; normalized PF EPSC amplitude at 30 min after induction: 5 weeks old, 96.7±3.0% of the basal response, n = 5 from 5 mice; 12 weeks old, 97.7±4.0%, n = 8 from 7 mice; two‐way ANOVA; genotype effect, F 1,27 = 26.5, P < 0.0001; age effect, F 2,27 = 4.6, P < 0.05; interaction, F 2,27 = 4.5, P < 0.05). Taken together, these results (Fig. 2 A–C) indicate that SCA1‐Tg mice aged 5 weeks (early disease stage) and older exhibit impaired mGluR signalling, which underlies the reduction of slow EPSCs and the abolishment of SSE and LTD at PF‐PC synapses. It should be noted that gross PC morphology and localization of mGluR1 on PCs as revealed by
immunohistochemistry were normal in 5‐week‐old SCA1‐Tg mice at the early disease stage (Fig. 2 D). This result suggests that the functional impairment of mGluRs may begin at 5 weeks of age in SCA1‐Tg mice, prior to any major anatomical alteration.
Progressive reduction of mGluR1‐mediated local dendritic Ca2+ signals and membrane capacitance in SCA1‐Tg PCs
mGluR signalling also evokes local dendritic Ca2+ transients at PF‐PC synapses (Kano et al. 2008; Hartmann et al. 2011; Finch et al. 2012; Gao et al. 2012). After activation of mGluRs, the second messenger IP3 is produced by the Gαq/11 protein‐dependent activity of phospholipase Cβ. In turn, IP3 evokes Ca2+ release from the endoplasmic reticulum (ER), which functions as an internal Ca2+ store in PCs. This IP3‐mediated dendritic Ca2+ signalling plays a critical role in triggering LTD at PF‐PC synapses (Kano et al. 2008; Hartmann et al. 2011; Finch et al. 2012; Gao et al. 2012). To gain mechanistic insights into the loss of LTD in SCA1‐Tg mice, we next examined mGluR‐ and IP3‐mediated local dendritic Ca2+ signalling at PF‐PC synapses using fast confocal Ca2+ imaging techniques (Finch & Augustine, 1998; Takechi et al. 1998). In 3‐week‐old mice, there was no significant difference between WT and SCA1‐Tg mice in the mGluR‐mediated dendritic Ca2+ transient evoked by PF burst stimulation [Fig. 3 A and B; ΔF/F basal peak; WT, 1.00 ± 0.14, n = 17 from 7 mice; SCA1‐Tg, 1.27 ± 0.14, n = 16 from 6 mice; P = 0.25: Ca2+ integral (ΔF/F basal.ms); WT, 1524 ± 283; SCA1‐Tg, 1617 ± 310; P = 0.83: Ca2+ decay time (ms); WT, 1084.0 ± 169.6; SCA1‐Tg, 909.2 ± 150.5; P = 0.40]. In older mice, however, SCA1‐Tg mice showed a significant decrease in the peak of dendritic Ca2+ signalling, compared to age‐matched WT mice at 12 weeks of age (ΔF/F basal peak; WT, 1.79 ± 0.21, n = 11 from 7 mice; 12‐week‐old SCA1‐Tg, 0.78 ± 0.31, n = 9 from 3 mice, P < 0.005) (Fig. 3 A and B). Moreover, the integrals and the decays of the Ca2+ responses were affected at earlier ages (Fig. 3 B; Ca2+ integral; 5‐week‐old WT, 2749 ± 365, n = 10, 4 mice; 5‐week‐old SCA1‐Tg, 1250 ± 244, n = 11, 5 mice: P < 0.05; 12‐week‐old WT, 2675 ± 532, n = 11, 7 mice; 12‐week‐old SCA1‐Tg, 829 ± 322, n = 9, 3 mice: P < 0.005: Ca2+ decay; 5‐week‐old WT, 1302.2 ± 124.0 ms; 5‐week‐old SCA1‐Tg, 603.7 ± 133.1 ms: P < 0.05; 12‐week‐old WT, 1409.3 ± 221.3 ms; 12‐week‐old SCA1‐Tg, 526.1 ± 158.6 ms: P < 0.005). The lack of LTD in SCA1‐Tg mice after 5 weeks of age (Fig. 2 C) can be ascribed to reduced integrals of the dendritic Ca2+ signals (Fig. 3 B), because LTD induction critically depends on the total integrated amount of cytoplasmic Ca2+ in PCs (Finch et al. 2012). Furthermore, we found that the progressive reduction of the mGluR‐mediated Ca2+ signals in SCA1‐Tg mice is linearly correlated with the progressive decrease in PC membrane capacitance (Fig. 3 C and D; 3‐week‐old WT, 472.6 ± 31.5 pF, n = 20 from 8 mice, 3‐week‐old SCA1‐Tg, 431.7 ± 25.9 pF, n = 16 from 7 mice; P = 0.25: 5‐week‐old WT, 510.9 ± 23.3 pF, n = 10 from 4 mice, 5‐week‐old SCA1‐Tg, 404.5 ± 19.7 pF, n = 12 from 5 mice; P < 0.05: 12‐week‐old WT, 536.8 ± 24.0 pF, n = 15 from 7 mice, 12‐week‐old SCA1‐Tg, 290.0 ± 28.7 pF, n = 14 from 4 mice; P < 0.0001), which corresponds to the reduction in surface membrane area of the PCs caused by dendritic atrophy in SCA1‐Tg mice (Clark et al. 1997). This implies that the morphological atrophy of PCs accompanies a functional impairment in mGluR signalling in the disease progression of SCA1, although the complexity of PC dendritic arborization is still preserved at 5 weeks of age, the early stage of the disease (Orr, 2012) (Fig. 2 D).
Lentiviral delivery of SCA1 disease‐causing gene to WT mice disrupts mGluR signalling in PCs
Although the SCA1‐Tg mouse is a useful model for SCA1 pathology (Orr, 2012), developmental influences of the responsible gene for SCA1 in SCA1‐Tg mice might prevent us from concluding that the SCA1‐causing gene leads to impairment of mGluR signalling in PCs. To validate the effect of the disease‐causing, polyglutamine‐expanded abnormal mutant Ataxin‐1 on synaptic abnormalities at PF‐PC synapses without possible developmental defects, we applied lentiviral gene transfer methods to the cerebellum of young adult WT mice (see Methods). When WT mice were injected with the disease‐causing gene of GFP‐ATXN1[Q76], the mice showed deterioration in rotarod performance at 8 weeks after viral injection, compared with control non‐injected mice (Fig. 4 A, filled circles). By contrast, WT mice injected with the non‐disease‐causing gene of GFP‐ATXN1[Q30] displayed only minor defects in rotarod performance, in comparison to the non‐injected mice (Fig. 4 A, open circles). While body weights of the mice treated with GFP‐ATXN1[Q76] were similar to those of the mice untreated or treated with GFP‐ATXN1[Q30] at 8 weeks after viral injection (Fig. 4 B; ANOVA, P = 0.74), hindlimb kinematic analysis during walking revealed abnormal toe trajectories in the mice expressing GFP‐ATXN1[Q76] at 8 weeks after injection, compared to the mice expressing GFP‐ATXN1[Q30] (Fig. 4 C and D, P < 0.0001). These results indicate that the mutant Ataxin‐1 gene with an abnormally expanded polyglutamine tract (Q76) causes motor dysfunction in young adult WT mice.
Anatomically transduced PCs in the mice treated with the disease‐causing GFP‐ATXN1[Q76] frequently exhibited intranuclear aggregates (Fig. 5 C, insets; Fig. 5 D, P < 0.0001), but much less with the non‐disease‐causing GFP‐ATXN1[Q30] and not with GFP at 8 weeks following injection (Fig. 5 A–D; P < 0.0001). Notably, regardless of length of the glutamine tract, GFP‐ATXN1 fusion proteins were localized to the PC nuclei (Fig. 5 B and C), confirming that ATXN1 is a nuclear protein (Orr, 2012). The overall morphology of the transduced PCs in the mice injected with GFP‐ATXN1[Q76] appeared normal (Fig. 5 E), and quantitative analysis of the PC dendritic arbor (Sholl analysis) showed no difference in the complexity of the dendrite between the mice injected with GFP‐ATXN1[Q30] (n = 20 from 11 mice) and those with GFP‐ATXN1[Q76] (n = 20 from 10 mice) at 8 weeks after viral injection (Fig. 5 F, P = 0.77).
There was no difference in the amplitude of basal AMPA receptor‐mediated fast EPSCs at PF–PC synapses between the non‐injected age‐matched mice, the mice with GFP‐ATXN1[Q30] and those with GFP‐ATXN1[Q76] at 8 weeks after viral injection (Fig. 5 G; P = 0.98), at which motor abnormalities were obvious in the mice expressing GFP‐ATXN1[Q76] (Fig. 4). By contrast, mGluR‐mediated responses such as slow EPSCs, SSE and LTD were impaired only in the mice injected with GFP‐ATXN1[Q76] at 8 weeks after viral injection [Fig. 6 A, right; slow EPSC, ANOVA, P < 0.005; non‐injected vs GFP‐ATXN1[Q76], P < 0.01; GFP‐ATXN1[Q30] vs GFP‐ATXN1[Q76], P < 0.01: Fig. 6 B, right; SSE (the normalized second EPSC after induction), ANOVA, P < 0.005; non‐injected vs GFP‐ATXN1[Q76], P < 0.005; GFP‐ATXN1[Q30] vs GFP‐ATXN1[Q76], P < 0.05: Fig. 6 C, right; LTD (the normalized EPSC amplitude 30 min after induction), ANOVA, P < 0.005; non‐injected vs GFP‐ATXN1[Q76], P < 0.005; GFP‐ATXN1[Q30] vs GFP‐ATXN1[Q76], P < 0.005], but not at 4 weeks [Fig. 6 A–C, left; slow EPSCs, ANOVA, P = 0.54; SSE (the normalized first EPSC amplitude after induction), one‐way ANOVA, P = 0.94; LTD (the normalized EPSC amplitude 30 min after induction), ANOVA, P = 0.54]. The mice must have expressed GFP‐ATXN1[Q76] by 4 weeks after injection, because lentiviral vectors require just ∼1 week for efficient expression (Torashima et al. 2006; Takayama et al. 2008). This means that the disease‐causing mutant Ataxin‐1, by itself, may have a delayed effect in young adult mice. The delayed phenotypes described above resemble those in SCA1‐Tg mice (Figs 2 and 3). Collectively, these results suggest that motor defects and the dysfunction of mGluRs mediating slow EPSCs, SSE and LTD at PF‐PC synapses, but not basal fast EPSCs, are caused solely by the mutant Ataxin‐1 gene with an abnormally expanded polyglutamine tract (Q76) in PCs, irrespective of developmental effects of the gene.
Enhancement of mGluR signalling by baclofen improves motor performance in SCA1 mice
It should be noted that the mGluR‐mediated Ca2+ signals in WT PCs were variable (Hartmann et al. 2011), and that those in SCA1‐Tg PCs were significantly impaired but not completely abolished even at 12 weeks of age (Fig. 3 A and B). In addition, immunohistochemical data indicate that the cerebellar distribution of mGluR1 exhibits no major change in SCA1‐Tg mice at 5 weeks of age (Fig. 2 D) or older (Skinner et al. 2001; Zu et al. 2004), although the expression level of mGluR1 decreases in the cerebellum after 5 weeks of age (Serra et al. 2004, 2006; Zu et al.
2004), which corresponds to the time of disease onset in SCA1‐Tg mice (Orr, 2012). These data suggest that mGluR signalling cascades are still functional to some extent in some SCA1‐Tg PCs even after the onset of the disease. Given that ataxia in SCA1‐Tg mice is largely due to impairment of mGluR signalling in PCs (Ferraguti et al. 2008; Kano et al. 2008; Mitsumura et al. 2011; Notartomaso et al. 2013), enhancement of the remaining mGluR signalling in PCs could be a potential therapeutic intervention for the treatment of SCA1 (Notartomaso et al. 2013).
Recent studies have shown that mGluR1 is tightly coupled to GABAB receptors in PCs (Tabata & Kano, 2006) and that activation of GABAB receptors by baclofen potentiates mGluR‐mediated responses, such as slow EPSCs and Ca2+ release from the ER (Tabata & Kano, 2006), leading in turn to LTD enhancement in PCs (i.e. an increase in the magnitude of depression) (Kamikubo et al. 2007). Indeed, we confirmed electrophysiologically that an acute bath application of baclofen (5 nm) partially enhances the remaining mGluR1 signalling in the PCs of 12‐week‐old SCA1‐Tg mice (Fig. 7). Bath‐applied baclofen enhanced the remaining mGluR‐mediated slow EPSCs (Fig. 7 A) and partially rescued mGluR‐mediated SSE in a reversible manner (Fig. 7 B; the normalized first EPSC after induction, ANOVA, P < 0.0005; Control vs Baclofen, P < 0.005; Baclofen vs Washout, P < 0.005). Although baclofen did not significantly rescue LTD (Fig. 7 C left; normalized PF EPSC 30 min after induction: No baclofen, 97.7±4.0% of basal EPSC, n = 8 from 7 mice; Baclofen, 86.2±7.7%, n = 6 from 6 mice, P = 0.18), there was a tendency for baclofen to increase the number of recorded PCs with depressed PF EPSCs (< 85% of basal EPSC) at 30 min after LTD induction stimuli in 12‐week‐old SCA1‐Tg mice (Fig. 7 C right; data points below a continuous line).
Moreover, baclofen, also known as Lioresal and Gabalon, has long been available for clinical use as a muscle relaxant (Froestl, 2010) and has advantages over recently identified compounds acting directly at mGluRs for future clinical application (Ferraguti et al. 2008; Notartomaso et al. 2013). Therefore, we examined whether enhancement of mGluR signalling by baclofen can improve rotarod motor performance at the middle disease stage (12 weeks of age) (Zu et al. 2004) in SCA1‐Tg mice. A low concentration of baclofen (5 nm) was adopted for the rotarod test because the nanomolar range can potentiate mGluR1 responses in PCs with no or minimal activation of Gi/o proteins, which mediate classical GABAB receptor signalling pathways by regulating presynaptic voltage‐gated Ca2+ channels and G protein‐coupled inwardly rectifying K+ channels in the cerebellum (Tabata & Kano, 2006). Such a low dose of baclofen can facilitate a cerebellum‐dependent adaptation of the optokinetic reflex without affecting the optokinetic reflex itself (Shirai et al. 2014). In our rotarod behavioural test, baclofen was applied directly to the cerebellum of SCA1‐Tg mice, such that the cerebellum could be exposed to a more controlled concentration of the drug and we could minimize the effect of that on muscles or other tissues than the cerebellum. Compared to a control injection of PBS, a single injection of 5 nm baclofen significantly improved motor performance on Days 0, 1 and 7, and the effect disappeared at 2 and 3 weeks after the injection (Fig. 8 A).
To examine whether the improvement of rotarod performance by baclofen reflects the restoration of mGluR1 signalling in SCA1‐Tg mice, we analysed slow EPSCs, SSE and LTD in SCA1‐Tg mice that had been subjected to a cerebellar infusion of baclofen at 12 weeks of age. At 7 days after the infusion, the baclofen‐treated SCA1‐Tg mice showed larger amplitudes of slow EPSCs [Fig. 8 B, red; ANOVA, P < 0.01; PBS Day 7 (78.4 ± 19.0 pA, n = 11, 5 mice) vs Baclofen Day 7 (218.8 ± 50.6 pA, n = 10, 5 mice), P < 0.05], more marked SSE with longer duration [Fig. 8 C, red; the normalized second EPSC after SSE induction, ANOVA, P < 0.01; PBS Day 7 (96.6±7.2%, n = 10, 5 mice) vs Baclofen Day 7 (66.9±8.0%, n = 10, 5 mice), P < 0.05], and clearly induced LTD [Fig. 8 D, red; the normalized EPSC 30 min after induction; PBS Day 7 (103.0±4.0%, n = 10, 5 mice) vs Baclofen Day 7 (71.6±6.2%, n = 10, 5 mice), P < 0.005], compared with the PBS‐treated SCA1‐Tg mice. Interestingly, at 21 days after the infusion, the improvement of slow EPSCs (n = 10, 3 mice) and SSE (n = 10, 5 mice) by baclofen disappeared [Fig. 8 B, grey; slow EPSC, Baclofen Day 21 (67.5 ± 25.5 pA, n = 10, 3 mice) vs Baclofen Day 7 (218.8 ± 50.6 pA, n = 10, 5 mice), P < 0.005; Baclofen Day 21 vs PBS Day 7, P = 0.82: Fig. 8 C, grey; SSE, Baclofen Day 21 (110.8±6.4%, n = 10, 5 mice) vs Baclofen Day 7 (66.9±8.0%, n = 10, 5 mice), P < 0.001; Baclofen Day 21 vs PBS Day 7, P = 0.18]. Taken together, these results indicate that baclofen can improve motor performance in SCA1‐Tg mice and that restoration of mGluR signalling by baclofen at PF‐PC synapses matches the recovery of motor performance in baclofen‐treated SCA1‐Tg mice. This is consistent with the previous finding that motor recovery in tetracycline‐regulated conditional SCA1 model mice is associated with the return of mGluR1 expression at PF‐PC synapses after turning off the expression of the disease‐causing mutant Ataxin‐1 allele (Zu et al. 2004). Therefore, we conclude that the disruption of mGluR signalling in the PCs of SCA1‐Tg mice underlies the motor deficits in SCA1 pathology, and that functional recovery of mGluR signalling is one of the key factors for restoring motor function in SCA1. In addition, baclofen can be a useful pharmacological tool and a good therapeutic candidate for improving motor performance in SCA1.
Discussion
Using SCA1 model mice carrying abnormal disease‐causing mutant Ataxin‐1, we examined functional abnormality of mGluR signalling at cerebellar PF‐PC synapses. Although fast AMPA receptor‐mediated basal synaptic transmission exhibited no major abnormality (Fig. 1), we found that SCA1 mice show progressive functional impairment of mGluR‐dependent signalling such as slow EPSCs, synaptic plasticity (SSE and LTD) and dendritic Ca2+ signals after the 5th postnatal week (early disease stage) prior to PC death (Figs 2 and 3). We also confirmed that malfunction of cerebellar mGluR signalling and consequent motor impairment are caused by abnormal mutant Ataxin‐1 expressed in PCs of virally transduced adult WT mice (Figs 4, 5, 6). Utilizing the baclofen‐enhancing effect on the remaining mGluR signalling in PCs of 12‐week‐old SCA1‐Tg mice (Fig. 7), we demonstrate that low‐dose baclofen improves motor performance for ∼1 week after a single application of the drug to the cerebellum at the middle disease stage (Fig. 8 A). The improvement of motor performance coincided with functional recovery of mGluR‐mediated slow EPSCs, and short‐ and long‐term synaptic plasticity in baclofen‐treated SCA1‐Tg mice (Fig. 8 B–D). Our results highlight the contribution of disrupted mGluR signalling in the early to middle stages of SCA1 pathology and underline the importance of targeting the mGluR signalling pathway to treat SCA1. Notably, baclofen is an approved drug and has been clinically available for muscle spasm for decades. Enhancement of mGluR signalling by low‐dose baclofen, which is a typical case of exploiting functional crosstalk between GABAB receptors and mGluR1s (Tabata & Kano, 2006; Prezeau et al. 2010; Xu et al. 2014), could be a safer and more useful therapeutic intervention for SCA1.
Contribution of mGluR impairment to cerebellar ataxia in SCA1 and other diseases
Abnormal firing patterns of PCs can lead to cerebellar ataxia (De Zeeuw et al. 2011). Previous pathophysiological studies have shown that a reduction in intrinsic PC simple spike firing is caused by increased A‐type potassium currents and/or reduced large‐conductance Ca2+‐activated potassium currents in early stages of the disease, prior to major morphological changes and cell death of PCs in SCA1‐Tg mice (Hourez et al. 2011; Dell'Orco et al. 2015). The present study demonstrates that dysfunction in mGluR signalling is also one of the major functional defects in SCA1‐Tg PCs. Interestingly, in WT mice, it has been reported that a fraction of mGluR1s expressed on PCs are basally active to maintain PC spike firing (Yamakawa & Hirano, 1999) and that blockade of basal mGluR1 activity by mGluR1 autoantibodies produced in patients with paraneoplastic cerebellar ataxia leads to slight hyperpolarization and reduced firing rate in PCs (Coesmans et al. 2003). This downregulaton of PC excitability is mediated by tonic deactivation of mGluR1's downstream target, TRPC3 channels (Zhou et al. 2014). Although the precise mechanism of mGluR1 to the TRPC3 signalling pathway remains to be elucidated (Hartmann et al. 2011; Becker, 2014), disruption of mGluR1 signalling may partly contribute to reduced PC excitability in SCA1 pathology as well.
Accumulating evidence suggests that abnormalities in mGluR1 and its downstream signalling molecules such as Gαq, phospholipase Cβ, protein kinase Cγ, IP3 receptor and TRPC3 all can contribute to cerebellar ataxia in gene‐modified mice and that mutations in some of their genes are identified as responsible for human ataxic neurodegenerative diseases (mutations in protein kinase Cγ and IP3 receptor 1 cause SCA14 and SCA15/16/29, respectively) (Ferraguti et al. 2008; Schorge et al. 2010; Bezprozvanny, 2011; Hartmann et al. 2011; Becker, 2014; Bettencourt et al. 2014). A recent study found that homozygous mutations in the mGluR1 gene itself cause autosomal‐recessive congenital cerebellar ataxia in human patients (Guergueltcheva et al. 2012). Using exome sequencing, a mutation in the human TRPC3 gene has also been found to be a rare cause of adult‐onset cerebellar ataxia (Fogel et al. 2015). These lines of evidence all support the idea that mGluR1 and its related signalling molecules are key players in human cerebellar ataxia (Schorge et al. 2010; Becker, 2014; Bettencourt et al. 2014).
In the case of SCA1, a disease‐causing abnormal polyglutamine repeat mutation is located in Ataxin‐1 (Orr, 2012), not mGluR1 signalling‐related genes. However, previous molecular studies revealed downregulation of mGluR‐related gene sets in SCA1‐Tg mice, probably owing to a reduction in RORα‐mediated transcriptional activity (see Introduction for details) (Lin et al. 2000; Skinner et al. 2001; Serra et al. 2004, 2006). The present study shows for the first time the functional contribution of impaired mGluR signalling to SCA1 pathology in early to middle stages of the disease before PC death. In that sense, SCA1 could be categorized into ‘mGluR1‐related disease’ as well as polyglutamine disease.
SCA1 involves degeneration and loss of PCs (Orr, 2012). It remains a matter of debate whether impaired mGluR signalling directly contributes to PC degeneration or not (Coesmans et al. 2003; Ferraguti et al. 2008). A previous study suggested that mGluR1 signalling has an neuroprotective effect on PCs (Catania et al. 2001), whereas mGluR1‐deficient mice do not produce PC degeneration nor morphological change in PC dendrites (Aiba et al. 1994; Conquet et al. 1994; Kano et al. 1997), suggesting that mGluR1 itself may not be directly involved in PC degeneration or PC death. This idea is in line with our anatomical data (Figs 2 D and 5 E, F). Meanwhile, human patients with mGluR1 autoantibodies (paraneoplastic cerebellar ataxia) and with homozygous mutations in the mGluR1 gene show PC loss (Coesmans et al. 2003) and cerebellar atrophy (Guergueltcheva et al. 2012), respectively. The present study showed that reduced mGluR signalling manifests itself at the early disease stage before PC loss in SCA1‐Tg mice. It seems that dysfunction of mGluR may not cause PC death acutely, in line with the previous study (Coesmans et al. 2003). However, it should be noted that progressive reduction of mGluR‐mediated dendritic Ca2+ signals linearly correlates with the age‐dependent decrease in membrane capacitance (i.e. cell surface area) in SCA1‐Tg PCs (Fig. 3 D). This indicates that PC atrophy accompanies a functional defect in mGluR signalling in the progression of SCA1 pathology. Dysfunction of mGluR signalling might not initiate, but accelerate, the PC degeneration processes in SCA1 pathology. It remains unknown whether the causal link between the morphological and the functional abnormalities in SCA1 is direct or indirect. However, we could assume that even slight morphological atrophy may be correlated with the degree of some functional abnormality in other neurodegenerative diseases as well as SCA1, and that accumulation of such subtle atrophy and accompanying functional defects might lead to PC death at mid to late stages of slowly progressing neurodegenerative diseases such as SCA1.
Mechanism of disrupted mGluR signalling in SCA1 pathology
Transcriptional targets of RORα cover genes for mGluR‐related molecules, and among them expression of IP3 receptor 1 is known to be directly regulated by RORα transcriptional activity (Gold et al. 2007). In SCA1‐Tg mice where an abnormal disease‐causing form of Ataxin‐1 induces RORα depletion, gene sets including mGluR1 signalling‐related genes are downregulated by a reduction in RORα‐mediated gene expression (Serra et al. 2006). Expression of a cytoskeletal protein, β‐III spectrin, is also regulated by RORα and downregulated in SCA1‐Tg mice (Serra et al. 2006; Gold et al. 2007). Recently, β‐III spectrin has been shown to interact with mGluR1 and mutations in β‐III spectrin lead to SCA5 owing to mislocalization and dysfunction of mGluR1 at PC dendritic spines (Armbrust et al. 2014). A decrease in the expression of β‐III spectrin may contribute to dysfunction of mGluR1 signalling to some extent in SCA1 pathology as well. A study on a transgenic mouse model of SCA3 suggested that abnormal mutant ataxin‐3 with an expanded polyglutamine tract causes lack of RORα and disruption of mGluR signalling in PCs (Konno et al. 2014). Polyglutamine repeat expansion might have a general tendency to affect mGluR pathways via impairment of RORα‐mediated gene regulation.
Localization of abnormal mutant Ataxin‐1 to the PC nucleus (Fig. 5 C) is suggested to be critical for SCA1 pathogenesis (Orr, 2012). Normal Ataxin‐1 in the nucleus interacts with several transcriptional regulators such as SMRT, Gfi‐1 and Capicua in addition to RORα. Capicua is a transcriptional repressor, and disease‐causing mutant Ataxin‐1 with expanded polyglutamine tract is suggested to recruit Capicua to bind more tightly to certain target genes, causing their hyper‐repression, and to bind less to other target genes, thus upregulating (de‐repressing) them (Fryer et al. 2011). Gene sets of mGluR signalling might also be regulated by these transcriptional factors other than RORα.
Dendritic mGluR‐mediated Ca2+ signals in SCA1
The present study revealed that mGluR‐mediated Ca2+ signals at PF‐PC synapses are impaired in SCA1‐Tg mice. In accordance with our results, molecular studies of SCA1‐Tg mice have demonstrated the downregulation of IP3 receptor 1, Homer‐3 (adaptor protein of mGluR1) and sarcoplasmic endoplasmic reticulum calcium ATPase type 2 (SERCA2) (Lin et al. 2000; Serra et al. 2004, 2006). These molecules are also downregulated in RORα‐deficient staggerer mice, which is an extreme mouse model of SCA1 (Serra et al. 2006; Gold et al. 2007). Homer‐3 is a scaffolding protein found at PF‐PC synapses and has been suggested to be associated with mGluR1 and IP3 receptor 1, putatively forming a functional complex for the mGluR‐dependent IP3‐mediated Ca2+ release from ER stores in PCs (Serra et al. 2004; Ferraguti et al. 2008; Isope et al. 2012). SERCA2 functions as an ATP‐dependent Ca2+ pump to load Ca2+ into the ER, and a decrease in SERCA2 molecules would result in the depletion of Ca2+ stores in the ER, resulting in a smaller IP3‐mediated Ca2+ release. The decrease in the aforementioned molecules in SCA1‐Tg mice provides a reasonable mechanistic explanation for the decrease in mGluR‐mediated dendritic Ca2+ signals reported in the present study (Fig. 3). Dysfunction of neuronal Ca2+ signalling is involved in various neurological disorders (Schorge et al. 2010; Bezprozvanny, 2011; Brini et al. 2014), and abnormal Ca2+ homeostasis may play an important role in SCA1 pathology as well. Our findings, however, contradict the results of the study by Inoue et al. (2001), which failed to detect abnormal mGluR‐mediated Ca2+ dynamics in the PCs of SCA1‐Tg mice with a conventional wide‐field Ca2+ imaging methodology. Oddly, they also failed to observe mGluR‐mediated Ca2+ signals at PF‐PC synapses reliably even in WT mice (Inoue et al. 2001), in contrast to our results (Fig. 3) and previous studies (Finch & Augustine, 1998; Takechi et al. 1998; Tempia et al. 2001). This discrepancy may be reconciled by methodological differences as follows: our fast confocal Ca2+ imaging is more powerful for detecting small differences in dendritic Ca2+ signals reliably, and more accurate with a higher spatial and temporal resolution (Finch & Augustine, 1998; Takechi et al. 1998), whereas conventional wide‐field Ca2+ imaging may miss small changes in the Ca2+ signals due to a lower signal‐to‐noise ratio and limited temporal and spatial imaging resolution (Serra et al. 2004). Another methodological difference is that Inoue et al. (2001) used fura‐6F, a Ca2+ indicator dye with a much lower affinity (K d 5.3 μm) than the dyes used in this and other studies (K d 170–190 nm) (Finch & Augustine, 1998; Takechi et al. 1998; Tempia et al. 2001; Paredes et al. 2008). The lower affinity dye is not sensitive enough to detect local PF‐evoked mGluR‐mediated Ca2+ signals reliably (Wang et al. 2000). The other methodological advantage in our study is more careful methods for ROI selection and analysis to minimize underestimating dendritic Ca2+ signals (see Methods), whereas the ROIs chosen by Inoue et al. (2001) included both extracellular space and PC dendrites by coarse spatial binning, which would distort dendritic Ca2+ signals accidentally.
In SCA2 and SCA3, disease‐causing proteins with expanded polyglutamine repeats (mutated Ataxin‐2 and Ataxin‐3, respectively) directly interact with IP3 receptor 1 and enhance IP3‐mediated Ca2+ signals (Schorge et al. 2010; Bezprozvanny, 2011; Brini et al. 2014). Because Ataxin‐2 and Ataxin‐3 are both cytosolic proteins and they are likely to interact with IP3 receptors at dendritic sites of PCs (Chen et al. 2008; Liu et al. 2009), the hyperactive deranged Ca2+ signalling is thought to underlie the pathogenesis of SCA2 and SCA3 (Schorge et al. 2010; Bezprozvanny, 2011; Brini et al. 2014). Inspired by the hypothesis above, it was proposed that mutant Ataxin‐1 might also cause excessive IP3‐mediated dendritic Ca2+ release from ER stores in SCA1 pathology. In addition, a recent computational study in a model of SCA1 proposed that assumed supersensitivity of IP3 receptors could lead to upregulation of Ca2+ signalling including mGluR‐mediated IP3‐induced Ca2+ release, regardless of reduced expression of IP3 receptor 1, SERCA and mGluR (Brown & Loew, 2012). However, we think that these proposals are unlikely in SCA1 pathology, because Ataxin‐1 is localized to the PC nucleus (Skinner et al. 1997), which was confirmed in Fig. 5 B and C, and therefore mutant Ataxin‐1 has little chance to interact with dendritic IP3 receptors in PCs. In such situations, downregulation of IP3 receptor 1, SERCA and mGluR molecules can be dominant factors to determine dendritic Ca2+ signals. Indeed, the present study demonstrates that mGluR‐mediated IP3‐induced Ca2+ signals are actually reduced at PF‐PC synapses in SCA1‐Tg mice. Our experimental results qualitatively resemble the model outputs of Ca2+ signals assuming normal sensitivity of IP3 receptors (Brown & Loew, 2012). This implies that hyperactivity of IP3 receptors may contribute little to abnormal mGluR‐mediated Ca2+ signalling in SCA1. It should be noted that Brown & Loew (2012) modelled PC Ca2+ signals evoked by both a single CF stimulus and four PF stimuli, considering a low‐affinity Ca2+ indicator (K d 19 μm). In that condition, simulation outputs of IP3‐induced Ca2+ signals evoked by PFs only, which is similar to our experimental protocol, were below detection limits (Brown et al. 2008). This also supports the importance of using high‐affinity Ca2+ indicators to measure PF‐evoked mGluR‐mediated Ca2+ signals on PC dendrites (Finch & Augustine, 1998; Takechi et al. 1998; Wang et al. 2000; Tempia et al. 2001). The present study focused on only the mGluR‐mediated component of dendritic Ca2+ signals, and it remains to be examined whether PCs in SCA1‐Tg mice have abnormalities in total Ca2+ signals including another component such as Ca2+ rise through voltage‐gated Ca2+ channels.
Two Ca2+ binding proteins, Calbindin and parvalbumin, are abundantly expressed in WT PCs and these proteins are major Ca2+ buffers to regulate Ca2+ transients in PCs (Hartmann & Konnerth, 2005). Because expression of these Ca2+ buffers is reduced in SCA1‐Tg mice (Serra et al. 2006), one might predict that dendritic mGluR‐mediated Ca2+ transients should be affected and even enhanced in SCA1‐Tg PCs, if only reduction in these buffers is considered. However, this prediction is unlikely, because Calbindin acts as a fast Ca2+ buffer to modulate fast Ca2+ signals specifically and cannot interfere with mGluR‐mediated, slow Ca2+ signals (Hartmann & Konnerth, 2005). In fact, dendritic mGluR‐mediated ‘slow’ Ca2+ signals remain unchanged in PCs of Calbindin‐deficient mice (Barski et al. 2003). Meanwhile, parvalbumin‐deficient PCs also have a minor effect on synaptically induced dendritic Ca2+ elevations (Schmidt et al. 2003). Reduction in these two buffers in SCA1 may affect other Ca2+ signals such as depolarization‐induced fast Ca2+ transients (Barski et al. 2003; Schmidt et al. 2003) and/or basal global Ca2+ concentration, instead of mGluR‐mediated slow Ca2+ transients.
Novel SCA1 therapy targeting mGluRs and functional crosstalk between G‐protein‐coupled receptors (GPCRs): baclofen as an advantageous therapeutic candidate
Neurons express several types of GPCRs, and one type of GPCR can functionally affect another (functional crosstalk) (Prezeau et al. 2010). The present study utilized this functional GPCR crosstalk between mGluR1 and GABAB receptors, both of which are highly colocalized in PCs, and activation of GABAB receptors by baclofen causes enhancement of mGluR signalling (Tabata et al. 2004; Kamikubo et al. 2007). This strategy is advantageous for future clinical application, because baclofen is already in clinical use for muscle spasm (Froestl, 2010) and a low dose of baclofen can initiate the above‐mentioned GPCR crosstalk (Tabata & Kano, 2006) presumably without notable muscle relaxation. The precise mechanism of this crosstalk has not yet been clarified. It has been suggested that the GABAB receptor forms a complex with mGluR1, but without direct interaction (Xu et al. 2014). Functional crosstalk between mGluR1 and adenosine A1 receptors is also reported in PCs (Kamikubo et al. 2013). Utilizing functional GPCR crosstalk would enrich a repertoire of strategies for drug development. In addition to GPCR crosstalk between GABAB receptors and mGluR1s, it has been suggested that activation of GABAB receptors could trigger secretion of brain‐derived neurotrophic factor (BDNF) and subsequent activation of the TrkB receptor signalling pathway (Xu et al. 2014). GABAB receptors could also transactivate another type of receptor tyrosine kinase, insulin‐like growth factor‐1 (IGF‐1) receptors (Xu et al. 2014). These signalling pathways other than mGluR1 might also be involved in baclofen‐induced improvement of motor performance in SCA1‐Tg mice.
It is notable that a single shot of baclofen caused a long‐lasting (∼1 week) improvement of rotarod motor performance in SCA1‐Tg mice (Fig. 8 A) although baclofen's effects on mGluR signalling disappear after washing out of baclofen (Fig. 7 A, B). The excretion of baclofen is pharmacokinetically rapid in vivo, and most of the drug should be removed from brain tissue and blood within 24 h, although the concentration in the CNS is more constant and longer‐lasting than in the blood (Faigle & Keberle, 1972). Interestingly, recent pharmacological studies have reported similar prolonged or delayed motor improvement after a single application of a drug in SCA1‐Tg mice (Hourez et al. 2011; Notartomaso et al. 2013) and WT mice (Shirai et al. 2014). So far, it remains unclear why the effect of baclofen on motor performance outlasts cerebellar retention of the drug (∼24 h). It is known that the activation of group I mGluRs (i.e. mGluR1 and 5) mediates activity‐dependent gene expression, leading to long‐lasting synaptic plasticity and memory consolidation (Waung & Huber, 2009; Menard & Quirion, 2012). In cerebellar PCs, induction of mGluR‐mediated LTD results in expression of the immediate early gene Arc, which maintains a late phase (>1 h after induction) of LTD (Smith‐Hicks et al. 2010). Thus, it is likely that relatively short‐lived (∼24 h) enhancement of mGluR signalling by baclofen in SCA1‐Tg mice during rotarod tasks can initiate the activity‐dependent expression of some gene sets (possibly including mGluR and/or mGluR‐related molecules), which may induce longer‐lived and/or delayed plastic changes in the cerebellum (∼1 week), such as recovery of mGluR signalling and the motor improvement revealed in the present study. Post‐training spontaneous cerebellar cortical activity is suggested to be indispensable for the consolidation of motor memory (Okamoto et al. 2011). In addition to putative activity‐dependent mGluR signalling during rotarod tasks, baclofen‐modulated unidentified cerebellar spontaneous activity at day 0 might also contribute to longer plastic change in the cerebellum of baclofen‐treated SCA1‐Tg mice. Meanwhile, signalling pathways downstream of GABAB receptors could be diverse and complex (Xu et al. 2014), including crosstalk to metabotropic pathways mediated by mGluR1s and receptor tyrosine kinases. These diverse cascade signalling pathways initiated by GABAB receptors might contain a positive‐feedback element (like hormonal control), enabling the long‐lasting effect of baclofen in SCA1‐Tg mice.
SCA1 remains an incurable progressive neurodegenerative disease. There is currently no effective treatment clinically available for patients, although some approaches improve SCA1 symptoms in mice (Xia et al. 2004; Watase et al. 2007; Fryer et al. 2011; Notartomaso et al. 2013). To improve motor function in SCA1 mice, Notartomaso et al. (2013) adopted a similar strategy to ours, in which they utilized a positive allosteric modulator (PAM) of mGluR1, Ro0711401, to enhance mGluR1 signalling. Interestingly, their results are quite similar to ours and a single injection of Ro0711401 to SCA1 mice improves motor performance for ∼1 week (Notartomaso et al. 2013). PAMs of mGluR1 could be good drug candidates to treat SCA1. However, PAMs of mGluR1 are not yet in clinical use, and there is still a long way to go for clinical application. In that sense, clinically available baclofen (Gabalon or Lioresal) is advantageous and a drug repositioning strategy could be applied to develop a treatment for cerebellar ataxia in SCA1 on a faster time line. Our study provides the mechanistic grounds for developing mGluR‐targeted therapies for SCA1 and other cerebellar ataxic diseases (Schorge et al. 2010; Bezprozvanny, 2011; Becker, 2014), and enhancement of mGluR signalling by baclofen could be one of the novel effective therapies for treating cerebellar ataxia including SCA1.
Additional information
Competing interests
The authors declare no competing financial interests.
Author contributions
A.N.S., N.H. and H.H. designed research. A.N.S. performed the electrophysiological experiments, the morphological analysis and the behavioural analysis with supervision by H.H. N.H. performed the immunohistochemistry, the Sholl analysis and the confocal Ca2+ imaging experiments, and analysed the data. S.Y. and D.Y. designed and performed the rotarod tests and the kinematic analysis of virally transfected mice. N.H. wrote the paper. All authors approved the final version of the manuscript. All persons designated as authors qualify for authorship, and all those who qualify for authorship are listed. The experiments were performed at the Department of Neurophysiology and Neural Repair, Gunma University Graduate School of Medicine, and Department of Life Sciences, Graduate School of Arts and Sciences, University of Tokyo.
Funding
This study was supported in part by the Funding Program for Next Generation World‐Leading Researchers (LS021; H.H.), grants from Research on Measures for Intractable Diseases (Ataxic Diseases and Neurodegenerative Diseases) from the Ministry of Health, Labour and Welfare (H.H.) and JSPS KAKENHI grant number 25430003 (N.H.).
Acknowledgements
We thank Junko Sugiyama for maintaining and genotyping the SCA1‐Tg mice and Kiyohiko Takayama for producing lentiviral vectors. The lentiviral vector plasmids and MSCV promoter were provided by St. Jude Children's Research Hospital and the American National Red Cross, respectively.
A. N. Shuvaev and N. Hosoi contributed equally to this work.
Linked articles This article is highlighted by a Perspective by Ady & Watt. To read this Perspective, visit http://dx.doi.org/10.1113/JP273149.
This is an Editor's Choice article from the 1 January 2017 issue.
References
- Aiba A, Kano M, Chen C, Stanton ME, Fox GD, Herrup K, Zwingman TA & Tonegawa S (1994). Deficient cerebellar long‐term depression and impaired motor learning in mGluR1 mutant mice. Cell 79, 377–388. [PubMed] [Google Scholar]
- Armbrust KR, Wang X, Hathorn TJ, Cramer SW, Chen G, Zu T, Kangas T, Zink AN, Oz G, Ebner TJ & Ranum LP (2014). Mutant β‐III spectrin causes mGluR1α mislocalization and functional deficits in a mouse model of spinocerebellar ataxia type 5. J Neurosci 34, 9891–9904. [DOI] [PMC free article] [PubMed] [Google Scholar]
- Barnes JA, Ebner BA, Duvick LA, Gao W, Chen G, Orr HT & Ebner TJ (2011). Abnormalities in the climbing fiber‐Purkinje cell circuitry contribute to neuronal dysfunction in ATXN1[82Q] mice. J Neurosci 31, 12778–12789. [DOI] [PMC free article] [PubMed] [Google Scholar]
- Barski JJ, Hartmann J, Rose CR, Hoebeek F, Morl K, Noll‐Hussong M, De Zeeuw CI, Konnerth A & Meyer M (2003). Calbindin in cerebellar Purkinje cells is a critical determinant of the precision of motor coordination. J Neurosci 23, 3469–3477. [DOI] [PMC free article] [PubMed] [Google Scholar]
- Becker EB (2014). The moonwalker mouse: new insights into TRPC3 function, cerebellar development, and ataxia. Cerebellum 13, 628–636. [DOI] [PMC free article] [PubMed] [Google Scholar]
- Bettencourt C, Ryten M, Forabosco P, Schorge S, Hersheson J, Hardy J, Houlden H & United Kingdom Brain Expression Consortium (2014). Insights from cerebellar transcriptomic analysis into the pathogenesis of ataxia. JAMA Neurol 71, 831–839. [DOI] [PMC free article] [PubMed] [Google Scholar]
- Bezprozvanny I (2011). Role of inositol 1,4,5‐trisphosphate receptors in pathogenesis of Huntington's disease and spinocerebellar ataxias. Neurochem Res 36, 1186–1197. [DOI] [PMC free article] [PubMed] [Google Scholar]
- Brini M, Cali T, Ottolini D & Carafoli E (2014). Neuronal calcium signaling: function and dysfunction. Cell Mol Life Sci 71, 2787–2814. [DOI] [PMC free article] [PubMed] [Google Scholar]
- Brown SA & Loew LM (2012). Computational analysis of calcium signaling and membrane electrophysiology in cerebellar Purkinje neurons associated with ataxia. BMC Syst Biol 6, 70. [DOI] [PMC free article] [PubMed] [Google Scholar]
- Brown SA, Morgan F, Watras J & Loew LM (2008). Analysis of phosphatidylinositol‐4,5‐bisphosphate signaling in cerebellar Purkinje spines. Biophys J 95, 1795–1812. [DOI] [PMC free article] [PubMed] [Google Scholar]
- Burright EN, Clark HB, Servadio A, Matilla T, Feddersen RM, Yunis WS, Duvick LA, Zoghbi HY & Orr HT (1995). SCA1 transgenic mice: a model for neurodegeneration caused by an expanded CAG trinucleotide repeat. Cell 82, 937–948. [DOI] [PubMed] [Google Scholar]
- Catania MV, Bellomo M, Di Giorgi‐Gerevini V, Seminara G, Giuffrida R, Romeo R, De Blasi A & Nicoletti F (2001). Endogenous activation of group‐I metabotropic glutamate receptors is required for differentiation and survival of cerebellar Purkinje cells. J Neurosci 21, 7664–7673. [DOI] [PMC free article] [PubMed] [Google Scholar]
- Chen X, Tang TS, Tu H, Nelson O, Pook M, Hammer R, Nukina N & Bezprozvanny I (2008). Deranged calcium signaling and neurodegeneration in spinocerebellar ataxia type 3. J Neurosci 28, 12713–12724. [DOI] [PMC free article] [PubMed] [Google Scholar]
- Clark HB, Burright EN, Yunis WS, Larson S, Wilcox C, Hartman B, Matilla A, Zoghbi HY & Orr HT (1997). Purkinje cell expression of a mutant allele of SCA1 in transgenic mice leads to disparate effects on motor behaviors, followed by a progressive cerebellar dysfunction and histological alterations. J Neurosci 17, 7385–7395. [DOI] [PMC free article] [PubMed] [Google Scholar]
- Coesmans M, Smitt PA, Linden DJ, Shigemoto R, Hirano T, Yamakawa Y, van Alphen AM, Luo C, van der Geest JN, Kros JM, Gaillard CA, Frens MA & de Zeeuw CI (2003). Mechanisms underlying cerebellar motor deficits due to mGluR1‐autoantibodies. Ann Neurol 53, 325–336. [DOI] [PubMed] [Google Scholar]
- Conquet F, Bashir ZI, Davies CH, Daniel H, Ferraguti F, Bordi F, Franz‐Bacon K, Reggiani A, Matarese V, Conde F, Collingridgei GL & Crépel F (1994). Motor deficit and impairment of synaptic plasticity in mice lacking mGluR1. Nature 372, 237–243. [DOI] [PubMed] [Google Scholar]
- De Zeeuw CI, Hoebeek FE, Bosman LW, Schonewille M, Witter L & Koekkoek SK (2011). Spatiotemporal firing patterns in the cerebellum. Nat Rev Neurosci 12, 327–344. [DOI] [PubMed] [Google Scholar]
- Dell'Orco JM, Wasserman AH, Chopra R, Ingram MA, Hu YS, Singh V, Wulff H, Opal P, Orr HT & Shakkottai VG (2015). Neuronal atrophy early in degenerative ataxia is a compensatory mechanism to regulate membrane excitability. J Neurosci 35, 11292–11307. [DOI] [PMC free article] [PubMed] [Google Scholar]
- Eilers J, Augustine GJ & Konnerth A (1995). Subthreshold synaptic Ca2+ signalling in fine dendrites and spines of cerebellar Purkinje neurons. Nature 373, 155–158. [DOI] [PubMed] [Google Scholar]
- Endo S, Shutoh F, Dinh TL, Okamoto T, Ikeda T, Suzuki M, Kawahara S, Yanagihara D, Sato Y, Yamada K, Sakamoto T, Kirino Y, Hartell NA, Yamaguchi K, Itohara S, Nairn AC, Greengard P, Nagao S & Ito M (2009). Dual involvement of G‐substrate in motor learning revealed by gene deletion. Proc Natl Acad Sci USA 106, 3525–3530. [DOI] [PMC free article] [PubMed] [Google Scholar]
- Faigle JW & Keberle H (1972). The chemistry and kinetics of Lioresal. Postgrad Med J 48, Suppl 5, 9–13. [PubMed] [Google Scholar]
- Ferraguti F, Crepaldi L & Nicoletti F (2008). Metabotropic glutamate 1 receptor: current concepts and perspectives. Pharmacol Rev 60, 536–581. [DOI] [PubMed] [Google Scholar]
- Ferreira TA, Blackman AV, Oyrer J, Jayabal S, Chung AJ, Watt AJ, Sjostrom PJ & van Meyel DJ (2014). Neuronal morphometry directly from bitmap images. Nat Methods 11, 982–984. [DOI] [PMC free article] [PubMed] [Google Scholar]
- Finch EA & Augustine GJ (1998). Local calcium signalling by inositol‐1,4,5‐trisphosphate in Purkinje cell dendrites. Nature 396, 753–756. [DOI] [PubMed] [Google Scholar]
- Finch EA, Tanaka K & Augustine GJ (2012). Calcium as a trigger for cerebellar long‐term synaptic depression. Cerebellum 11, 706–717. [DOI] [PubMed] [Google Scholar]
- Fogel BL, Hanson SM & Becker EB (2015). Do mutations in the murine ataxia gene TRPC3 cause cerebellar ataxia in humans? Mov Disord 30, 284–286. [DOI] [PMC free article] [PubMed] [Google Scholar]
- Froestl W (2010). Chemistry and pharmacology of GABAB receptor ligands. Adv Pharmacol 58, 19–62. [DOI] [PubMed] [Google Scholar]
- Fryer JD, Yu P, Kang H, Mandel‐Brehm C, Carter AN, Crespo‐Barreto J, Gao Y, Flora A, Shaw C, Orr HT & Zoghbi HY (2011). Exercise and genetic rescue of SCA1 via the transcriptional repressor Capicua. Science 334, 690–693. [DOI] [PMC free article] [PubMed] [Google Scholar]
- Gao Z, van Beugen BJ & De Zeeuw CI (2012). Distributed synergistic plasticity and cerebellar learning. Nat Rev Neurosci 13, 619–635. [DOI] [PubMed] [Google Scholar]
- Gold DA, Gent PM & Hamilton BA (2007). RORα in genetic control of cerebellum development: 50 staggering years. Brain Res 1140, 19–25. [DOI] [PubMed] [Google Scholar]
- Guergueltcheva V, Azmanov DN, Angelicheva D, Smith KR, Chamova T, Florez L, Bynevelt M, Nguyen T, Cherninkova S, Bojinova V, Kaprelyan A, Angelova L, Morar B, Chandler D, Kaneva R, Bahlo M, Tournev I & Kalaydjieva L (2012). Autosomal‐recessive congenital cerebellar ataxia is caused by mutations in metabotropic glutamate receptor 1. Am J Hum Genet 91, 553–564. [DOI] [PMC free article] [PubMed] [Google Scholar]
- Hartmann J, Dragicevic E, Adelsberger H, Henning HA, Sumser M, Abramowitz J, Blum R, Dietrich A, Freichel M, Flockerzi V, Birnbaumer L & Konnerth A (2008). TRPC3 channels are required for synaptic transmission and motor coordination. Neuron 59, 392–398. [DOI] [PMC free article] [PubMed] [Google Scholar]
- Hartmann J, Henning HA & Konnerth A (2011). mGluR1/TRPC3‐mediated synaptic transmission and calcium signaling in mammalian central neurons. Cold Spring Harb Perspect Biol 3, a006726. [DOI] [PMC free article] [PubMed] [Google Scholar]
- Hartmann J & Konnerth A (2005). Determinants of postsynaptic Ca2+ signaling in Purkinje neurons. Cell Calcium 37, 459–466. [DOI] [PubMed] [Google Scholar]
- Hourez R, Servais L, Orduz D, Gall D, Millard I, de Kerchove d'Exaerde A, Cheron G, Orr HT, Pandolfo M & Schiffmann SN (2011). Aminopyridines correct early dysfunction and delay neurodegeneration in a mouse model of spinocerebellar ataxia type 1. J Neurosci 31, 11795–11807. [DOI] [PMC free article] [PubMed] [Google Scholar]
- Inoue T, Lin X, Kohlmeier KA, Orr HT, Zoghbi HY & Ross WN (2001). Calcium dynamics and electrophysiological properties of cerebellar Purkinje cells in SCA1 transgenic mice. J Neurophysiol 85, 1750–1760. [DOI] [PubMed] [Google Scholar]
- Ishikawa D, Takahashi N, Sasaki T, Usami A, Matsuki N & Ikegaya Y (2010). Fluorescent pipettes for optically targeted patch‐clamp recordings. Neural Netw 23, 669–672. [DOI] [PubMed] [Google Scholar]
- Isope P, Hildebrand ME & Snutch TP (2012). Contributions of T‐type voltage‐gated calcium channels to postsynaptic calcium signaling within Purkinje neurons. Cerebellum 11, 651–665. [DOI] [PMC free article] [PubMed] [Google Scholar]
- Kamikubo Y, Shimomura T, Fujita Y, Tabata T, Kashiyama T, Sakurai T, Fukurotani K & Kano M (2013). Functional cooperation of metabotropic adenosine and glutamate receptors regulates postsynaptic plasticity in the cerebellum. J Neurosci 33, 18661–18671. [DOI] [PMC free article] [PubMed] [Google Scholar]
- Kamikubo Y, Tabata T, Kakizawa S, Kawakami D, Watanabe M, Ogura A, Iino M & Kano M (2007). Postsynaptic GABAB receptor signalling enhances LTD in mouse cerebellar Purkinje cells. J Physiol 585, 549–563. [DOI] [PMC free article] [PubMed] [Google Scholar]
- Kano M, Hashimoto K, Kurihara H, Watanabe M, Inoue Y, Aiba A & Tonegawa S (1997). Persistent multiple climbing fiber innervation of cerebellar Purkinje cells in mice lacking mGluR1. Neuron 18, 71–79. [DOI] [PubMed] [Google Scholar]
- Kano M, Hashimoto K & Tabata T (2008). Type‐1 metabotropic glutamate receptor in cerebellar Purkinje cells: a key molecule responsible for long‐term depression, endocannabinoid signalling and synapse elimination. Philos Trans R Soc Lond B Biol Sci 363, 2173–2186. [DOI] [PMC free article] [PubMed] [Google Scholar]
- Konno A, Shuvaev AN, Miyake N, Miyake K, Iizuka A, Matsuura S, Huda F, Nakamura K, Yanagi S, Shimada T & Hirai H (2014). Mutant ataxin‐3 with an abnormally expanded polyglutamine chain disrupts dendritic development and metabotropic glutamate receptor signaling in mouse cerebellar Purkinje cells. Cerebellum 13, 29–41. [DOI] [PubMed] [Google Scholar]
- Lin X, Antalffy B, Kang D, Orr HT & Zoghbi HY (2000). Polyglutamine expansion down‐regulates specific neuronal genes before pathologic changes in SCA1. Nat Neurosci 3, 157–163. [DOI] [PubMed] [Google Scholar]
- Liu J, Tang TS, Tu H, Nelson O, Herndon E, Huynh DP, Pulst SM & Bezprozvanny I (2009). Deranged calcium signaling and neurodegeneration in spinocerebellar ataxia type 2. J Neurosci 29, 9148–9162. [DOI] [PMC free article] [PubMed] [Google Scholar]
- Menard C & Quirion R (2012). Group 1 metabotropic glutamate receptor function and its regulation of learning and memory in the aging brain. Front Pharmacol 3, 182. [DOI] [PMC free article] [PubMed] [Google Scholar]
- Mitsumura K, Hosoi N, Furuya N & Hirai H (2011). Disruption of metabotropic glutamate receptor signalling is a major defect at cerebellar parallel fibre‐Purkinje cell synapses in staggerer mutant mice. J Physiol 589, 3191–3209. [DOI] [PMC free article] [PubMed] [Google Scholar]
- Notartomaso S, Zappulla C, Biagioni F, Cannella M, Bucci D, Mascio G, Scarselli P, Fazio F, Weisz F, Lionetto L, Simmaco M, Gradini R, Battaglia G, Signore M, Puliti A & Nicoletti F (2013). Pharmacological enhancement of mGlu1 metabotropic glutamate receptors causes a prolonged symptomatic benefit in a mouse model of spinocerebellar ataxia type 1. Mol Brain 6, 48. [DOI] [PMC free article] [PubMed] [Google Scholar]
- Okamoto T, Shirao T, Shutoh F, Suzuki T & Nagao S (2011). Post‐training cerebellar cortical activity plays an important role for consolidation of memory of cerebellum‐dependent motor learning. Neurosci Lett 504, 53–56. [DOI] [PubMed] [Google Scholar]
- Orr HT (2012). SCA1‐phosphorylation, a regulator of Ataxin‐1 function and pathogenesis. Prog Neurobiol 99, 179–185. [DOI] [PMC free article] [PubMed] [Google Scholar]
- Paredes RM, Etzler JC, Watts LT, Zheng W & Lechleiter JD (2008). Chemical calcium indicators. Methods 46, 143–151. [DOI] [PMC free article] [PubMed] [Google Scholar]
- Prezeau L, Rives ML, Comps‐Agrar L, Maurel D, Kniazeff J & Pin JP (2010). Functional crosstalk between GPCRs: with or without oligomerization. Curr Opin Pharmacol 10, 6–13. [DOI] [PubMed] [Google Scholar]
- Safo PK, Cravatt BF & Regehr WG (2006). Retrograde endocannabinoid signaling in the cerebellar cortex. Cerebellum 5, 134–145. [DOI] [PubMed] [Google Scholar]
- Schmidt H, Stiefel KM, Racay P, Schwaller B & Eilers J (2003). Mutational analysis of dendritic Ca2+ kinetics in rodent Purkinje cells: role of parvalbumin and calbindin D28k. J Physiol 551, 13–32. [DOI] [PMC free article] [PubMed] [Google Scholar]
- Schorge S, van de Leemput J, Singleton A, Houlden H & Hardy J (2010). Human ataxias: a genetic dissection of inositol triphosphate receptor (ITPR1)‐dependent signaling. Trends Neurosci 33, 211–219. [DOI] [PMC free article] [PubMed] [Google Scholar]
- Serra HG, Byam CE, Lande JD, Tousey SK, Zoghbi HY & Orr HT (2004). Gene profiling links SCA1 pathophysiology to glutamate signaling in Purkinje cells of transgenic mice. Hum Mol Genet 13, 2535–2543. [DOI] [PubMed] [Google Scholar]
- Serra HG, Duvick L, Zu T, Carlson K, Stevens S, Jorgensen N, Lysholm A, Burright E, Zoghbi HY, Clark HB, Andresen JM & Orr HT (2006). RORα‐mediated Purkinje cell development determines disease severity in adult SCA1 mice. Cell 127, 697–708. [DOI] [PubMed] [Google Scholar]
- Shirai Y, Sasajima T, Uchiyama S, Takegoshi Y, Tsushima E & Tabata T (2014). [Activation of cerebellar B‐type gamma‐aminobutyric acid receptor modulates optokinetic reflex adaptation]. Yakugaku Zasshi 134, 439–445. [DOI] [PubMed] [Google Scholar]
- Sidman RL, Lane PW & Dickie MM (1962). Staggerer, a new mutation in the mouse affecting the cerebellum. Science 137, 610–612. [DOI] [PubMed] [Google Scholar]
- Skinner PJ, Koshy BT, Cummings CJ, Klement IA, Helin K, Servadio A, Zoghbi HY & Orr HT (1997). Ataxin‐1 with an expanded glutamine tract alters nuclear matrix‐associated structures. Nature 389, 971–974. [DOI] [PubMed] [Google Scholar]
- Skinner PJ, Vierra‐Green CA, Clark HB, Zoghbi HY & Orr HT (2001). Altered trafficking of membrane proteins in Purkinje cells of SCA1 transgenic mice. Am J Pathol 159, 905–913. [DOI] [PMC free article] [PubMed] [Google Scholar]
- Smith‐Hicks C, Xiao B, Deng R, Ji Y, Zhao X, Shepherd JD, Posern G, Kuhl D, Huganir RL, Ginty DD, Worley PF & Linden DJ (2010). SRF binding to SRE 6.9 in the Arc promoter is essential for LTD in cultured Purkinje cells. Nat Neurosci 13, 1082–1089. [DOI] [PMC free article] [PubMed] [Google Scholar]
- Tabata T, Araishi K, Hashimoto K, Hashimotodani Y, van der Putten H, Bettler B & Kano M (2004). Ca2+ activity at GABAB receptors constitutively promotes metabotropic glutamate signaling in the absence of GABA. Proc Natl Acad Sci USA 101, 16952–16957. [DOI] [PMC free article] [PubMed] [Google Scholar]
- Tabata T & Kano M (2006). GABAB receptor‐mediated modulation of glutamate signaling in cerebellar Purkinje cells. Cerebellum 5, 127–133. [DOI] [PubMed] [Google Scholar]
- Takayama K, Torashima T, Horiuchi H & Hirai H (2008). Purkinje‐cell‐preferential transduction by lentiviral vectors with the murine stem cell virus promoter. Neurosci Lett 443, 7–11. [DOI] [PubMed] [Google Scholar]
- Takechi H, Eilers J & Konnerth A (1998). A new class of synaptic response involving calcium release in dendritic spines. Nature 396, 757–760. [DOI] [PubMed] [Google Scholar]
- Tempia F, Alojado ME, Strata P & Knopfel T (2001). Characterization of the mGluR1‐mediated electrical and calcium signaling in Purkinje cells of mouse cerebellar slices. J Neurophysiol 86, 1389–1397. [DOI] [PubMed] [Google Scholar]
- Torashima T, Iizuka A, Horiuchi H, Mitsumura K, Yamasaki M, Koyama C, Takayama K, Iino M, Watanabe M & Hirai H (2009). Rescue of abnormal phenotypes in δ2 glutamate receptor‐deficient mice by the extracellular N‐terminal and intracellular C‐terminal domains of the δ2 glutamate receptor. Eur J Neurosci 30, 355–365. [DOI] [PubMed] [Google Scholar]
- Torashima T, Okoyama S, Nishizaki T & Hirai H (2006). In vivo transduction of murine cerebellar Purkinje cells by HIV‐derived lentiviral vectors. Brain Res 1082, 11–22. [DOI] [PubMed] [Google Scholar]
- Wang SS, Denk W & Hausser M (2000). Coincidence detection in single dendritic spines mediated by calcium release. Nat Neurosci 3, 1266–1273. [DOI] [PubMed] [Google Scholar]
- Watase K, Gatchel JR, Sun Y, Emamian E, Atkinson R, Richman R, Mizusawa H, Orr HT, Shaw C & Zoghbi HY (2007). Lithium therapy improves neurological function and hippocampal dendritic arborization in a spinocerebellar ataxia type 1 mouse model. PLoS Med 4, e182. [DOI] [PMC free article] [PubMed] [Google Scholar]
- Watase K, Weeber EJ, Xu B, Antalffy B, Yuva‐Paylor L, Hashimoto K, Kano M, Atkinson R, Sun Y, Armstrong DL, Sweatt JD, Orr HT, Paylor R & Zoghbi HY (2002). A long CAG repeat in the mouse Sca1 locus replicates SCA1 features and reveals the impact of protein solubility on selective neurodegeneration. Neuron 34, 905–919. [DOI] [PubMed] [Google Scholar]
- Waung MW & Huber KM (2009). Protein translation in synaptic plasticity: mGluR‐LTD, Fragile X. Curr Opin Neurobiol 19, 319–326. [DOI] [PMC free article] [PubMed] [Google Scholar]
- Xia H, Mao Q, Eliason SL, Harper SQ, Martins IH, Orr HT, Paulson HL, Yang L, Kotin RM & Davidson BL (2004). RNAi suppresses polyglutamine‐induced neurodegeneration in a model of spinocerebellar ataxia. Nat Med 10, 816–820. [DOI] [PubMed] [Google Scholar]
- Xu C, Zhang W, Rondard P, Pin JP & Liu J (2014). Complex GABAB receptor complexes: how to generate multiple functionally distinct units from a single receptor. Front Pharmacol 5, 12. [DOI] [PMC free article] [PubMed] [Google Scholar]
- Yamakawa Y & Hirano T (1999). Contribution of mGluR1 to the basal activity of a mouse cerebellar Purkinje neuron. Neurosci Lett 277, 103–106. [DOI] [PubMed] [Google Scholar]
- Zhou H, Lin Z, Voges K, Ju C, Gao Z, Bosman LW, Ruigrok TJ, Hoebeek FE, De Zeeuw CI & Schonewille M (2014). Cerebellar modules operate at different frequencies. Elife 3, e02536. [DOI] [PMC free article] [PubMed] [Google Scholar]
- Zu T, Duvick LA, Kaytor MD, Berlinger MS, Zoghbi HY, Clark HB & Orr HT (2004). Recovery from polyglutamine‐induced neurodegeneration in conditional SCA1 transgenic mice. J Neurosci 24, 8853–8861. [DOI] [PMC free article] [PubMed] [Google Scholar]