

Abstract
In understanding the mechanisms of cholesterol in the pathogenesis of atherosclerosis, previous studies from other laboratories have demonstrated that cholesterol crystals (CC) induce scavenger receptor CD36 expression and NLRP3-mediated inflammasome formation. In elucidating the mechanisms by which CC could enhance CD36 expression and foam cell formation, here we report that CC via NADPH and xanthine oxidases-mediated ROS production activates BTK, a non-receptor tyrosine kinase. In addition, CC induce p300 tyrosine phosphorylation and activation in a BTK-dependent manner, which in turn, leads to STAT1 acetylation and its interaction with PPARγ in CD36 expression, oxLDL uptake and foam cell formation. Furthermore, p300, STAT1 and PPARγ bound to a STAT binding site at −107 nt in CD36 promoter and enhanced its activity in ROS and BTK-dependent manner. Disruption of this STAT binding site by site-directed mutagenesis abolished CC-induced CD36 promoter activity. Together these results reveal for the first time that CC via producing ROS and activating BTK causes p300-mediated STAT1 acetylation and its interaction with PPARγ in CD36 expression, oxLDL uptake and foam cell formation.
Highlights
-
•
CC induces CD36 expression and foam cell formation by ROS-mediated BTK activation.
-
•
STAT1 and PPARγ interactions are required for CC-induced CD36 expression.
-
•
ROS-dependent BTK and p300 activation mediate STAT1 and PPARγ interactions.
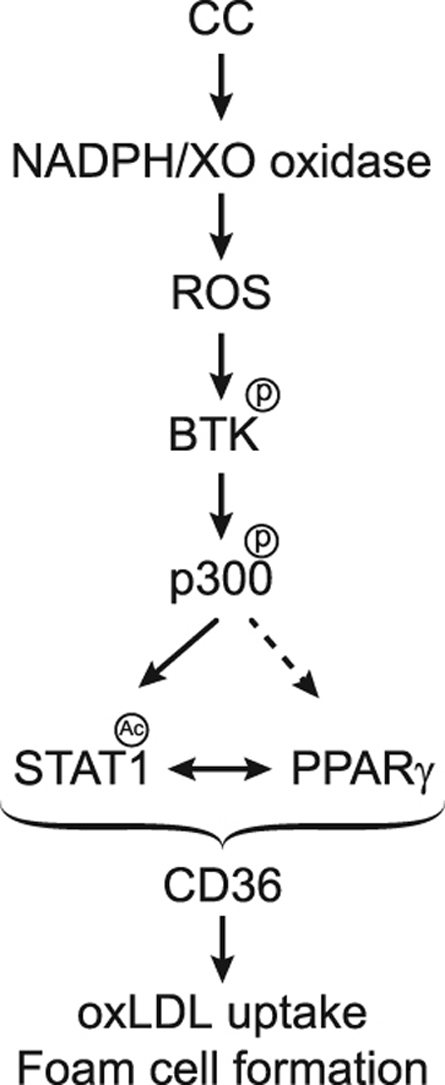
Graphical abstract
1. Introduction
Atherosclerosis is a chronic inflammatory disease of the arterial wall and is one of the leading causes of death worldwide [1], [2]. Atherosclerosis is characterized by accumulation of lipid-laden foam cells in the subendothelial space and calcification of the plaque [2], [3]. Scavenger receptors play an important role in foam cell formation because of their ability to bind to and internalize oxidized (ox)-LDL [1], [2], [3], [4]. In humans, two major classes of scavenger receptors have been identified and designated as type A and type B receptors [5]. CD36, a cell surface glycoprotein is a member of the scavenger receptor type B family, which also includes SR-B1 and HDL receptor [6]. CD36 is expressed in various cell types including monocytes [7], [8], endothelial cells [9], platelets [10] and adipocytes [11]. CD36 recognizes a variety of ligands including oxLDL [7], anionic-phospholipids [6] and collagen [10].
Cholesterol in the form of cholesterol crystals (CC) plays an important role in the atherosclerotic lesion formation, for which reason, it is classified as a prognostic marker for atherosclerosis [12]. Several studies have reported that CC are present at the sites of plaque rupture, suggesting an important link between plasma cholesterol levels and the pathogenesis of atherosclerosis [13], [14], [15]. Many studies have also reported the involvement of CC in the early atherosclerotic lesion formation [12]. The role of CC in the pathogenesis of atherosclerosis can also be eluded by the finding that CC induce NALP3-mediated inflammasome formation [12]. In addition, the role of CC in complement-dependent reactive oxygen species and proinflammatory cytokine production has been reported [16] and there is a large body of evidence that connects oxidant stress to the pathogenesis of a variety of diseases including cardiovascular diseases [17]. Furthermore, several studies have demonstrated that cholesterol enhances CD36 expression supporting its role in foam cell formation [18], [19]. However, the mechanisms by which cellular cholesterol induces CD36 expression were not explored. In this context, we have studied the mechanisms by which CC could induce CD36 expression, oxLDL uptake and foam cell formation. In this study, we report that CC induce CD36 expression, oxLDL uptake and foam cell formation via STAT1 acetylation and its interaction with PPARγ. We also show that STAT1 acetylation requires ROS-dependent BTK-mediated p300 tyrosine phosphorylation and activation.
2. Materials and methods
2.1. Reagents
LDH cytotoxicity assay kit (601170) and MTT cell proliferation assay kit (10009365) were purchased from Cayman chemical (Ann Arbor, MI). Anti-phosphoserine/threonine (ab17464) and anti-Pyk2 (ab32571) antibodies were obtained from Abcam (Cambridge, MA). Anti-pBTK (5082), anti-pPyk2 (3291), anti-pSrc (2101), anti-pSTAT1 (9177), anti-pSTAT2 (4441), anti-pSTAT3 (9133), anti-pSTAT4 (5267), anti-pSTAT5 (9351), anti-pSTAT6 (9364), and anti-pSyk (2715) antibodies were bought from Cell Signaling Technology (Beverly, MA). Anti-acetyl lysine (SC-32268), anti-BTK (SC-1696), anti-CD36 (SC-9154), anti-CBP (SC-369), anti-p300 (SC-584), anti-PPARα (SC-9000), anti-PPARβ (SC-7197), anti-PPARγ (SC-7196), anti-p47Phox (SC14015), anti-SR-A1 (SC-9104), anti-SR-B1 (SC-67098), anti-STAT1 (SC-464), anti-STAT2 (SC-476), anti-STAT3 (SC-482), anti-STAT4 (SC-486), anti-STAT5 (SC-835), anti-STAT6 (SC-981), anti-Syk (SC-573), anti-β-tubulin (SC-9104) and anti-xanthine oxidase (SC-20991) antibodies as well as normal mouse serum (SC-45051) and normal rabbit serum (SC-3888) were purchased from Santa Cruz Biotechnology (Santa Cruz, CA). Anti-PPARδ antibodies (NBP1-39684) were obtained from Novus Biologicals (Littleton, CO). Anti-phsophotyrosine antibodies (05−777) and p300 immunoprecipitation-HAT assay kit (17−284) were procured from Millipore Corporation (Temecula, CA). Diphenyleneiodonium chloride (BML-CN240) was bought from Enzo Life Science (Farmingdale, NY). Acetyl coenzyme A (A2056), Apocyanin (A10809), Allopurinol (A8003), Cholesterol (C8667) and Oil red O (234117) were purchased from Sigma-Aldrich Chemicals (St. Louis, MO). Amplex Red hydrogen peroxide/peroxidase assay kit (A22188), CM-H2DCFDA [5-(and 6)-chloromethyl-2′, 7′-dichlorodihydrofluorescein diacetate acetyl ester] (C6827), GW9662 (1508) and Lipofectin transfection reagent (15596018) were obtained from Invitrogen (Grand Island, NY). pGL3 basic vector and luciferase assay system (E4530) were bought from Promega (Madison, WI). Dil-oxLDL (BT-920) and oxLDL (BT-910) were obtained from Biomedical Technologies (Stoughton, MA). Biotin 3′ End DNA labeling Kit (89818) and Lightshift Chemiluminescent EMSA Kit (20148) were procured from Pierce Biotechnology (Rockford, IL). The enhanced chemiluminescence (ECL) Western blotting detection reagents (RPN2106) were obtained from GE Healthcare. [3H]-Acetyl CoA (S.A. 8.6 Ci/mmole) was purchased from Perkin Elmer (Waltham, MA). All the phosphorothioate-modified antisense oligonucleotides (ASOs) and primers were synthesized by IDT (Coralville, IA). The phosphorothioate-modified ASOs used in this study are as follows: hControl ASO, 5′-GGGGGUTCTCTGCGTACGGTGCUAGU-3′; hCBP (NM_001020603) ASO, 5′-GCGUUAGGGTCTCAGCCAGC-3′; hCD36 (NM_000072) ASO, 5′-CCACAGTTCCGGTCACAGCC-3′; hp47Phox (NM_000265) ASO, 5′-GUUGGGCTCAGGGTCTTCCGUCUC-3′; hPyk2 (NM_173175) ASO, 5′-CCUGUGTCCATAGCCCAGAGUACC-3′; hp300 (NM_004380) ASO, 5′-UGUGUUGTTGGTGGTGTAGGUGU-3′; and hXO (NM_000379) ASO, 5′-GCCUCCTCCCATTCTCTTCACUCG-3′.
2.2. Cell culture
THP1 cells, a human leukemic monocyte cell line, were purchased from American Type Culture Collection (Manassas, VA) and cultured in RPMI-1640 medium supplemented with 10% heat-inactivated fetal bovine serum (FBS), 50 U/ml penicillin, 50 μg/ml streptomycin and 50 μM β-mercaptoethanol. To perform the experiments, cells were growth-arrested in serum-free RPMI-1640 medium containing the antibiotics and β-mercaptoethanol overnight. Cultures were maintained in a humidified 95% air and 5% CO2 atmosphere at 37 °C.
2.3. Preparation of cholesterol crystals
Cholesterol crystals were prepared according to the method of Flynn et al. [20]. Briefly, cholesterol was dissolved in 95% ethanol (12.5 g/l), heated at 60 °C for 2 h, filtered through Whatman filter paper and left at room temperature for crystallization. Crystals were collected by filtering, grinded with autoclaved mortar and pestle to yield 1–10 µm in size, and stored at −20 °C.
2.4. Mouse primary peritoneal macrophage isolation
Mouse primary peritoneal macrophages were isolated as described by us previously [21].
2.5. Cell cytotoxicity
Cell cytotoxicity was measured by LDH release using a kit and following the manufacturer's protocol.
2.6. Cell proliferation assay
Cell proliferation was measured by MTT assay following the manufacturer's protocol.
2.7. RT-PCR
Total cellular RNA was extracted from THP1 cells using TRIzol reagent according to the manufacturer׳s protocol. Reverse transcription was performed with a high capacity cDNA reverse transcription kit (Applied Biosystems). Complementary DNA (cDNA) was then used as a template for amplification using the following primers: human SR-A1 (NM_002445), forward, 5′-CCTCGTGTTTGCAGTTCTCA-3′ and reverse, 5′-CCATGTTGCTCATGTGTTCC-3′; human SR-B1 (NM_001082959), forward, 5′-CTGTGGGTGAGATCATGTGG-3′ and reverse, 5′-GCCCTTCCTTTGGAGTAACC-3′; human CD36 (NM_000072), forward, 5′-ACAGATGCAGCCTCATTTCC-3′ and reverse, 5′- GCCTTGGATGGAAGAACAAA-3′; human β-actin (NM_001101), forward, 5′- AGCCATGTACGTTGCTAT-3′ and reverse, 5′-GATGTCCACGTCACACTTCA-3′. The amplification was performed using Gene AMP PCR system 2400 (Applied Biosystems). The amplified PCR products were separated on 1.5% agarose gels, stained with ethidium bromide and the images were captured using a Kodak In Vivo Imaging System.
2.8. Western blotting
Cell extracts containing an equal amount of protein from control and the indicated treatments were resolved by electrophoresis on 0.1% (W/V) SDS and 10% (W/V) polyacrylamide gels. The proteins were transferred electrophoretically to a nitrocellulose membrane. After blocking in either 5% (W/V) nonfat dry milk or 5% (W/V) BSA, the membrane was probed with appropriate primary antibodies followed by incubation with Horseradish Peroxidase-conjugated secondary antibodies. The antigen-antibody complexes were detected using enhanced chemiluminescence detection reagent kit (GE Health Care).
2.9. Acetyl transferase assay
The acetyl transferase activity of p300 was measured using a kit as per the supplier's protocol.
2.10. ROS
Intracellular ROS production was measured using membrane permeable CM-H2DCFDA as well as Amplex Red Hydrogen Peroxide/Peroxidae Assay Kit as described previously [21], [22].
2.11. Transfections
Transfections were performed as described previously [23]. Briefly, cells were transfected with the indicated ASOs at 100 nM concentration using Lipofectin transfection reagent for 6 h following the manufacturer's instructions. After transfection, cells were maintained in complete RPMI-1640 medium for 36 h followed by growth arresting in serum-free medium overnight before using for experiments.
2.12. Cloning and mutagenesis
Human CD36 promoter cloning and its site-directed mutagenesis of STAT1 K410R/K413R were described previously [23].
2.13. EMSA
Nuclear extracts of THP1 cells with and without appropriate treatments were prepared as described previously [23]. The protein content of the nuclear extracts was determined using a micro-BCA method (Pierce Biotechnology). Biotin-labeled double-stranded oligonucleotides encompassing STAT-binding element at −107 nt forward (5′- ATTTTTTTTTTCTTTC AATTTCTCTAGGA AACAAACCACACACTG-3′), reverse (5′- CAGTGTGTGGTTTGTTTC CTAGA GAAATTGAAAGAAAAAAAAAAT-3′) were used as a probe. Briefly, 5 μg of nuclear extract was incubated in a binding buffer (10 mM Tris-HCl, pH 7.9, 50 mM KCl, 1 mM DTT, 15% glycerol) with 2.5 nM of biotin-labeled probe and 2 μg of poly dI: dC for 30 min at room temperature in a total volume of 20 μl on ice and the DNA-protein complexes were analyzed by electrophoresis on 6% polyacrylamide gels and visualized by chemiluminescence imaging. To perform a supershift EMSA, the complete reaction mix was incubated with 2 μg of the indicated antibody for 1 h on ice before separating it by electrophoresis. Normal serum was used as a negative control.
2.14. Luciferase assay
THP1 cells were co-transfected with pGL3 empty vector, pGL3-hCD36 or pGL3-hCD36m promoter along with the indicated plasmids using Lipofectamine transfection reagent. After growth arresting in serum-free medium for 12 h, cells were treated with and without 40 μg CC for 6 h, washed with cold PBS and lysed in 200 μl of lysis buffer. The cell extracts were cleared by centrifugation at 12,000 rpm for 2 min at 4 °C. The supernatants were assayed for luciferase activity using luciferase assay system (Promega) and a single tube luminometer (TD20/20; Turner Designs, Sunnyvale, CA) and expressed as relative luciferase units (RLU).
2.15. Chromatin immunoprecipitation (ChIP) and Re-ChIP assays
ChIP assay was performed on THP1 cells with and without the indicated treatments using a kit and following the supplier's protocol (Upstate Biotechnology Inc., Lake Placid, NY). STAT1, PPARγ and p300-DNA complexes were immunoprecipitated using anti-STAT1, anti-PPARγ and anti-p300 antibodies, respectively. Pre-immune mouse serum or rabbit serum were used as negative controls. For chromatin re-immunoprecipitation (re-ChIP) assay, the chromatin complexes were eluted from the first ChIP with 10 mM DTT at 37 °C for 30 min and diluted 20 times with ChIP dilution buffer (1% Triton X-100, 2 mM EDTA, 20 mM Tris-HCl, pH 8.1 and 150 mM NaCl) and immunoprecipitated with the indicated antibodies. In the case of Re-ChIP, chromatin was immunoprecipitated in a sequential manner with the indicated antibodies. The immunoprecipitated DNA was uncross-linked, subjected to Proteinase K digestion, purified using QIAquick columns (Cat. No. 28104, Qiagen, Valenica, CA). The ChIP and re-ChIP samples were analyzed by PCR by using the following primers: forward, 5′-GGGGAAACTCAGCAAGTCAG-3′ and reverse, 5′-AGTGTCAGATCCCAGTGG-3′ that would amplify 228 bp fragment encompassing the STAT-binding site at −107 nt. The resulting PCR products were resolved on 1.8% agarose gels, stained with ethidium bromide and the images were captured using Kodak In Vivo Imaging System.
2.16. Dil-oxLDL uptake assay
Dil-oxLDL uptake was measured according to the method of McLaren et al. [24]. Briefly, THP1 cells with and without the indicated treatments were incubated with Dil-oxLDL (10 μg/ml) for 6 h at 37 °C. After incubation with Dil-oxLDL, cells were washed with PBS, re-suspended in PBS and analyzed by FACSCalibur flow cytometer (BD Biosciences, San Jose, CA) with an acquired capacity of 10,000 cells. The data were analyzed using cellquest software and Dil-oxLDL uptake is presented as a percentage of the total cells.
2.17. Foam cell assay
Foam cell formation was performed as per the method of McLaren et al. [24]. Briefly, THP1 cells that were treated with and without the indicated treatments were incubated with oxLDL (10 μg/ml) for 6 h at 37 °C. Cells were then fixed with 4% paraformaldehyde for 30 min, stained with Oil red O for 10 min and counterstained with hematoxylin. Cell staining was observed under a Nikon Eclipse 50i microscope with 40X/0.65 magnification and the images were captured with a Nikon Digital Slight DS-L1 camera. After capturing the images, the Oil red O stain was eluted by incubating the slides with isopropanol for 15 min at room temperature and the optical density was measured at 500 nm in a SpectraMax 190 spectrophotometer (Molecular Devices).
2.18. Statistics
All the experiments were repeated three times and the data are presented as Mean±S.D. The treatment effects were analyzed by Student t-test, and the p values <0.05 were considered statistically significant. In the case of EMSA, supershift EMSA and Western blotting, one representative set of data is shown.
3. Results
3.1. Role of STAT1 acetylation in CC-induced CD36 expression, oxLDL uptake and foam cell formation
CD36 plays a crucial role in foam cell formation, one of the underlying factors in atherogenesis [25], [26]. The presence of CC in the advanced athreosclerotic lesions of human and animal models and its effects on CD36 expression suggest a role for cholesterol in atherogenesis [13], [14], [15]. To understand the mechanisms by which CC regulate foam cell formation, we have studied its effects on scavenger receptor expression in human monocytic THP1 cells. CC while having no effect on SR-A1 and SR-B1 expression, induced the expression of CD36 at both protein and mRNA levels in a time dependent manner with maximum effects at 4 h and 2 h, respectively (Fig. 1A). CC neither exhibited cytotoxic effects in THP1 cells nor influenced their proliferation (Fig. 1B). Since, CC-induced CD36 expression, we have studied its role in oxLDL uptake and foam cell formation. Anti-sense oligonucleotide (ASO)-mediated downregulation of CD36 levels attenuated CC-induced oxLDL uptake and foam cell formation (Fig. 1C). These results suggest that CC induce oxLDL uptake and foam cell formation via CD36 expression. Studies from others as well as our laboratories have shown a role for STAT1 in CD36 expression [27], [28]. To test the role of STATs in CC-induced CD36 expression, oxLDL uptake and foam cell formation, we have studied the effects of CC on STAT1, STAT2, STAT3, STAT4, STAT5 and STAT6 activation. CC while having no major effect on STAT2, STAT3, STAT4, STAT5 and STAT6 tyrosine phosphorylation induced STAT1 tyrosine phosphorylation (Fig. 1D). This finding suggests that CC activate STAT1. However, blockade of STAT1 tyrosine phosphorylation using its dominant negative tyrosine mutant PFS1YF [29] had no effect on CC-induced CD36 expression, oxLDL uptake and foam cell formation (Fig. 1E). These findings indicate that tyrosine phosphorylation of STAT1 had no influence on CC-induced CD36 expression, oxLDL uptake and foam cell formation. However, ASO-mediated depletion of STAT1 levels attenuated CC-induced CD36 expression, oxLDL uptake and foam cell formation (Fig. 1F). Many studies have shown that besides phosphorylation, acetylation plays a role in the activation of STATs, particularly STAT1 and STAT3 [30], [31], [32]. Based on this information, we have tested the effect of CC on STAT1 acetylation. CC induced STAT1 acetylation in a time dependent manner (Fig. 1F). STAT1 gets acetylated at K410/K413 residues [29]. To identify the potential lysine residue(s) of STAT1 that are acetylated by CC, we tested the effect of K410R/K413R mutant on CC-induced STAT1 acetylation. Transfection of cells with K410R/K413R mutant blocked CC-induced STAT1 acetylation (Fig. 1G), suggesting that STAT1 is acetylated at K410/K413 residues in response to CC. To find whether STAT1 acetylation has any role in STAT1 tyrosine phosphorylation, we tested the effect of K410R/K413R mutant on CC-induced STAT1 tyrosine phosphorylation. STAT1 K410R/K413R mutant had no effect on CC-induced STAT1 tyrosine phosphorylation (Fig. 1G). To find whether there is any link between STAT1 tyrosine phosphorylation and its acetylation, we next tested the effect of its tyrosine dominant negative mutant PFS1YF. PFS1YF had no effect on CC-induced STAT1 acetylation (Fig. 1G). These findings indicate that STAT1 tyrosine phosphorylation and acetylation are triggered independent of each other by CC. To find whether STAT1 acetylation has any role in CC-induced CD36 expression, oxLDL uptake and foam cell formation, we tested the effect of K410R/K413R mutant. Transfection of cells with K410R/K413R mutant blocked CC-induced CD36 expression, oxLDL uptake and foam cell formation (Fig. 1H).
Fig. 1.

CC-induced CD36 expression, oxLDL uptake and foam cell formation require STAT1 acetylation. A. Quiescent cells were treated with vehicle or CC (40 µg/ml) for the indicated time periods and either protein extracts were prepared or RNA was isolated. The protein extracts and RNA were analyzed by Western blotting and RT-PCR for the indicated scavenger receptors expression and normalized to β-tubulin protein and β-actin mRNA levels, respectively. B. Cells were treated with vehicle or CC (40 µg/ml) for 6 h and tested for their cytotoxicity and proliferation by LDH release and MTT assays, respectively. C. Upper panel: Cells were transfected with the indicated ASO, quiesced, treated with vehicle or CC for 4 h and analyzed by Western blotting for CD36 levels and the blot was reprobed for β-tubulin to show the effects of the ASO on its target and off target molecules levels. Middle and bottom panels: All the conditions were the same as in the upper panel except that cells were subjected to CC-induced oxLDL uptake (middle panel) or foam cell formation (bottom panel) assays. D. Equal amounts of protein from control and various time periods of CC-treated cells were analyzed by Western blotting for pSTAT1, pSTAT2, pSTAT3, pSTAT4, pSTAT5 and pSTAT6 levels and normalized to their total levels. E. Upper panel: Cells were transfected with vector or PFS1YF, quiesced, treated with and without CC for 1 h or 4 h, cell extracts were prepared and analyzed by Western blotting for pSTAT1 (1 h samples) and CD36 levels (4 h samples) and the blots were reprobed for STAT1 over expression and β-tubulin normalization. Middle and bottom panels: All the conditions were the same as in the upper panel except that after quiescence cells were subjected to CC-induced oxLDL uptake (middle panel) and foam cell formation (bottom panel) assays. F. Cells were transfected with control or STAT1 ASO, quiesced, treated with and without CC and analyzed for CD36 expression, oxLDL uptake or foam cell formation as described in panel C. The CD36 blot was reprobed for STAT1 and β-tubulin to show the effect of the ASO on its target and off target molecules levels. G. Upper panel: Equal amounts of proteins from control and the indicated time periods of CC-treated cells were immunoprecipitated with anti-STAT1 antibodies or IgG and the immunocomplexes were analyzed by Western blotting using anti-acetyl lysine (Ac-Lys) antibodies followed by normalization to STAT1. Lower panels: Cells were transfected with vector, K410R/K413R or PFS1YF, quiesced, treated with and without CC for 1 h and analyzed for STAT1 acetylation and phosphorylation as described in the upper panel and panel C, respectively and the blots were reprobed for STAT1 levels. H. Cells were transfected with vector or K410R/K413R, quiesced, treated with and without CC and analyzed for CD36 expression, oxLDL uptake or foam cell formation as described in panel C. The bar graphs represent Mean±S.D. values of three experiments. *p<0.01 vs vehicle control or vector control or control ASO; **p<0.01 vs CC or control ASO+CC or vector control+CC.
3.2. Role of STAT1 acetylation in the recruitment of PPARγ in CC-induced CD36 expression, oxLDL uptake and foam cell formation
A large body of evidence suggests that PPARγ mediates CD36 expression in response to its ligands, including 15(S)-HETE [33], [34], [35]. To find the role of PPARγ in CC-induced CD36 expression, we tested the effect of PPARγ antagonist GW9662 [33]. GW9662 inhibited CC-induced CD36 expression, oxLDL uptake and foam cell formation (Fig. 2A). Since both STAT1 acetylation and PPARγ activation are involved in CC-induced CD36 expression, oxLDL uptake and foam cell formation, we wanted to explore whether PPARγ activation is required for CC-induced STAT1 acetylation. However, blockade of PPARγ activation by GW9662 had no effect on CC-induced STAT1 acetylation (Fig. 2B). To understand how CC induced CD36 expression by recruiting two different transcriptional factors, we asked the question whether there is any interaction between these transcriptional factors. Co-immunoprecipitation experiment revealed that STAT1 exists in complex with PPARα, PPARβ and PPARδ constitutively and in response to CC its association with PPARγ increases in a time dependent manner with maximum effect at 1 h (Fig. 2B). Conversely, PPARγ formed a complex with STAT2, STAT4, and STAT6 constitutively and in response to CC its association with STAT1 increases in a time dependent manner (Fig. 2B). In order to test the role of STAT1 tyrosine phosphorylation and acetylation on its interaction with PPARγ, we tested the effect of its tyrosine and acetyl mutants, PFS1YF and K410R/K413R, respectively. PFS1YF mutant had no effect on CC-induced STAT1 association with PPARγ (Fig. 2C). On the other hand, K410R/K413R mutant blocked CC-induced STAT1 association with PPARγ (Fig. 2C). These findings indicate that STAT1 acetylation but not tyrosine phosphorylation is required for its interaction with PPARγ.
Fig. 2.

CC-induced CD36 expression, oxLDL uptake and foam cell formation require STAT1 interaction with PPARγ. A. Quiescent cells were treated with vehicle or CC (40 μg/ml) in the presence and absence of GW9662 (5 μM) and analyzed for CD36 expression, oxLDL uptake or foam cell formation as described in Fig. 1, panel C. B. Upper panel: Quiescent cells were treated with and without CC in the presence and absence of GW9662 for 1 h and analyzed for STAT1 acetylation as described in Fig. 1, panel F. Middle and bottom panels: Equal amounts of protein from control and the indicated time periods of CC-treated cells were immunoprecipitated with anti-STAT1 or anti-PPARγ antibodies or IgG and the immunocomplexes were analyzed by Western blotting for the indicated proteins using their specific antibodies and normalized for STAT1 or PPARγ. C. Cells were transfected with vector, PFS1YF or K410R/K413R, quiesced, treated with and without CC for 1 h and equal amounts of protein from control and each treatment were immunoprecipitated with anti-STAT1 antibodies and the immunocomplexes were analyzed by Western blotting for PPARγ. The blots were reprobed for STAT1 over expression. The bar graphs represent Mean±S.D. of three experiments *p<0.01 vs vehicle control or vector control; **p<0.01 vs CC or vector control+CC.
3.3. Role of p300 in CC-induced STAT1 acetylation and its interaction with PPARγ in CD36 expression, oxLDL uptake and foam cell formation
Previously, we have demonstrated a role for p300 in 15(S)-HETE-induced STAT1 acetylation and its interaction with PPARγ in CD36 expression, oxLDL uptake and foam cell formation [23]. Therefore, to understand the mechanisms by which CC regulate STAT1 acetylation, we have studied the role of p300. Co-immunoprecipitation experiments showed that while p300 exists in complex with both STAT3 and STAT5 basally its association with STAT1 increases in a time dependent manner in response to CC (Fig. 3A). No significant changes were noted between STAT3 or STAT5 interaction with p300 in response to treatment with CC (Fig. 3A). Furthermore, downregulation of p300 using its ASO inhibited CC-induced STAT1 acetylation and its interaction with PPARγ (Fig. 3B). In addition, p300 downregulation inhibited CC-induced CD36 expression, oxLDL uptake and foam cell formation (Fig. 3C). To confirm the role of p300 acetyltransferase activity in STAT1 acetylation and its interaction with PPARγ in CD36 expression, oxLDL uptake and foam cell formation, we tested the effect of p300ΔHAT mutant that lacks acetyltransferase activity [36]. While transfection of cells with p300 WT increased CC-induced STAT1 acetylation and its interaction with p300 leading to enhanced CD36 expression, oxLDL uptake and foam cell formation, transfection of cells with p300ΔHAT mutant prevented these effects (Fig. 3D and E). To test the specificity of p300 in CC-induced STAT1 acetyalation and its interaction with PPARγ in CD36 expression and oxLDL uptake, we next studied the role of its homologue CBP. ASO-mediated downregulation of CBP levels had no effect on CC-induced STAT1 acetyalation, its interaction with PPARγ, CD36 expression and oxLDL uptake (Fig. 3F and G).
Fig. 3.

CC-induced STAT1 acetylation requires p300 acetyltransferase activity. A. Equal amounts of protein from control and the indicated time periods of CC (40 μg/ml)-treated cells were immunoprecipitated with anti-p300 antibodies or IgG and the immunocomplexes were analyzed by Western blotting for STAT1, STAT3, or STAT5 levels and normalized for p300. B. Quiescent cells were transfected with control or p300 ASO, quiesced, treated with and without CC for 1 h, cell extracts were prepared and equal amounts proteins from each condition were immunoprecipitated with anti-STAT1 antibodies and the immunocomplexes were analyzed by Western blotting for STAT1 acetylation and its association with PPARγ as described in Fig. 1, panel F and Fig. 2, panel C, respectively. C. All the conditions were same as in panel B except that cells were treated with vehicle or CC and analyzed for CD36 expression, oxLDL uptake or foam cell formation as described in Fig. 1, panel C. The blot was reprobed for p300 and β-tubulin to show the effect of the ASO on its target and off target molecules levels. D and E. Cells were transfected with p300WT or p300ΔHAT, quiesced, treated with and without CC and analyzed for STAT1 acetylation, its association with PPARγ, CD36 expression, oxLDL uptake or foam cell formation as described above in panels B and C, respectively. The blots were reprobed for STAT1 or β-tubulin for normalization. F and G. Cells were transfected with control or CBP ASO, quiesced, treated with and without CC and analyzed for STAT1 acetylation and its association with PPARγ, CD36 expression and oxLDL uptake as described above in panels B and C, respectively. The blots were reprobed for CBP, STAT1 or β-tubulin to show the effect of the ASO on its target and off target molecules levels. The bar graphs represent Mean±S.D. values of three experiments. *p<0.01 vs control ASO or p300WT; **p<0.01 versus control ASO+CC or p300WT+CC.
3.4. Role of BTK in CC-induced p300 tyrosine phosphorylation, STAT1 acetylation and its interaction with PPARγ in CD36 expression, oxLDL uptake and foam cell formation
To decipher the mechanism(s) by which CC modulate p300 activation, we studied its effects on p300 phosphorylation. CC while having no effect on p300 serine/threonine phosphorylation induced its tyrosine phosphorylation in a time dependent manner (Fig. 4A). Previously, we have shown that non-receptor tyrosine kinases (NRTKs) Syk and Pyk2 were involved in 15(S)-HETE-induced p300 tyrosine phosphorylation and its activation leading to STAT1 acetylation and its interaction with PPARγ in CD36 expression, oxLDL uptake and foam cell formation [27]. To identify NRTK that mediates CC-induced p300 tyrosine phosphorylation, we first studied the time course effect of CC on tyrosine phosphorylation and activation of various NRTKs. CC while having little or no effect on Src and Syk tyrosine phosphorylation stimulated the tyrosine phosphorylation of BTK and Pyk2 in a time dependent manner (Fig. 4B). Based on these results we examined the role of BTK and Pyk2 in CC-induced p300 tyrosine phosphorylation, its association with STAT1, STAT1 acetylation and its interaction with PPARγ in CD36 expression, oxLDL uptake and foam cell formation. Despite the robust activation of both BTK and Pyk2 by CC, downregulation of only BTK but not Pyk2 blunted CC-induced CD36 expression, oxLDL uptake and foam cell formation (Fig. 4C). In accordance with these observations, ASO-mediated depletion of BTK levels also blocked CC-induced p300 tyrosine phosphorylation, its association with STAT1, STAT1 acetylation and its interaction with PPARγ (Fig. 4D). Furthermore, downregulation of BTK by its ASO inhibited p300 acetyltransferase activity (Fig. 4D).
Fig. 4.

CC induces p300 activation in BTK-dependent manner. A. Equal amounts of protein from control and the indicated time periods of CC (40 μg/ml)-treated cells were immunoprecipitated with anti-p300 antibodies or IgG and the immunocomplexes were analyzed by Western blotting with anti-PY20 or anti-phosphoserine/threonine antibodies followed by normalization for p300. B. All the conditions were same as in panel A except that the cell extracts were analyzed by Western blotting for pBTK, pPyk2, pSrc and pSyk levels using their phospho-specific antibodies and normalized for their total levels. C. Cells were transfected with the indicated ASO, quiesced, treated with and without CC and analyzed for CD36 expression, oxLDL uptake or foam cell formation as described in Fig. 1, panel C. The blot was reprobed for BTK, Pyk2 and β-tubulin levels to show the effects of the ASOs on their target and off target molecules levels. D. Cells were transfected with control or BTK ASO, quiesced, treated with and without CC for 1 h and cell extracts were prepared. Equal amount of protein from control and each treatment were immunoprecipitated with anti-p300 or anti-STAT1 antibodies and the immunocomplexes were analyzed by Western blotting for anti-PY20, anti-STAT1, anti-Ac-Lys or anti-PPARγ antibodies and normalized for p300 or STAT1. An equal amount of protein from control and each treatment was also assayed for p300 acetyltransferase activity. *p<0.01 vs control ASO; **p<0.01 vs control ASO+CC.
3.5. Role of ROS in CC-induced BTK activation, p300 tyrosine phosphorylation, STAT1 acetylation and its interaction with PPARγ in mediating CD36 expression, oxLDL uptake and foam cell formation
Previously, we have reported that ROS are involved in the activation of Syk and Pyk2 in 15(S)-HETE-induced p300 tyrosine phosphorylation, STAT1 acetylation and its interaction with PPARγ in CD36 expression, oxLDL uptake and foam cell formation [27]. Therefore, we tested the role of ROS in CC-induced BTK activation, p300 tyrosine phosphorylation, STAT1 acetylation and its interaction with PPARγ in CD36 expression, oxLDL uptake and foam cell formation. As measured by both CM-H2DCFDA and Amplex Red hydrogen peroxide/peroxidase assay kit methods, CC induced ROS production in a time dependent manner with a maximum fourfold increase at 30 min (Fig. 5A). NADPH and xanthine oxidases are the major sources of ROS production in many cell types [37], [38]. Therefore, to find the source of CC-induced ROS production, we tested the role of NADPH oxidase and xanthine oxidase. We found that apocyanin and DPI, potent inhibitors of NADPH oxidase [37], and allopurinol, potent inhibitor of xanthine oxidase [37], substantially reduced CC-induced ROS production (Fig. 5A). These observations infer that both NADPH oxidase and xanthine oxidase are involved in CC-induced ROS production. Consistent with these observations, ASO-mediated downregulation of p47Phox (a NADPH oxidase component) or xanthine oxidase levels suppressed CC-induced CD36 expression, oxLDL uptake and foam cell formation (Fig. 5B). In line with the above findings, depletion of p47Phox or xanthine oxidase levels inhibited CC-induced BTK and p300 tyrosine phosphorylation, STAT1 acetylation and its interaction with PPARγ (Fig. 5C). ASO-mediated depletion of p47Phox or xanthine oxidase levels also inhibited p300 acetyltransferase activity (Fig. 5C).
Fig. 5.

CC-induced BTK activation depends on NADPH and xanthine oxidases-mediated ROS production. A. Quiescent cells were treated with vehicle or CC (40 μg/ml) for the indicated time periods or for 30 min in the presence and absence of Apocyanin (100 μM), DPI (10 μM) or Allopurinol (100 μM) and ROS production was measured using CM-H2DCFDA and Amplex Red. B. Cells were transfected with control, p47Phox or xanthine oxidase ASOs, quiesced, treated with vehicle or CC and analyzed for CD36 expression, oxLDL uptake or foam cell formation as described in Fig. 1, panel C. The CD36 blot was reprobed for p47Phox, xanthine oxidase and β-tubulin levels to show the effects of the ASOs on their target and off target molecules levels or normalization. C. Cells that were transfected with control, p47Phox or xanthine oxidase ASOs and quiesced were treated with vehicle or CC for 1 h and analyzed for BTK and p300 tyrosine phosphorylation, p300 association with STAT1, STAT1 acetylation and its interaction with PPARγ as described in Fig. 4, panels B, A and D, respectively, and the blots were reprobed for BTK, p300 or STAT1 levels for normalization. An equal amount of protein from control and each treatment was also assayed for p300 acetyltransferase activity. *p<0.01 vs control ASO; **p<0.01 vs CC or control ASO+CC.
3.6. STAT1, PPARγ and p300 mediate CC-induced CD36 promoter activity
We have previously shown that STAT1, PPARγ and p300 bind to a STAT-binding site in CD36 promoter and enhance its activity in response to a lipid hydroperoxide, 15(S)-HETE [27]. In lieu of these observations, we asked the question whether these transcriptional factors and coactivator have any role in CC-induced CD36 promoter activity. EMSA and supershift EMSA revealed that STAT1, PPARγ and p300 bind to an oligonucleotide probe harboring the STAT-binding site at −107 nt in the CD36 promoter (Fig. 6A). In addition, ChIP and re-ChIP assays were conducted to determine the binding of STAT1, PPARγ and p300 to the STAT-binding site at −107 nt in the CD36 promoter in intact cells. ChIP assay results showed that STAT1, PPARγ and p300 bind to the same CD36 promoter region (Fig. 6B). Re-ChIP analysis of anti-STAT1 chromatin immunocomplexes further showed that PPARγ and p300 bind to the CD36 promoter along with STAT1 (Fig. 6B). Conversely, re-ChIP analysis of anti-PPARγ chromatin immunocomplexes revealed that STAT1 and p300 bind to CD36 promoter along with PPARγ (Fig. 6B). Likewise, re-ChIP analysis of anti-p300 chromatin immunocomplexes showed that STAT1 and PPARγ bind to the CD36 promoter along with p300 (Fig. 6B). In addition, while STAT1 tyrosine mutant PFS1YF had no effect, its acetyl mutant K410R/K413R blocked the recruitment of STAT1, PPARγ and p300 to the CD36 promoter in response to CC (Fig. 6C). Similarly, p300ΔHAT that lacks the acetyltransferase activity prevented CC-induced binding of STAT1, PPARγ and p300 to the CD36 promoter (Fig. 6D). GW9662, the antagonist of PPARγ, however while blocking CC-induced PPARγ binding to the CD36 promoter had no effect on STAT1 or p300 binding (Fig. 6E). Depletion of BTK, p47Phox or xanthine oxidase levels also prevented CC-induced binding of STAT1, PPARγ and p300 to the CD36 promoter (Fig. 6F and G). To confirm these results, we have transfected THP1 cells with pGL3 vector or pGL3 harboring ~800 bp CD36 promoter-luciferase reporter gene and studied their response to CC. CC induced CD36 promoter-luciferase reporter gene activity by 8-fold (Fig. 7A). In addition, site-directed mutagenesis of STAT-binding site at −107 nt blocked CC-induced CD36 promoter-luciferase reporter gene activity (Fig. 7A). Furthermore, CC-induced CD36 promoter-luciferase reporter gene activity was found to be sensitive to inhibition of NADPH oxidase, xanthine oxidase, BTK activation, STAT1 acetylation, PPARγ activation and p300 HAT activity (Fig. 7B–F).
Fig. 6.

Interactions between STAT1, PPARγ and p300 are required for CC-induced STAT1 binding to CD36 promoter. A. Nuclear extracts of control and 2 h of CC (40 μg/ml)-treated cells were analyzed by EMSA and supershift EMSA for the presence of STAT1, PPARγ and p300 in the STAT-DNA complexes using STAT binding site at −107 nt in the CD36 promoter as a biotin-labeled probe. B. Quiescent cells were treated with vehicle or CC for the indicated time periods and subjected to ChIP and re-ChIP assays of CD36 promoter using anti-STAT1, anti-PPARγ or anti-p300 antibodies with the indicated sequential order. C and D. Cells were transfected with vector, PFS1YF, K410R/K413R, p300WT or p300ΔHAT, quiesced, treated with and without CC for 2 h and subjected to ChIP and re-ChIP assays for STAT1, PPARγ and p300 binding to CD36 promoter as described in panel B. E. Quiescent cells were treated with vehicle or CC in the presence and absence of GW9662 (5 μM) for 2 h and subjected to ChIP and re-ChIP assays for STAT1, PPARγ and p300 binding to CD36 promoter as described in panel B. F and G. Cells were transfected with the indicated ASOs, quiesced, treated with and without CC for 2 h and subjected to ChIP and re-ChIP assays for STAT1, PPARγ and p300 binding to CD36 promoter as described in panel B. IgG was used as a negative control.
Fig. 7.

STAT1, PPARγ and p300 mediate CC-induced CD36 promoter activity. A. Cells were transfected with vector, pGL3-hCD36 or pGL3-hCD36m (STAT-binding site at −107 nt was mutated), growth-arrested, treated with and without CC (40 μg/ml) for 6 h and the luciferase activity was measured. B, C and E. After transfection with vector or pGL3-hCD36, cells were quiesced, treated with vehicle or CC in the presence and absence of Apocyanin (100 μM), DPI (10 μM), Allopurinol (100 μM), PCI32765 (10 μM) or GW9662 (5 μM) for 6 h and the luciferase activity was measured. D and F. Cells were co-transfected with vector or pGL3-hCD36 in combination with pcDNA3.1, PFS1YF, K410R/K413R, p300WT or p300ΔHAT, quiesced, treated with vehicle or CC for 6 h and the luciferase activity was measured. *p<0.01 vs vector; **p<0.01 vs vector+CC or STAT1+CC or p300WT+CC. RLU, relative luciferase units.
3.7. CC induces ROS production, BTK activation, p300-STAT1-PPARγ interactions, CD36 expression and foam cell formation in mouse primary peritoneal macrophages
In order to validate the observations obtained in THP1 cells, we also studied the effects of CC on ROS production, BTK activation, p300 phosphorylation, STAT1 acetylation and its interactions with p300 and PPARγ, CD36 expression, oxLDL uptake and foam cell formation in mouse primary peritoneal macrophages. It is indeed exciting to find that CC induced ROS production, BTK and p300 tyrosine phosphorylation, p300 association with STAT1, STAT1 acetylation and its interaction with PPARγ, CD36 expression, oxLDL uptake and foam cell formation in mouse primary peritoneal macrophages (Fig. 8 A–E).
Fig. 8.

CC induces ROS production, BTK activation, p300-STAT1-PPARγ interactions, CD36 expression and foam cell formation in mouse primary peritoneal macrophages. A–C. Mouse primary peritoneal macrophages were isolated from WT mice, quiesced overnight, treated with and without CC (40 μg/ml) for the indicated time periods and either ROS production was measured or cell extracts were prepared and analyzed for BTK and p300 tyrosine phosphorylation, p300 association with STAT1, STAT1 acetylation and its association with PPARγ and CD36 expression as described in Figure legends 5A, 4B, 4A, 3A, 1F, 2B and IA, respectively. D and E. Mouse primary peritoneal macrophages after overnight growth arrest were treated with and without CC (40 μg/ml) for 6 h and analyzed for oxLDL uptake and foam cell formation as described in Figure legend 1 C. *p<0.01 vs control.
4. Discussion
Although scavenger receptor genes, particularly types A and B do not contain sterol regulatory elements, their expression is induced in response to high free and esterified intracellular cholesterol levels [39]. Because of this correlation between scavenger receptor expression and cellular cholesterol levels, these receptors are likely to play an important role in the uptake of oxLDL by macrophages during atherogenesis. Several studies have shown that in patients with high circulating levels of LDL-cholesterol, sub endothelial retention of LDL increases and creates a microenvironment in which it becomes oxidized, which is no longer recognized by the LDL-receptor, but rather becomes a ligand for scavenger receptors [40]. Therefore, scavenger receptor expression is likely a determinant factor for oxLDL uptake by cells such as macrophages. In this context, among the many scavenger receptors, CD36 has been shown to be a major mediator of oxLDL uptake and foam cell formation [25], [27], [41]. Despite the advancement in our understating between cellular cholesterol levels and scavenger receptor expression, the underlying mechanisms of their induction were not clear. In the present study, we report that CC stimulates CD36 expression leading to oxLDL uptake and foam cell formation. Previous work from others as well as our laboratory has shown that STAT1 plays a role in CD36 expression and foam cell formation [27], [28]. Based on these observations, we hypothesized that STAT1 might be playing a role in CC-induced CD36 expression and foam cell formation. Indeed, our findings reveal that CC stimulates STAT1 tyrosine phosphorylation and acetylation in THP1 cells. However, despite the capacity of CC in the stimulation of both tyrosine phosphorylation and acetylation of STAT1 CC-induced CD36 expression, oxLDL uptake and foam cell formation showed a requirement only for STAT1 acetylation but not tyrosine phosphorylation. These observations are consistent with our previous findings on the role of STAT1 acetylation in lipid hydroperoxide 15(S)-HETE-induced CD36 expression, oxLDL uptake and foam cell formation.
Many studies have demonstrated that PPARγ plays a role in CD36 expression and foam cell formation [33], [34]. In addition, we have reported that 15(S)-HETE induces CD36 expression, oxLDL uptake and foam cell formation and these events require STAT1 acetylation and its interaction with PPARγ [27]. In the present study, we also found that CC-induced CD36 expression, oxLDL uptake and foam cell formation require PPARγ activation. Furthermore, our results show that acetylation-mediated STAT1 interaction with PPARγ is needed for CC-induced CD36 expression, oxLDL uptake and foam cell formation. Since no interactions were observed between STAT3 or STAT5 with PPARγ and CC had no influence on the interactions between STAT2, STAT4 or STAT6 with PPARγ, it is unlikely that these STATs are involved in CC-induced CD36 expression, oxLDL uptake and foam cell formation. Similarly, because STAT1 tyrosine phosphorylation was not required for CC-induced CD36 expression, a slight increase in STAT2, STAT3 or STAT6 tyrosine phosphorylation by CC may also be not linked to this scavenger receptor expression by CC. Many studies have shown that p300 mediates acetylation of STATs, particularly STAT1 and STAT3 [30], [31], [32]. While exploring the mechanisms of STAT1 acetylation by CC, we observed that CC stimulates tyrosine phosphorylation and activation of p300, which in turn, mediates STAT1 acetylation and its interaction with PPARγ. Several reports showed that p300 activation depends on its Ser/Thr phosphorylation [42]. However, our findings reveal that CC stimulates p300 tyrosine phosphorylation rather than Ser/Thr phosphorylation leading to its activation. Previously, we have reported that Syk and Pyk2 mediate 15(S)-HETE-induced tyrosine phosphorylation of p300 leading to its activation and its role in STAT1 acetylation and its interaction with PPARγ in CD36 expression, oxLDL uptake and foam cell formation. In contrast to these observations, the present findings show that CC while having little or no effect on Src and Syk activation stimulate BTK and Pyk2 tyrosine phosphorylation. Interestingly, while Pyk2 depletion had no effect, down regulation of BTK levels attenuated CC-induced p300 tyrosine phosphorylation, STAT1 acetylation and its interaction with PPARγ resulting in reduced CD36 expression, oxLDL uptake and foam cell formation. BTK is a member of the Tec family of non-receptor tyrosine kinases and plays an important role in B-lymphocyte differentiation and signaling [43]. It has also been demonstrated that BTK-deficient mice display a reduced leukocyte recruitment and inflammatory response in various disease models [44]. Furthermore, the absence of functional BTK increases the tendency of macrophages to undergo apoptosis and as a result diminishes their proinflammatory functions [45]. Despite the large number of studies on the role of BTK in cancer and inflammatory diseases [46], [47], very little is known on its role in vascular diseases. Toward this end, the present findings reveal that BTK via tyrosine phosphorylation and activation of p300 and thereby facilitating STAT1 acetylation and its interaction with PPARγ plays an important role in CC-induced CD36 expression, oxLDL uptake and foam cell formation. Based on these observations a role for BTK in the pathogenesis of atherosclerosis may also be suggested. In this context, it is worth pointing that a recent study has shown that BTK mediates NLRP3-dependent inflammasome formation [47]. Since CC also trigger NLRP3-mediated inflammasome formation [12], it is quite possible that BTK besides its role in CC-induced CD36 expression and foam cell formation may also be involved in CC-induced inflammasome formation in the pathogenesis of atherosclerosis.
A large body of data suggests that oxidative stress plays a notable role in atherogenesis [48], [49]. It has been demonstrated that macrophages from hypercholesterolemic patients show enhanced ROS production and proinflammatory cytokine expression as compared to control macrophages [50], [51]. In this aspect, the present findings demonstrate that CC induces ROS production leading to activation of BTK. These observations also infer that CC via ROS production and activation of BTK stimulates a transcriptional machinery involving p300-STAT1-PPARγ in inducing proatherogenic genes such as CD36 expression. The EMSA, supershift EMSA, ChIP, re-ChIP and promoter-reporter gene analysis further support these conclusions. The re-ChIP analysis of anti-PPARγ chromatin immunoprecipitates revealed that activation of PPARγ is not required for the binding of STAT1 or p300 to the CD36 promoter. These results suggest that p300-mediated STAT1 acetylation rather than PPARγ activation is crucial for the binding of STAT1-PPARγ complexes to the CD36 promoter. Because PPARγ antagonist inhibits the PPARγ binding to the CD36 promoter and attenuates the promoter activity partially, it is quite possible that in addition to its involvement in STAT1-mediated promoter activity, PPARγ alone might be involved in the regulation of CD36 promoter activity and its expression at least partially. It is worth to note that both XO and NADPH oxidase were involved in CC-induced ROS production in the modulation of CD36 expression and foam cell formation. Previously, we have reported that an interaction between XO and NADPH oxidase is required for 15(S)-HETE-induced ROS production and IL17A expression in mediating monocyte migration and its adhesion to endothelial cells [21]. Based on these observations, it may be suggested that an interdependent activation of XO and NADPH oxidase is involved in CC-induced ROS production leading to CD36 expression and foam cell formation. Although the present results do not address the role of mitochondrial ROS in CC-induced CD36 expression and foam cell formation, it is possible that XO and NADPH oxidase-mediated ROS production could trigger mitochondrial ROS production in this scavenger receptor expression and foam cell formation by CC, which remains to be explored.
As ubiquitous component of cell membranes, cholesterol plays an important role in the maintenance of membrane structure and function, particularly membrane fluidity and cell signaling [52]. Previous studies have suggested that endogenous molecules trigger inflammation driving the atherosclerotic lesion development and one of those suspects is cholesterol [14], [15], [16]. Cholesterol is known to accumulate in atherosclerotic plaques in the form of cholesterol crystals in foam cells [14], [15]. In addition to this information, the present results as summarized in Fig. 9 reveal that CC via XO and NADPH oxidase-dependent ROS production and BTK activation leads to p300 tyrosine phosphorylation and activation, which in turn, by acetylating STAT1 facilitates STAT1 interaction with PPARγ in mediating CD36 expression, oxLDL uptake and foam cell formation.
Fig. 9.
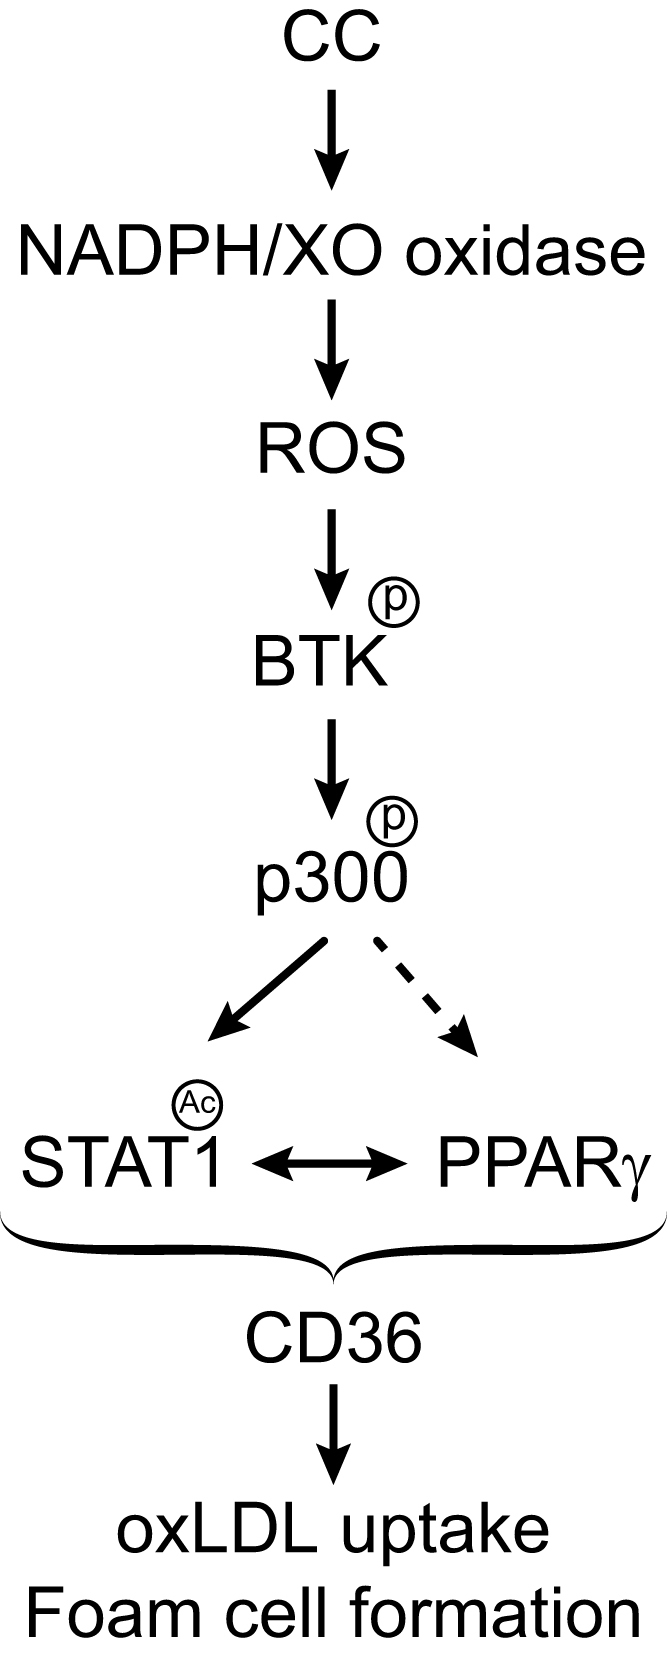
Schematic diagram shows the potential mechanisms of CD36 expression and foam cell formation by cholesterol crystals.
Conflict of interest
The authors have no conflict of interest to declare.
Acknowledgements
This work was supported by HL064165 grant from NHLBI to GNR.
References
- 1.Hansson G.K., Hermansson A. The immune system in atherosclerosis. Nat. Immunol. 2011;12:204–212. doi: 10.1038/ni.2001. [DOI] [PubMed] [Google Scholar]
- 2.Libby P., Ridker P.M., Hansson G.K. Progress and challenges in translating the biology of atherosclerosis. Nature. 2011;473:317–325. doi: 10.1038/nature10146. [DOI] [PubMed] [Google Scholar]
- 3.Demer L., Tintut Y. The roles of lipid oxidation products and receptor activator of nuclearfactor-κB signaling in atherosclerotic calcification. Circ. Res. 2011;108:1482–1493. doi: 10.1161/CIRCRESAHA.110.234245. [DOI] [PMC free article] [PubMed] [Google Scholar]
- 4.Steinberg D. Lipoproteins and the pathogenesis of atherosclerosis. Circulation. 1987;76:508–514. doi: 10.1161/01.cir.76.3.508. [DOI] [PubMed] [Google Scholar]
- 5.Pearson A., Lux A., Krieger M. Expression cloning of dSR-C1, a class C macrophage-specific scavenger receptor from Drosophila melanogaster. Proc. Natl. Acad. Sci. USA. 1995;92:4056–4060. doi: 10.1073/pnas.92.9.4056. [DOI] [PMC free article] [PubMed] [Google Scholar]
- 6.Rigotti A., Acton S.L., Krieger M. The class B scavenger receptors SR-BI and CD36 are receptors for anionic phospholipids. J. Biol. Chem. 1995;270:16221–16224. doi: 10.1074/jbc.270.27.16221. [DOI] [PubMed] [Google Scholar]
- 7.Endemann G., Stanton L.W., Madden K.S., Bryant C.M., White R.T., Protter A.A. CD36 is a receptor for oxidized low density lipoprotein. J. Biol. Chem. 1993;268:11811–11816. [PubMed] [Google Scholar]
- 8.Nicholson A.C., Frieda S., Pearce A., Silverstein R.L. Oxidized LDL binds to CD36 on human monocyte-derived macrophages and transfected cell lines. Evidence implicating the lipid moiety of the lipoprotein as the binding site. Arterioscler. Thromb. Vasc. Biol. 1995;15:269–275. doi: 10.1161/01.atv.15.2.269. [DOI] [PubMed] [Google Scholar]
- 9.Cho S. CD36 as a therapeutic target for endothelial dysfunction in stroke. Curr. Pharm. Des. 2012;18:3721–3730. doi: 10.2174/138161212802002760. [DOI] [PMC free article] [PubMed] [Google Scholar]
- 10.Tandon N.N., Kralisz U., Jamieson G.A. Identification of glycoprotein IV (CD36) as a primary receptor for platelet-collagen adhesion. J. Biol. Chem. 1989;264:7576–7583. [PubMed] [Google Scholar]
- 11.Christiaens V., Van Hul M., Lijnen H.R., Scroyen I. CD36 promotes adipocyte differentiation and adipogenesis. Biochim. Biophys. Acta. 2012;1820:949–956. doi: 10.1016/j.bbagen.2012.04.001. [DOI] [PubMed] [Google Scholar]
- 12.Duewell P., Kono H., Rayner K.J., Sirois C.M., Vladimer G., Bauernfeind F.G., Abela G.S., Franchi L., Nuñez G., Schnurr M., Espevik T., Lien E., Fitzgerald K.A., Rock K.L., Moore K.J., Wright S.D., Hornung V., Latz E. NLRP3 inflammasomes are required for atherogenesis and activated by cholesterol crystals. Nature. 2010;464:1357–1361. doi: 10.1038/nature08938. [DOI] [PMC free article] [PubMed] [Google Scholar]
- 13.Virmani R., Kolodgie F.D., Burke A.P., Farb A., Schwartz S.M. Lessons from sudden coronary death: a comprehensive morphological classification scheme for atherosclerotic lesions. Arterioscler. Thromb. Vasc. Biol. 2000;20:1262–1275. doi: 10.1161/01.atv.20.5.1262. [DOI] [PubMed] [Google Scholar]
- 14.Abela G.S. Cholesterol crystals piercing the arterial plaque and intima trigger local and systemic inflammation. J. Clin. Lipidol. 2010;4:156–164. doi: 10.1016/j.jacl.2010.03.003. [DOI] [PubMed] [Google Scholar]
- 15.Kolodgie F.D., Burke A.P., Nakazawa G., Cheng Q., Xu X., Virmani R. Free cholesterol in atherosclerotic plaques: where does it come from? Curr. Opin. Lipidol. 2007;18:500–507. doi: 10.1097/MOL.0b013e3282efa35b. [DOI] [PubMed] [Google Scholar]
- 16.Samstad E.O., Niyonzima N., Nymo S., Aune M.H., Ryan L., Bakke S.S., Lappegård K.T., Brekke O.L., Lambris J.D., Damås J.K., Latz E., Mollnes T.E., Espevik T. Cholesterol crystals induce complement-dependent inflammasome activation and cytokine release. J. Immunol. 2014;192:2837–2845. doi: 10.4049/jimmunol.1302484. [DOI] [PMC free article] [PubMed] [Google Scholar]
- 17.Binder C.J., Papac-Milicevic N., Witztum J.L. Innate sensing of oxidation-specific epitopes in health and disease. Nat. Rev. Immunol. 2016;16:485–497. doi: 10.1038/nri.2016.63. [DOI] [PMC free article] [PubMed] [Google Scholar]
- 18.Han J., Hajjar D.P., Tauras J.M., Nicholson A.C. Cellular cholesterol regulates expression of the macrophage type B scavenger receptor, CD36. J. Lipid Res. 1999;40:830–838. [PubMed] [Google Scholar]
- 19.Feng J., Han J., Pearce S.F., Silverstein R.L., Gotto A.M., Jr, Hajjar D.P., Nicholson A.C. Induction of CD36 expression by oxidized LDL and IL-4 by a common signaling pathway dependent on protein kinase C and PPAR-gamma. J. Lipid Res. 2000;41:688–696. [PubMed] [Google Scholar]
- 20.Flynn G.L., Shah Y., Prakongpan S., Kwan K.H., Higuchi W.I., Hofmann A.F. Cholesterol solubility in organic solvents. J. Pharm. Sci. 1979;68:1090–1097. doi: 10.1002/jps.2600680908. [DOI] [PubMed] [Google Scholar]
- 21.Kotla S., Singh N.K., Heckle M.R., Tigyi G.J., Rao G.N. The transcription factor CREB enhances interleukin-17A production and inflammation in a mouse model of atherosclerosis. Sci. Signal. 2013;6 doi: 10.1126/scisignal.2004214. (ra83) [DOI] [PMC free article] [PubMed] [Google Scholar]
- 22.Zhou M., Diwu Z., Panchuk-Voloshina N., Haugland R.P. A stable nonfluorescent derivative of resorufin for the fluorometric determination of trace hydrogen peroxide: applications in detecting the activity of phagocyte NADPH oxidase and other oxidases. Anal. Biochem. 1997;253:162–168. doi: 10.1006/abio.1997.2391. [DOI] [PubMed] [Google Scholar]
- 23.Kotla S., Singh N.K., Traylor J.G., Jr, Orr A.W., Rao G.N. ROS-dependent Syk and Pyk2-mediated STAT1 activation is required for 15(S)-hydroxyeicosatetraenoic acid-induced CD36 expression and foam cell formation. Free Radic. Biol. Med. 2014;76:147–162. doi: 10.1016/j.freeradbiomed.2014.08.007. [DOI] [PMC free article] [PubMed] [Google Scholar]
- 24.McLaren J.E., Michael D.R., Salter R.C., Ashlin T.G., Calder C.J., Miller A.M., Liew F.Y., Ramji D.P. IL-33 reduces macrophage foam cell formation. J. Immunol. 2010;185:1222–1229. doi: 10.4049/jimmunol.1000520. [DOI] [PubMed] [Google Scholar]
- 25.Rahaman S.O., Swat W., Febbraio M., Silverstein R.L. Vav family Rho guanine nucleotide exchange factors regulate CD36-mediated macrophage foam cell formation. J. Biol. Chem. 2011;286:7010–7017. doi: 10.1074/jbc.M110.192450. [DOI] [PMC free article] [PubMed] [Google Scholar]
- 26.Febbraio M., Podrez E.A., Smith J.D., Hajjar D.P., Hazen S.L., Hoff H.F., Sharma K., Silverstein R.L. Targeted disruption of the class B scavenger receptor CD36 protects against atherosclerotic lesion development in mice. J. Clin. Invest. 2000;105:1049–1056. doi: 10.1172/JCI9259. [DOI] [PMC free article] [PubMed] [Google Scholar]
- 27.Kotla S., Rao G.N. Reactive oxygen species (ROS) Mediate p300-dependent STAT1 protein interaction with peroxisome proliferator-activated receptor (PPAR)-γ in CD36 protein expression and foam cell formation. J. Biol. Chem. 2015;290:30306–30320. doi: 10.1074/jbc.M115.686865. [DOI] [PMC free article] [PubMed] [Google Scholar] [Retracted]
- 28.Agrawal S., Febbraio M., Podrez E., Cathcart M.K., Stark G.R., Chisolm G.M. Signal transducer and activator of transcription 1 is required for optimal foam cell formation and atherosclerotic lesion development. Circulation. 2007;115:2939–2947. doi: 10.1161/CIRCULATIONAHA.107.696922. [DOI] [PubMed] [Google Scholar]
- 29.Wu Y.Y., Bradshaw R.A. Activation of the Stat3 signaling pathway is required for differentiation by interleukin-6 in PC12-E2 cells. J. Biol. Chem. 2000;275:2147–2156. doi: 10.1074/jbc.275.3.2147. [DOI] [PubMed] [Google Scholar]
- 30.Yuan Z.L., Guan Y.J., Chatterjee D., Chin Y.E. Stat3 dimerization regulated by reversible acetylation of a single lysine residue. Science. 2005;307:269–273. doi: 10.1126/science.1105166. [DOI] [PubMed] [Google Scholar]
- 31.Krämer O.H., Knauer S.K., Greiner G., Jandt E., Reichardt S., Gührs K.H., Stauber R.H., Böhmer F.D., Heinzel T. A phosphorylation-acetylation switch regulates STAT1 signaling. Genes Dev. 2009;23:223–235. doi: 10.1101/gad.479209. [DOI] [PMC free article] [PubMed] [Google Scholar]
- 32.Kundumani-Sridharan V., Van Quyen D., Subramani J., Singh N.K., Chin Y.E., Rao G.N. Novel interactions between NFATc1 (Nuclear Factor of Activated T cells c1) and STAT-3 (Signal Transducer and Activator of Transcription-3) mediate G protein-coupled receptor agonist, thrombin-induced biphasic expression of cyclin D1, with first phase influencing cell migration and second phase directing cell proliferation. J. Biol. Chem. 2012;287:22463–22482. doi: 10.1074/jbc.M112.362996. [DOI] [PMC free article] [PubMed] [Google Scholar]
- 33.Nagy L., Tontonoz P., Alvarez J.G., Chen H., Evans R.M. Oxidized LDL regulates macrophage gene expression through ligand activation of PPARgamma. Cell. 1998;93:229–240. doi: 10.1016/s0092-8674(00)81574-3. [DOI] [PubMed] [Google Scholar]
- 34.Huang J.T., Welch J.S., Ricote M., Binder C.J., Willson T.M., Kelly C., Witztum J.L., Funk C.D., Conrad D., Glass C.K. Interleukin-4-dependent production of PPAR-gamma ligands in macrophages by 12/15-lipoxygenase. Nature. 1999;400:378–382. doi: 10.1038/22572. [DOI] [PubMed] [Google Scholar]
- 35.Szanto A., Nagy L. Retinoids potentiate peroxisome proliferator-activated receptor gamma action in differentiation, gene expression, and lipid metabolic processes in developing myeloid cells. Mol. Pharmacol. 2005;67:1935–1943. doi: 10.1124/mol.104.006445. [DOI] [PubMed] [Google Scholar]
- 36.Chen L.F., Mu Y., Greene W.C. Acetylation of RelA at discrete sites regulates distinct nuclear functions of NFκB. EMBO J. 2002;21:6539–6548. doi: 10.1093/emboj/cdf660. [DOI] [PMC free article] [PubMed] [Google Scholar]
- 37.Oeckler R.A., Kaminski P.M., Wolin M.S. Stretch enhances contraction of bovine coronary arteries via an NAD(P)H oxidase-mediated activation of the extracellular signal-regulated kinase mitogen-activated protein kinase cascade. Circ. Res. 2003;92:23–31. doi: 10.1161/01.res.0000051860.84509.ce. [DOI] [PubMed] [Google Scholar]
- 38.Bhattacharyya A., Chattopadhyay R., Mitra S., Crowe S.E. Oxidative stress: an essential factor in the pathogenesis of gastrointestinal mucosal diseases. Physiol. Rev. 2014;94:329–354. doi: 10.1152/physrev.00040.2012. [DOI] [PMC free article] [PubMed] [Google Scholar]
- 39.Dawson P., Hofmann S., van de Westhuyzen D., Sudhof T., Brown M., Goldstein J. Sterol-dependent repression of low density lipoprotein receptor promotor mediated by 16-base pair sequence adjacent to binding site for transcription factor Sp1. J. Biol. Chem. 1988;263:3372–3379. [PubMed] [Google Scholar]
- 40.Williams K.J., Tabas I. The response-to-retention hypothesis of earlyatherogenesis. Arterioscler. Thromb. Vasc. Biol. 1995;15:551–561. doi: 10.1161/01.atv.15.5.551. [DOI] [PMC free article] [PubMed] [Google Scholar]
- 41.Podrez E.A., Febbraio M., Sheibani N., Schmitt D., Silverstein R.L., Hajjar D.P., Cohen P.A., Frazier W.A., Hoff H.F., Hazen S.L. Macrophage scavenger receptor CD36 is the major receptor for LDL modified by monocyte-generated reactive nitrogen species. J. Clin. Invest. 2000;105:1095–1108. doi: 10.1172/JCI8574. [DOI] [PMC free article] [PubMed] [Google Scholar]
- 42.Liu Y., Denlinger C.E., Rundall B.K., Smith P.W., Jones D.R. Suberoylanilide hydroxamic acid induces Akt-mediated phosphorylation of p300, which promotes acetylation and transcriptional activation of RelA/p65. J. Biol. Chem. 2006;281:31359–31368. doi: 10.1074/jbc.M604478200. [DOI] [PubMed] [Google Scholar]
- 43.Mohamed A.J., Yu L., Bäckesjö C.M., Vargas L., Faryal R., Aints A., Christensson B., Berglöf A., Vihinen M., Nore B.F., Smith C.I. Bruton's tyrosine kinase (Btk): function, regulation, and transformation with special emphasis on the PH domain. Immunol. Rev. 2009;228:58–73. doi: 10.1111/j.1600-065X.2008.00741.x. [DOI] [PubMed] [Google Scholar]
- 44.Mangla A., Khare A., Vineeth V., Panday N.N., Mukhopadhyay A., Ravindran B., Bal V., George A., Rath S. Pleiotropic consequences of Bruton tyrosine kinase deficiency in myeloid lineages lead to poor inflammatory responses. Blood. 2004;104:1191–1197. doi: 10.1182/blood-2004-01-0207. [DOI] [PubMed] [Google Scholar]
- 45.Uckun F.M. Bruton's tyrosine kinase (BTK) as a dual-function regulator of apoptosis. Biochem. Pharmacol. 1998;56:683–691. doi: 10.1016/s0006-2952(98)00122-1. [DOI] [PubMed] [Google Scholar]
- 46.Vargas L., Hamasy A., Nore B.F., Smith C.I. Inhibitors of BTK and ITK: state of the new drugs for cancer, autoimmunity and inflammatory diseases. Scand. J. Immunol. 2013;78:130–139. doi: 10.1111/sji.12069. [DOI] [PubMed] [Google Scholar]
- 47.Ito M., Shichita T., Okada M., Komine R., Noguchi Y., Yoshimura A., Morita R. Bruton's tyrosine kinase is essential for NLRP3 inflammasome activation and contributes to ischaemic brain injury. Nat. Commun. 2015;6:7360. doi: 10.1038/ncomms8360. [DOI] [PMC free article] [PubMed] [Google Scholar]
- 48.Liu H., Colavitti R., Rovira I.I., Finkel T. Redox-dependent transcriptional regulation. Circ. Res. 2005;97:967–974. doi: 10.1161/01.RES.0000188210.72062.10. [DOI] [PubMed] [Google Scholar]
- 49.Brown D.I., Griendling K.K. Regulation of signal transduction by reactive oxygen species in the cardiovascular system. Circ. Res. 2015;116:531–549. doi: 10.1161/CIRCRESAHA.116.303584. [DOI] [PMC free article] [PubMed] [Google Scholar]
- 50.Cai H., Harrison D.G. Endothelial dysfunction in cardiovascular diseases: the role of oxidant stress. Circ. Res. 2000;87:840–844. doi: 10.1161/01.res.87.10.840. [DOI] [PubMed] [Google Scholar]
- 51.Rezaie-Majd A., Maca T., Bucek R.A., Valent P., Müller M.R., Husslein P., Kashanipour A., Minar E., Baghestanian M. Simvastatin reduces expression of cytokines interleukin-6, interleukin-8, and monocyte chemoattractant protein-1 in circulating monocytes from hypercholesterolemic patients. Arterioscler. Thromb. Vasc. Biol. 2002;22:1194–1199. doi: 10.1161/01.atv.0000022694.16328.cc. [DOI] [PubMed] [Google Scholar]
- 52.Sorci-Thomas M.G., Thomas M.J. Microdomains, inflammation, and atherosclerosis. Circ. Res. 2016;118:679–691. doi: 10.1161/CIRCRESAHA.115.306246. [DOI] [PMC free article] [PubMed] [Google Scholar]