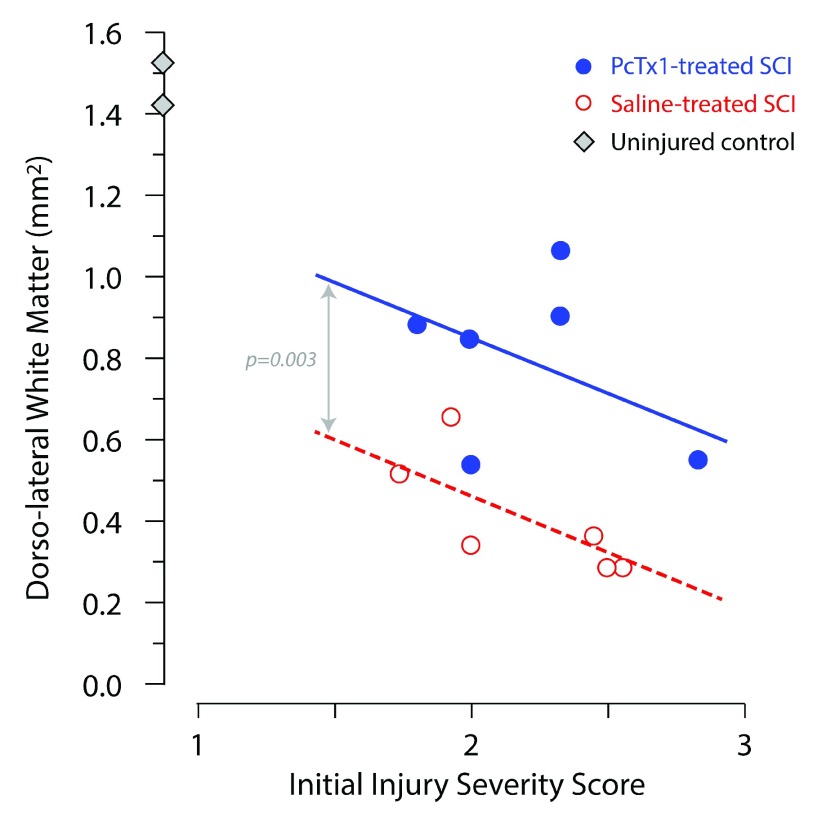
Figure 5. Cross-sectional areas of luxol fast blue (LFB) staining of the dorsolateral white matter (dlWM) 6 weeks after injury plotted against each rats’ initial injury severity (SIS score).
Saline-treated rats (red open circles; n=6), PcTx1-treated rats (blue circles; n=6) and control rats (grey diamonds; n=2) are shown. All measurements were the average of two sections from the injury centre of each animal. The correlation lines shown were fitted by least squares linear regression. The data were best described by two separate lines of the same slope, but with a statistically significant difference in elevation (p=0.003, ANCOVA).

