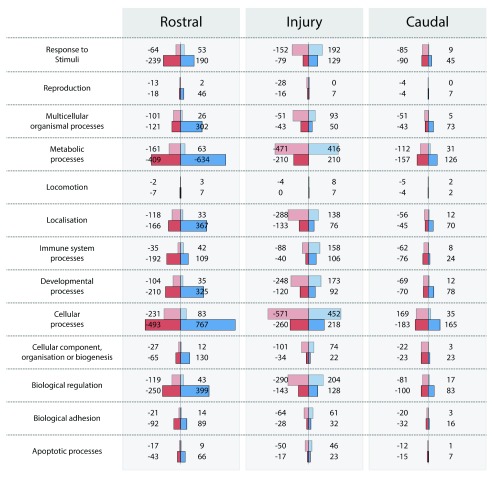
Figure 9. Biological characterization of the significantly (FC>2 or FC<-2) up-regulated (blue; positive) and down-regulated (red; negative) transcripts in response to PcTx1 treatment (‘Panther’ gene classification system, Mi et al., 2013).
Separate datasets were obtained from animals with SIS scores of 2.5 (top, lighter bars) and 2.75 (lower, darker bars).

