

Abstract
Past studies have shown incontrovertible evidence for the existence of covert contrasts in children’s speech, that is, differences between target productions that are nonetheless transcribed with the same phonetic symbol. Moreover, there is evidence that these are relevant to forming prognoses and tracking progress in children with speech sound disorder. A challenge remains to find the most efficient and reliable methods for assessing covert contrasts. This study investigates how readily listeners can identify covert contrasts in children’s speech when using a continuous rating scale in the form of a visual analog scale (VAS) to denote children’s productions. Individual listeners’ VAS responses were found to correlate statistically significantly with a variety of continuous measures of children’s production accuracy, including judgments of binary accuracy pooled over a large set of listeners. These findings reinforce the growing body of evidence that VAS judgments are potentially useful clinical measures of covert contrast.
Keywords: Fricative, Children, Speech Perception, Assessment, Covert Contrast
Children learn to speak like adults in a remarkably short period of time. Numerous cross-sectional and longitudinal studies have shown that by the age of only 5 or 6 years, children produce most or all of the sounds of their language correctly, as judged by phonetic transcriptions made by experienced transcribers (e.g., Smit, Hand, Freilinger, Bernthal, & Bird, 1990). From the first vocalizations to the point at which children’s productions are transcribed as completely accurate, children are learning contrasts among linguistically relevant units. The earliest contrasts that children learn may be as simple as the contrast between different syllable shapes. As children later produce more adult-like speech, they are able to produce even such fine-grained contrasts as the contrast between two highly similar sounds.
Considerable within- and between-child variability exists in the production of sounds, from the earliest transcribable vocalizations to the achievement of adult-like speech. This variability can be seen in phonetic transcriptions of children’s speech. For example, while each speech sound in adult speech would likely be transcribed as a correct production, transcriptions of children’s speech commonly contain notations of substitutions, distorted productions, and deletions. Furthermore, transcriptions may reveal that children’s productions of a given speech sound vary across productions (e.g., Macrae, Tyler, & Lewis, 2014; Macrae & Sosa, 2015). For example, a child might be transcribed as correctly producing a given speech sound on 50% of attempts, while the remainder of attempts are transcribed as errors.
However, there is much variability in children’s speech that is less easily captured using phonetic transcription. Children’s speech sound productions vary considerably in terms of their fine-grained, articulatory-acoustic properties. Even if a child is perceived as producing a clear example of a given sound, the production may still vary acoustically from a typical adult production. This kind of variability can be viewed as existing at the phonetic or subphonemic level, because it encompasses variability that can exist within phoneme categories. Research on covert contrast documents this articulatory-acoustic variability in child speech. Covert contrast occurs when significant articulatory differences are present between two phonemes in a child’s speech, but both phonemes are transcribed with the same symbol. Because both variants fall within a single adult phonemic category, transcribers denote the two variants with the same phoneme symbol. Covert contrast has been found in the speech of typically developing children and children with phonological disorders for contrasts involving voicing and place of articulation for both stops and fricatives (e.g., Baum & McNutt, 1990; Forrest, Weismer, Elbert, & Dinnsen, 1994; Forrest, Weismer, Hodge, Dinnsen, & Elbert, 1990; Gierut & Dinnsen, 1986; Hewlett, 1988; Li, Edwards & Beckman, 2009; Macken & Barton, 1980; Maxwell & Weismer, 1982; Scobbie, Gibbon, Hardcastle, & Fletcher, 2000). For example, Baum and McNutt (1990) compared children’s correct productions of /θ/ with correct productions of /s/ and frontal misarticulations of /s/. Although frontal misarticulations of /s/ are commonly described as substitutions of /θ/, acoustic analyses revealed significant differences between frontal misarticulations and correct productions of both /s/ and /θ/.
Given that the role of the Speech Language Pathologist (SLP) is to accurately and thoroughly characterize children’s speech sound productions, it is clear that SLPs would benefit from assessment methods that would allow them to describe variability at the phoneme level, as well as differences in phonetic detail within phonemes. Most of the standardized assessments of children’s speech use phonetic transcription. Phonetic transcription involves denoting a clinician’s auditory-perceptual judgment of a child’s speech sound production with a finite set of symbols. This allows for a coarse-grained description of the production using phonetic symbols, which are then used to make binary judgments of correct or incorrect. However, as discussed above, this method fails to characterize more subtle phonetic variability within children’s speech.
Baum and McNutt’s (1990) findings on the acoustics of frontal misarticulations illustrate this point. Using transcription alone, children’s frontal misarticulations of /s/ might be transcribed as a substitution error and denoted with the phonetic symbol [θ]. Similarly, correct productions of /θ/ would also be transcribed with [θ]. However, Baum and McNutt found that there were systematic acoustic differences between these two types of [θ]. Labeling the frontal misarticulation as a substitution error does provide a coarse-grained description of the child’s production. In addition, it highlights the potential linguistic consequences of such errors (e.g., an inability to convey meaning for words containing these sounds resulting in reduced speech intelligibility and, consequently, less-effective communication). However, more fine-grained information is lost—namely the fact that the children were, in fact, making a systematic contrast between target /s/ and target /θ/. This highlights the limitations that are imposed when phonetic transcription is used as the sole method for denoting children’s speech productions. When children’s productions vary subtly in acoustic-phonetic properties from a prototypical adult form, the use of transcription may obscure potentially important information, such as that the children are capable of producing a contrast between two phonemes. In other words, children may perceive that two phonemes are different and have begun to produce them differently at a sub-phonemic level, but the difference between them is not large enough to be transcribed as such when coarse-grained systems are used. This distinction has important implications for the assessment and treatment of children with disorders in speech-sound production, as it has been shown that children who exhibit covert contrast progress more quickly in therapy than children without covert contrast (Tyler, Figurski & Langdale, 1993). Moreover, a fine-grained system might allow individuals to document within-category improvement in phoneme production in children receiving speech therapy in a way that is impossible with phonetic transcription.
Given this limitation, an obvious question that arises is how we can improve upon current transcription methods to better characterize children’s speech, such that information on fine phonetic detail is not lost. Some researchers have suggested that one way to improve transcription is to distinguish between intermediate productions (which are perceived as in between two phonemes) and correct productions or clear substitutions (e.g., Stoel-Gammon, 2001; Edwards & Beckman, 2008). To the extent that listeners can perceive these intermediate sounds, this would allow coding of subtle distinctions that may be lost using the standard transcription process. While this approach is promising, it is not in wide use, and little research exists on the reliability and validity of using an intermediate category during transcription. Moreover, this method only increases the number of categories that can be denoted from two to three.
A second possibility is to pool perceptual judgments of a large set of naïve listeners together to examine fine phonetic detail. This possibility was explored by Li, Munson, Edwards, Yoneyama, and Hall (2011) and by Munson and Urberg Carlson (2015). Munson and Urberg Carlson (2015) examined adults’ perception of children’s productions of target /s/ and /ʃ/ in three different experiments. They found that the proportion of listeners who judged a token to be /s/ was well predicted by acoustic characteristics of the fricatives being rated. Figure 1 plots data reported by Munson and Urberg Carlson. It shows that the relationship between the percentage of listeners who judged a token to be /s/ and centroid frequency (an acoustic measure that distinguishes between /s/ and /ʃ/, Jongman, Wayland, and Wong, 2000) was relatively linear. Average judgments can therefore potentially be used to measure within-category differences in children’s productions. Average judgments of naïve listeners have two additional benefits. First, they are ecologically valid, as they presumably predict the cumulative feedback that children receive from members of the language community during social interactions, a claim that is developed in more detail in Julien and Munson (2012). Second, they can be used as continuous measures when a suitable acoustic or articulatory measure does not exist. The acoustic characteristics of obstruent consonants are still actively debated, and for some sound contrasts no one acoustic measure differentiates between endpoints. For example, the contrast between /s/ and /θ/ is reflected in the spectral centroid, the spread of energy in the spectrum, and the intensity of the fricative (Jongman et al., 2000). However, average judgments have the obvious disadvantage of requiring a large group of individuals to provide judgments, rather than a single listener.
Figure 1.
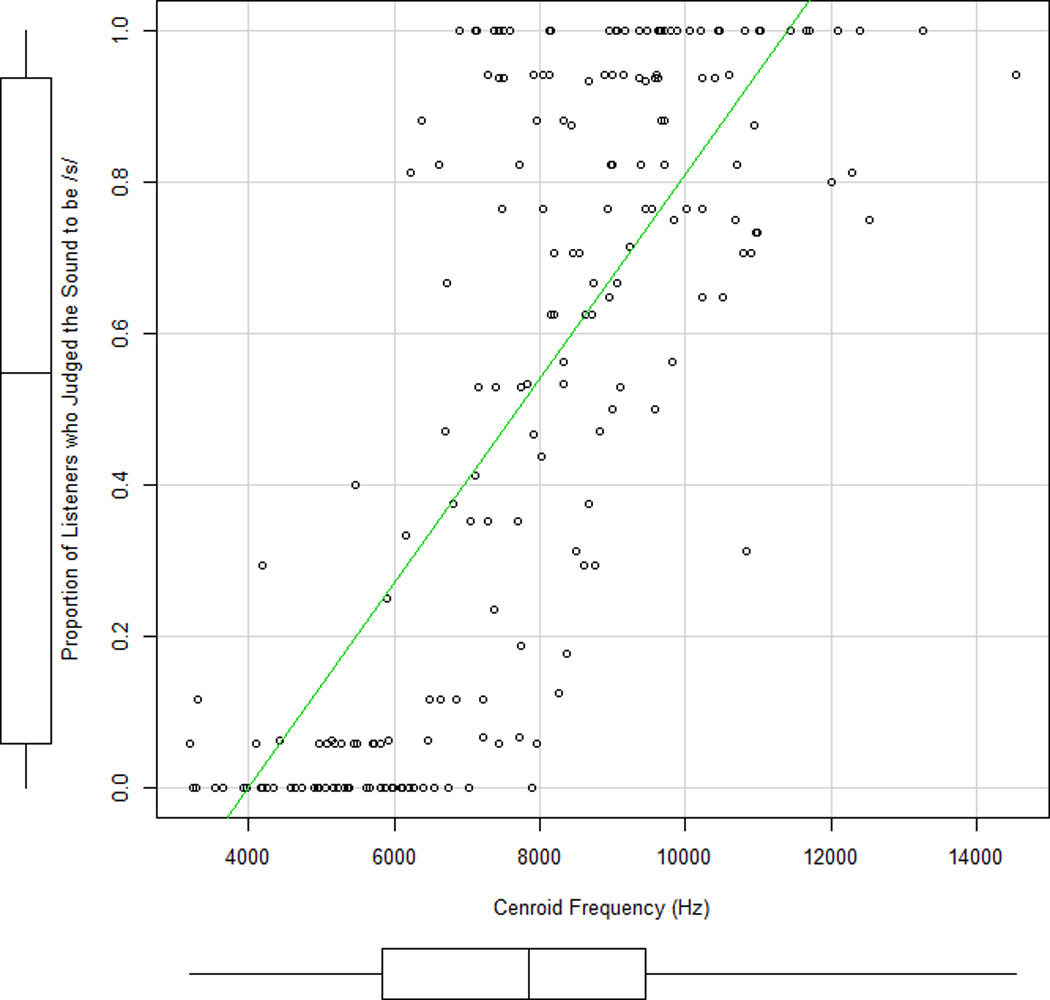
Scatterplot showing the association between the proportion of listeners who judge a sound to be /s/ and the centroid frequency for a 40 ms interval of frication centered at the fricative midpoint. These data are a re-analysis of responses reported in Munson and Urberg Carlson (2015)
The final possibility is to use an assessment tool that is not categorical in nature and which can be made by individual listeners. While transcription requires a listener to listen to continuous acoustic-phonetic signals and then assign the resulting percept to one of a finite number of categories (e.g. the “s” sound versus the “th” sound), other tasks allow for a graded response. Using measures that allow for continuous responses, a number of experimental studies have shown that listeners can indeed perceive subtle within-category acoustic differences for obstruents in certain tasks (e.g., Massaro & Cohen, 1983; McMurray, Tanenhaus, & Aslin, 2002; Carney, Widin, & Viemeister, 1977; Pisoni & Tash, 1974). Indeed, work by Toscano, McMurray, Dennhardt and Luck (2010) shows that these graded responses are reflected in electrophysiological responses both of auditory encoding and phonemic categorization.
One type of tool that allows for continuous responses for the assessment of children’s speech sounds is visual analog scaling (VAS). VAS is often used in the assessment of complex, multidimensional percepts, such as the perception of pain in clinical medical settings. There is considerable research on the reliability and validity of this measure in the pain literature (e.g., Price, McGrath, Rafii & Buckingham, 1983; Bijur, Silver, & Gallagher, 2001; Gallagher, Liebman & Bijur, 2001). It is also used widely in the study of voice disorders and is part of one standardized voice assessment, the CAPE-V (Kempster, Gerratt, Verdolini Abbott, Barkmeier-Kraemer, & Hillman, 2009). VAS has also been used to study adults’ perception of children’s speech. In one such procedure, Munson, Johnson, and Edwards (2012) presented participants with a horizontal line with endpoints anchored with the text “the ‘s’ sound” at one end and “the ‘th’ sound” at the other end. Listeners were presented with children’s productions of target /s/ and target /θ/ and were asked to use a mouse to click a point on the line where they perceived that a given sound production fell along the continuum. Munson et al. found a strong correlation between the click location for individual stimuli and acoustic measures of the stimuli. This suggests that not only were listeners able to perceive subphonemic variation in the productions, but also that their perceptions were related to the actual physical properties of the speech signal. Subsequent research by Munson and Urberg Carlson (2015) has shown that VAS is psychometrically superior to two other continuous measures of within-category variation, Likert scale judgments and direct magnitude estimates of category goodness. Julien and Munson (2012) showed that VAS ratings of children’s /s/ and /ʃ/ productions are correlated with the centroid frequency of the fricative. Centroid frequency distinguishes between productions of /s/ and /ʃ/.
Further evidence of the utility of VAS in assessing within-category variation comes from Munson, Edwards, Schellinger, Beckman, and Meyer (2010). Munson et al. examined the relationship between VAS ratings and transcription categories. Children’s productions of /s/ and /θ/ were first transcribed by a trained phonetician using Stoel-Gammon’s (2001) suggestion to code intermediate productions. Six transcription categories were used: correct /s/, clear substitution of [s] for /θ/, intermediate but closer to /s/, intermediate but closer to /θ/, clear substitution of [θ] for /s/, and correct /θ/. VAS judgments were then elicited from a set of listeners using a line with endpoints representing /s/ and /θ/. Participants listened to children’s speech sounds and rated where they perceived the sound to fall along the line. Researchers reported that mean VAS ratings were significantly different for each of the transcription categories. Furthermore, the pattern was exactly as expected; correct /s/ transcriptions had the highest mean click location (i.e., were closer to the “s” end of the line), followed in order by substitutions of [s] for / θ /, intermediate productions closer to /s/, intermediate productions closer to /θ/, and substitutions of [θ] for /s/. Finally, correct productions of /θ/ had the lowest mean VAS rating (i.e., were closest to the “th” end of the line). Subsequent research has used VAS to evaluate a variety of other speech contrasts, most notably the contrast between correct and incorrect /r/ productions (McAllister Byun, Halpin, & Harrell, 2015; McAllister Byun, Halpin, & Szeredi, 2015) and the contrast between /t/ and /k/ (Strombergsson, Salvi, & House, 2015).
The results of Munson et al. (2010) suggest that VAS ratings differ as a function of subtle subphonemic differences across productions. However, these results are based on VAS ratings averaged across listeners for all the tokens in a given transcription category. Individual tokens within a transcription category vary for meaningful reasons (i.e., because of specific characteristics of the talkers who produced them, or the words in which they were produced. . Hence, the analyses used by Munson et al. reflect what Clark (1973) referred to as the “language as fixed-effect fallacy,” as they do not model the effects of token-level variation on performance. Moreover, these results do not tell us whether individual listeners’ VAS judgments for specific items also serve as a continuous measure of subtle subphonemic differences. In clinical practice, it is generally a single clinician who assesses a child’s speech during the assessment process. Therefore, if a task such as VAS is to have clinical utility, it is necessary to determine whether individual listeners’ ratings of individual tokens, rather than just averages across transcription categories, continuously track subphonemic detail.
This current study was designed as a follow-up to Munson et al. (2010) to address this limitation. Specifically, we wanted to determine whether individual listeners’ VAS ratings of children’s productions of individual speech tokens reflected continuous variation in category goodness. To accomplish this goal, we developed two primary research questions.
First, we asked whether individual listeners used the entire VAS line to report their perceptions, or whether they instead tended to simply respond by clicking at discrete locations along the line, such as endpoints. To evaluate this, we first visually examined plots depicting the distributions of individual listeners’ VAS ratings. Next, we conducted two statistical analyses. The first examined the extent to which individual listeners’ ratings differentiated among six types of transcriptions made using the very fine-grained transcription system described by Munson et al. (2010). Next, we used mixture models to decompose the listeners’ distribution of responses into different underlying distributions.
Our second primary research question relates to the concurrent validity of VAS. Specifically we asked whether individual listeners’ VAS ratings could be predicted by a continuous measure of how /s/ or /θ/-like each stimulus was, beyond how well they could be predicted by a binary categorization of the sound as /s/ or /θ/. In this study, the continuous measure was binary judgments of whether the sound was /s/ or /θ/, averaged across multiple listeners, to which we refer henceforth as community identification judgments. If community judgments are more predictive of VAS judgments than are binary judgments provided by a single transcriber, it would suggest that use of VAS may be a valid way to obtain information on fine phonetic detail in children’s speech.
To answer these research questions, we conducted two experiments on adult listeners’ perception of children’s productions of two speech sounds: /s/ and /θ/. We elicited perceptual judgments from one group of listeners using VAS and from another group of listeners using binary identification judgments. We chose the /s/ and /θ/ sounds for several reasons. First, both are typically mastered relatively late in development (e.g., Sander, 1972; Fudala & Reynolds, 1986; Smit et al., 1990). Additionally, children are often observed to produce /θ/-like substitutions for /s/ (McGlone & Proffitt, 1973; Smit, et al., 1990). Furthermore, as discussed earlier, Baum and McNutt (1990) documented covert contrast in children’s productions of these sounds. Therefore, we felt confident that using these speech sounds would ensure variability in terms of the fine phonetic detail contained in the speech productions. Furthermore, we believed that because of this phonetic variability, it was likely that some of these productions might be perceived as more “ambiguous” or “intermediate.” Finally, there is no one acoustic measure that differentiates between /s/ and /θ/ in English. As described in Jongman et al. (2000) and below, a combination of acoustic measures are needed to distinguish productions of these sounds. A given sound may be intermediate because of intermediacy in any of these parameters. Moreover, individual listeners might differ in their weighting of these parameters. These two facts mean that a study of individual differences in the relationship between acoustics and perception of the /s/-/θ/ contrast would be methodologically very difficult. This makes the community identification judgments of /s/ and /θ/ a particularly appropriate measure of continuous variation.
Methods
VAS Task
This study used the same set of VAS data described in Munson et al. (2010). Given that Munson et al. only provided a cursory explanation of the methods used to obtain these data, a more detailed description will be presented here.
Participants
Twenty-one adult listeners participated in the VAS rating task. All were living in Minneapolis, MN, were native speakers of North American English, and were between the ages of 18 and 45. Participants were recruited by referral or by postings at the University of Minnesota and in the surrounding community. According to self-report, none of the participants had a history of speech, language, or hearing disorders. Each participant provided informed consent and was compensated for his or her time.
Stimuli
For this experiment, 200 word-initial CV syllables beginning with /s/ and /θ/ were excised from single word productions of familiar words (such as sofa) and non-words (such as /sʌpʰoʊn/) which were elicited from typically-developing two- to five-year-old native English speakers using a word repetition task. These words came from a larger study (Edwards & Beckman, 2008) on obstruent development across several languages. Full details of the elicitation protocol, as well as a description of the effects of lexicality, word length, and prosodic structure on consonant accuracy, can be found in Edwards and Beckman (2008). Briefly, each child participated in a word repetition task that was conducted in a quiet room at his or her preschool. Each word or non-word stimulus began with a single obstruent consonant, followed by a monophthong vowel, and was between one and four syllables. Words and nonwords were presented using a laptop computer, and a corresponding picture was shown on the screen. For non-words, pictures of unfamiliar objects without commonly known names were used. Children were asked to repeat each word or nonword, and their productions were recorded using a head-mounted microphone.
All of the words and non-words were transcribed by a native speaker of English (the first author). During the transcription process, the transcriber first made a binary judgment as to the accuracy of the /s/ or /θ/ production. The transcriber then broadly transcribed it using IPA phonetic symbols. Additionally, using Stoel-Gammon’s (2001) suggestion, the transcriber identified and coded productions that she perceived as intermediate between /s/ and /θ/, differentiating between those that were intermediate but closer to /s/, and intermediate but closer to /θ/. The CV syllables that were selected for this experiment were those transcribed as containing one of the following: a correct /s/, a correct /θ/, an [s] for /θ/ substitution, a [θ] for /s/ substitution, or a sound that was intermediate between /s/ and /θ/. The latter category was subdivided into intermediate productions deemed to be closer to /s/ (henceforth [s:θ]) or ones deemed to be closer to /θ/ (henceforth [θ:s]) The intention behind using these specific transcription categories was to develop a set of stimuli that included a great deal of natural variation along the continuum from /s/ to /θ/.
To select the specific CVs to use in this study, we first identified every instance of a child’s production in the corpus created in the Edwards and Beckman (2008) study that fell into one of these transcription categories. Next, we eliminated those productions for which the vowel was transcribed as being produced incorrectly. The first author then listened to each of the remaining CV stimuli. Productions for which the presence of background noise in the recording was felt to obscure either the consonant or vowel sound were eliminated. Additionally, if the first author judged that it was not a good exemplar of the transcription category, then the production was omitted. Finally, the stimuli were balanced such that approximately half were transcribed as /s/ and half were transcribed as /θ/. This was done to avoid the ‘set effects’ that are commonly observed in speech perception experiments (Keating, Mikos, & Ganong, 1981). In addition, for each transcription category, vowel context and the speaker’s age were balanced as best as possible. Productions were excluded if they would upset this balance. Following these steps, 200 CV productions were included, produced by a total of 43 children (10 two-year olds, 11 three-year olds, 13 four-year-olds, and 9 five-year olds). Of these children, 21 were female and 22 were male. Each CV syllable was normalized for amplitude. The CV syllables contained the initial fricative and a 150 ms vocalic portion. Descriptions of the stimuli can be found in Tables 1 and 2.
Table 1.
Stimuli Inventory: Total number of Consonant-Vowel syllables by age, vowel context, and transcription category
| Following Vowel |
[θ] substitutions for /s/ |
Correct /θ/ | Intermediate Tokens (but slightly closer to /θ/) |
Total | |||||||||
|---|---|---|---|---|---|---|---|---|---|---|---|---|---|
| 2;0- 2;11 |
3;0- 3;11 |
4;0- 4;11 |
5;0- 5;11 |
2;0- 2;11 |
3;0- 3;11 |
4;0- 4;11 |
5;0- 5;11 |
2;0- 2;11 |
3;0- 3;11 |
4;0- 4;11 |
5;0- 5;11 |
||
| (/i/ and /ɪ/) | 1 | 1 | 2 | 0 | 0 | 4 | 13 | 14 | 2 | 2 | 4 | 1 | 44 |
| (/e/ and /ɛ/) | 0 | 4 | 1 | 0 | 0 | 0 | 0 | 0 | 1 | 2 | 1 | 1 | 10 |
| (/α/) | 4 | 4 | 0 | 1 | 0 | 1 | 1 | 2 | 1 | 2 | 2 | 2 | 20 |
| (/o/) | 2 | 1 | 0 | 0 | 0 | 0 | 0 | 0 | 1 | 1 | 2 | 0 | 7 |
| (/u/ and /ʊ/) | 0 | 3 | 0 | 0 | 0 | 2 | 5 | 4 | 1 | 1 | 2 | 1 | 19 |
|
Total: 24 |
Total: 46 |
Total: 30 |
100 | ||||||||||
Note: This table displays the 50 percent of the CV stimuli that were transcribed as /θ/ or “more /θ /-like” (for intermediate tokens).
Table 2.
Stimuli Inventory: Total number of Consonant-Vowel syllables by age, vowel context, and transcription category
| Following Vowel |
[s] substitutions for /θ/ |
Correct /s/ | Intermediate Tokens (but slightly closer to /s/) |
Total | |||||||||
|---|---|---|---|---|---|---|---|---|---|---|---|---|---|
| 2;0- 2;11 |
3;0- 3;11 |
4;0- 4;11 |
5;0- 5;11 |
2;0- 2;11 |
3;0- 3;11 |
4;0- 4;11 |
5;0- 5;11 |
2;0- 2;11 |
3;0- 3;11 |
4;0- 4;11 |
5;0- 5;11 |
||
| (/i/ and /ɪ/) | 2 | 3 | 4 | 3 | 3 | 2 | 4 | 5 | 1 | 2 | 4 | 1 | 34 |
| (/e/ and /ɛ/) | 0 | 0 | 0 | 0 | 2 | 2 | 4 | 2 | 1 | 1 | 1 | 2 | 15 |
| (/α/) | 1 | 2 | 1 | 0 | 0 | 2 | 2 | 4 | 0 | 2 | 2 | 0 | 16 |
| (/o/) | 0 | 0 | 1 | 0 | 2 | 1 | 3 | 2 | 2 | 2 | 2 | 0 | 15 |
| (/u/ and /ʊ/) | 1 | 2 | 4 | 0 | 1 | 2 | 4 | 3 | 1 | 2 | 0 | 0 | 20 |
|
Total: 24 |
Total: 50 |
Total: 26 |
100 | ||||||||||
Note: This table displays the 50 percent of the CV stimuli that were transcribed as /s/ or “more /s/-like” (for intermediate tokens).
The stimuli were subjected to a set of five acoustic measures to ensure that they contained ample variation in the acoustic features that are relevant for perception of /s/ and /θ/. The first (m1) and second (m2) spectral moments from a 40 ms interval of frication centered at fricative midpoint were calculated. The first of these distinguishes /s/ from /ʃ/, and also distinguishes between tokens of /s/ that listeners rate as more accurate and those they rate as less accurate (Holliday, Reidy, Edwards, & Beckman, 2015). The second of these distinguishes between /s/ and /θ/ (Jongman, Wayland, & Wong, 2000). The frequency of the second formant of the following vowel at onset (onset F2) was also calculated. This has been shown to differentiate between /s/ and /ʃ/. The duration of the fricatives was also logged, because duration of frication noise has been shown to vary with place of articulation (You, 1979) and to influence perceptual identification judgments (Jongman, 1989). Finally, we logged the intensity ratio between the fricative and the vowel. This was calculated by taking the intensity at fricative midpoint in dB IL and subtracting the intensity at vowel midpoint in dB IL (relative intensity). Because dB is a logarithmic scale, the ratio is calculated as a difference score. The intensity of /θ/ is lower than that of /s/.
The five acoustic measures were used as predictors in two stepwise linear discriminant function analyses (DFA). The first DFA predicted whether the sound was transcribed as [θ] (including [θ:s] productions) or [s] (including [s:θ] productions). The second DFA predicted membership in one of the six transcription categories. In both of these DFAs, three variables significantly improved categorization rates: m1, m2, and relative intensity. Figures 2 and 3 plot the 200 stimuli in these three dimensions. The symbol size in these figures corresponds to the results of the binary categorization study, described in detail below. As these figures show, the sounds varied substantially in the three relevant acoustic dimensions, in a direction predicted by previous research: sounds were more likely to be labeled as /s/ if they had a higher m1, a lower m2, or lower relative intensity (i.e., a more-intense fricative). These figures suggest that the target stimuli are likely to vary widely in terms of how good an example of target /s/ or target /θ/ they are.
Figure 2.
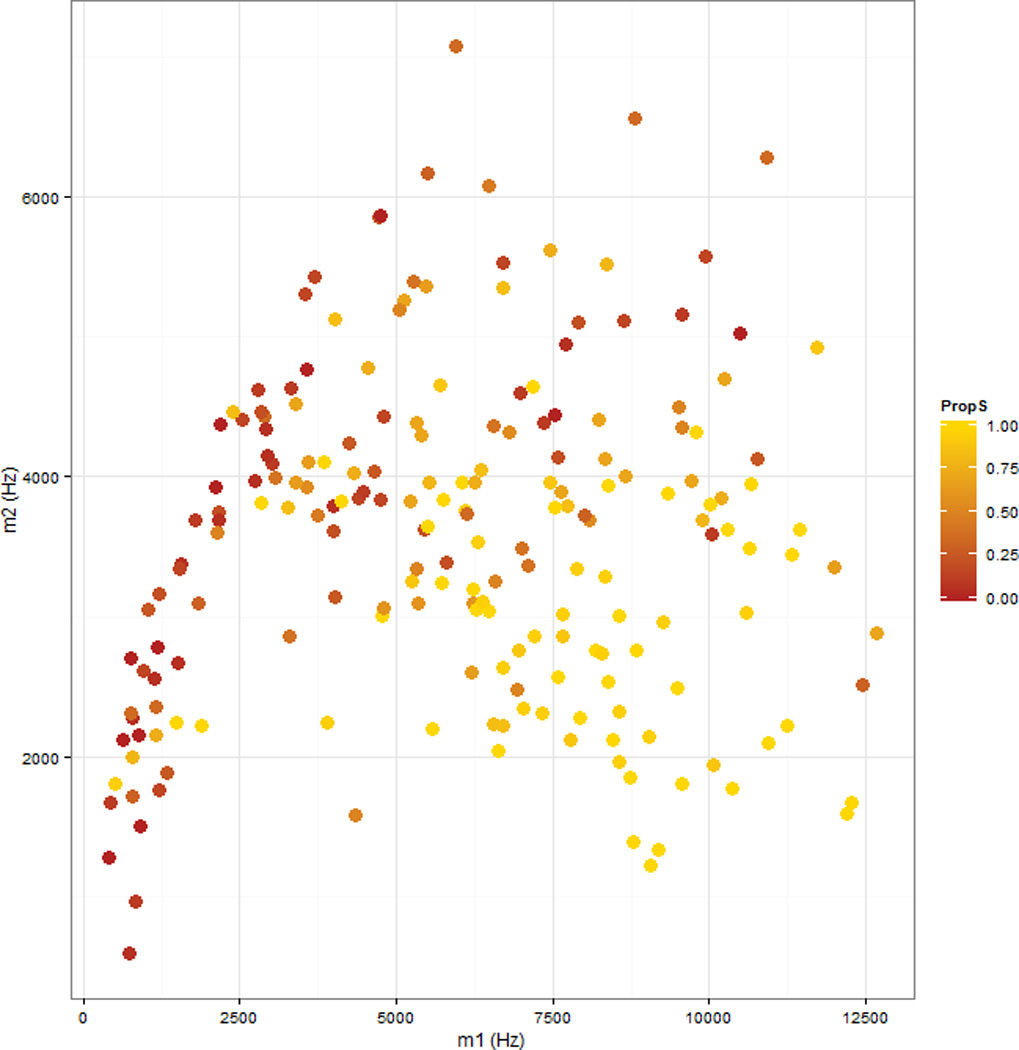
Scatterplot of the relationship between centroid (m1) frequency in Hertz and standard deviation (m2) of frequency in Hertz for a 40 ms interval of frication centered at fricative midpoint for the stimuli used in this study. The shading reflects the proportion of listeners in this study who identified the sound as /s/ in this study.
Figure 3.
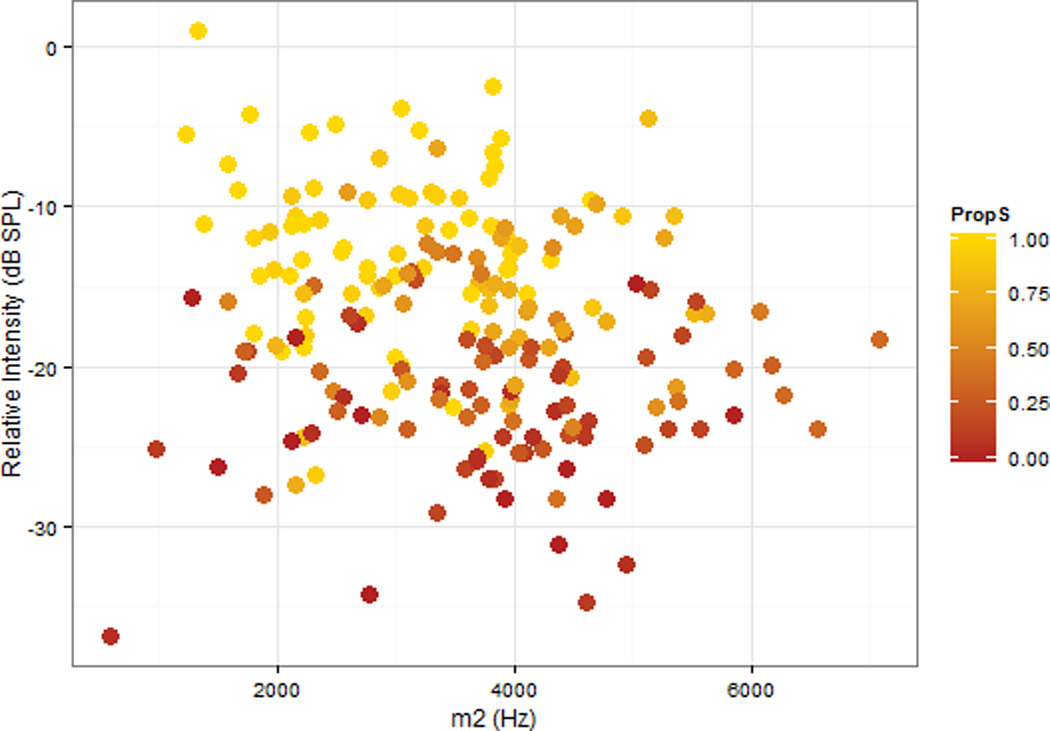
Scatterplot of the relationship between the peak intensity in the fricative and the peak intensity in the following vowel (relInt, dB) and standard deviation (m2) of frequency in Hertz for a 40 ms interval of frication centered at fricative midpoint for the stimuli used in this study. The shading reflects the proportion of listeners in this study who identified the sound as /s/ in this study.
Procedure
Each participant was tested individually in a sound-proof booth, seated in front of a computer monitor. Each of the 200 CV stimuli was played over headphones in random order using E-Prime software (Schneider, Eschmann, & Zuccolotto, 2002). Listeners were informed that they would hear consonant-vowel syllables taken from words that were supposed to start with “s” or “th.” Instructions gave examples of words beginning with /θ/ to cue them that they were to listen for the voiceless variant, and not for /ð/. The listeners were asked to rate the consonant in each CV syllable using a visual analog scale (shown in Figure 4) that was presented on the computer monitor. Listeners were explicitly instructed to click the location along the line that corresponded with the percept of ‘proximity’ to “s” or “th” and were encouraged to use the entire line. To assess intra-rater reliability, 20 items were repeated. The second ratings of these items were used in the analysis of reliability only.
Figure 4.
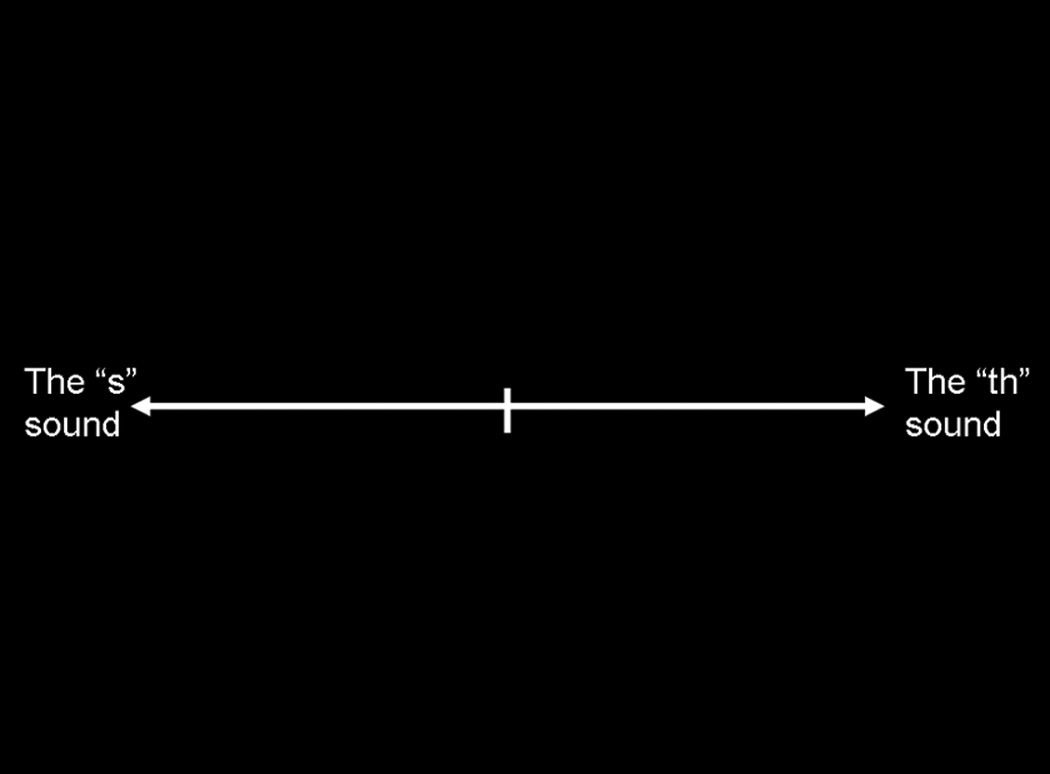
Visual Analog Scale used in the VAS rating task.
Data Analysis
The click location for each stimulus trial was analyzed in terms of the number of pixels along the x-dimension of the visual analog line. The left end of the VAS line (corresponding to “the “s” sound”) was denoted as the zero point and the right end of the VAS line corresponded with 535 pixels. Any clicks that fell off the line in the horizontal dimension were assigned these minimum and maximum values (i.e., clicks left of the line were assigned “0” and clicks right of the line were assigned 535). This comprised 1.4% of the total number of tokens (n=60). All responses were +/− 25 pixels from the line in the y-dimension. The location of the click on the y-dimension was not systematically related to transcription category..
For ease of interpretation, click locations for each trial were then transformed into a metric indicating their location in terms of the proportion of the line. The click location for each trial was divided by the maximum value of 535, resulting in click location values that ranged from zero to one. These were then inverted so that click locations closer to zero correspond with percepts more like “the “th” sound” and click locations closer to one correspond with percepts of more like “the “s” sound”. The inversion was done so that the VAS judgments would be positively correlated with the community judgment scores. A click location of .5 indicates that the listener perceived the sound as exactly between /s/ and /θ/.
Binary Identification Task
Participants
Twenty adult listeners participated in the identification task. All were living in Minneapolis, MN, were native speakers of North American English, and were between the ages of 18 and 42. Participants were recruited by referral or by postings at the University of Minnesota and in the surrounding community. According to self-report, none of the participants had a history of speech, language, or hearing disorders. None of these listeners had also participated in the VAS task. Each participant provided informed consent and was compensated for his or her time.
Stimuli
The same set of CV stimuli described for the VAS task was used in the identification task.
Procedure
Each participant was tested individually in a sound-proof booth, seated in front of a computer monitor, using the same set-up and general instructions described for the VAS task. However, instead of using a VAS line, listeners were asked to listen to the sound and identify whether they heard an “s” or a “th” using buttons on a response box. Response and response time (not analyzed in this paper, raw data available upon request from the authors) were logged. To assess intra-rater reliability, 20 items were repeated. These were the same 20 items used to assess reliability for the VAS experiment. The second ratings of these items were used in the analysis of reliability only.
Analysis
Our first research question concerned the extent to which listeners in the VAS rating task used the entire line when making their ratings, or whether their rating utilized only discrete portions of that line (i.e., if the ratings comprised clicks at the two ends of the line, in which case the VAS ratings would plausibly reflect perception of two categories, /s/ and /θ/). To answer this research question, we first created plots depicting the distributions of individual listeners’ VAS click locations to examine response patterns. This allowed us to determine whether listeners were truly using the line continuously. We then conducted a series of exploratory statistical analyses examining how well individual listeners’ ratings differentiated among the six transcription categories and into how many different component distributions a listener’s ratings could be separated.
To address our second research question we conducted several mixed effects linear regression models to examine whether individual listeners’ VAS judgments for individual tokens would be predicted by community identification judgements (i.e., the proportion of /s/ responses for that token among the 20 listeners in the binary identification task). In this analysis, we used individual listeners’ VAS judgments for each stimulus as the dependent variable and community identification judgments as the predictor variable. In addition, we also included the transcription category for each stimulus in these models to determine whether community identification judgments or transcription category was a better predictor of VAS judgments. Finally, we also conducted a correlational analysis to further examine the relationship between individual listeners’ VAS ratings and community identification judgments.
Results
Individual Listener VAS Response Patterns
Intra-rater reliability was calculated as the intra-class correlation between the first and second rating of the 20 items that were presented twice. These were calculated separately for each of the 20 listeners. These correlations were significant at the α < 0.05 level for 18 of the 21 listeners in this experiment. They were significant at the α <0.10 level for an additional listener, and were not significant for two of the listeners. These are shown in Table 3. The median across the listeners was 0.62. We also used the ICC to examine inter-rater reliability across the 21 listeners. The ICC for the entire set of listeners was 0.467, indicating moderate agreement across listeners. This was highly significantly different from zero, F[199,4000] = 19.4, p < 0.001
Table 3.
Characteristics of Individual Listeners’ VAS ratings.
| Subject ID |
Intra-Rater Reliability (ICC) |
Number of Homogenous Sets |
Number of Underlying Distributions |
Correlation with Community Identification Judgments, all stimuli |
Correlation with Community Identification Judgments intermediate stimuli onlya |
|---|---|---|---|---|---|
| S106 | 0.248 | 3 | 3 | 0.363 ** | 0.145 |
| S108 | 0.535** | 4 | 2 | 0.651 ** | 0.229(*) |
| S158 | 0.514* | 3 | 1 | 0.709 ** | 0.425** |
| S161 | 0.787** | 2 | 4 | 0.709 ** | 0.286* |
| S162 | 0.336(*) | 2 | 8 | 0.633 ** | 0.269* |
| S164 | 0.614** | 4 | 6 | 0.761 ** | 0.455** |
| S165 | 0.430* | 4 | 2 | 0.618 ** | 0.402** |
| S166 | 0.670** | 3 | 3 | 0.698 ** | 0.367** |
| S167 | 0.811** | 4 | 2 | 0.621 ** | 0.204 |
| S168 | 0.604** | 3 | 4 | 0.654 ** | 0.310* |
| S169 | 0.424* | 4 | 3 | 0.582** | 0.390** |
| S170 | 0.763** | 4 | 5 | 0.805 ** | 0.457** |
| S171 | 0.468* | 3 | 3 | 0.721** | 0.329** |
| S172 | 0.751** | 3 | 4 | 0.829** | 0.315* |
| S173 | 0.817** | 3 | 4 | 0.777 ** | 0.243(*) |
| S174 | 0.751** | 4 | 5 | 0.850 ** | 0.620** |
| S175 | 0.545** | 3 | 3 | 0.747 ** | 0.583** |
| S176 | 0.168 | 2 | 6 | 0.431 ** | 0.146 |
| S178 | 0.707** | 3 | 2 | 0.717 ** | 0.310* |
| S179 | 0.655** | 3 | 5 | 0.661 ** | 0.515** |
| S180 | 0.756** | 4 | 4 | 0.774 ** | 0.428** |
| By-item Average |
3 | 3 | 0.930** | 0.714** |
Stimuli that were judged to be a token of /s/ by between 25% and 75% of the listeners in the binary categorization experiment,
p<0.10,
p<0.05,
p<0.01
We next examined the extent to which individuals utilized the entire VAS when making judgments. This included both qualitative and quantitative analyses of the distribution of clicks along the scale. In the first analysis, we visually inspected histograms of click locations along the VAS line for each listener. Listeners varied considerably in the distribution of their responses. Figure 5 displays the responses from one listener, s158, whose responses were relatively evenly distributed across the entire scale. Figure 6 displays the responses of another listener, s170, whose responses covered the entire line, but who had a strong mode at the /s/ end of the line, indicating that a large number of stimuli were perceived to be good tokens of /s/. Visual inspection of the entire set of listeners showed that all of the listeners provided responses across the entire line. That is, no listener in this experiment clicked exclusively on the end-points. There were substantial individual differences in the extent to which responses were biased toward the /s/ end of the scale. Previous studies have found that naïve listeners, like those in this study, have a tendency to label sounds /s/ rather than /θ/ (Munson et al., 2012). This was true in this data set. Responses were coded as either being on the /s/ end of the scale (i.e., between the text “the ‘s’ sound” and the midpoint of the scale) or the /θ/ end. Average across listeners, 66% of the responses were on the /s/ end of the scale. The proportion of individual listeners’ ratings on the /s/ end of the scale ranged from 50% to 98.5% of the scale.
Figure 5.
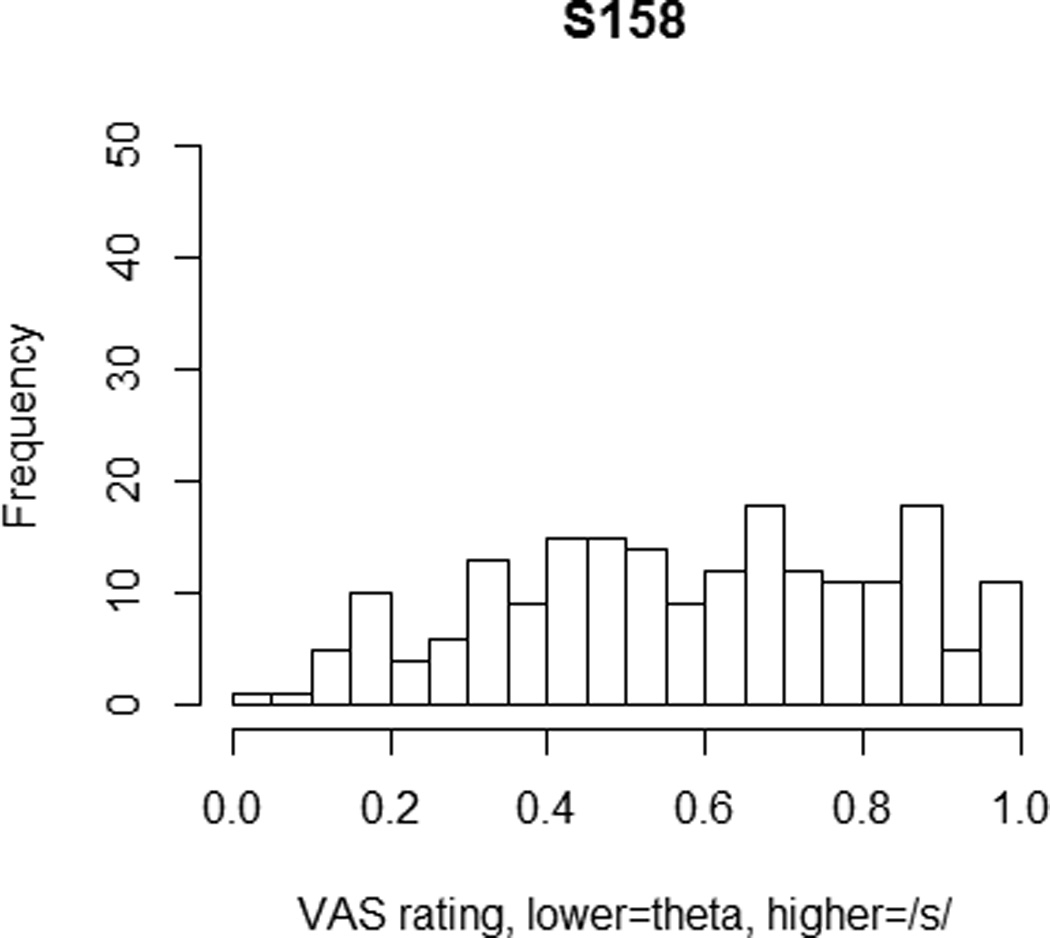
Histogram of VAS responses for participant s158.
Figure 6.
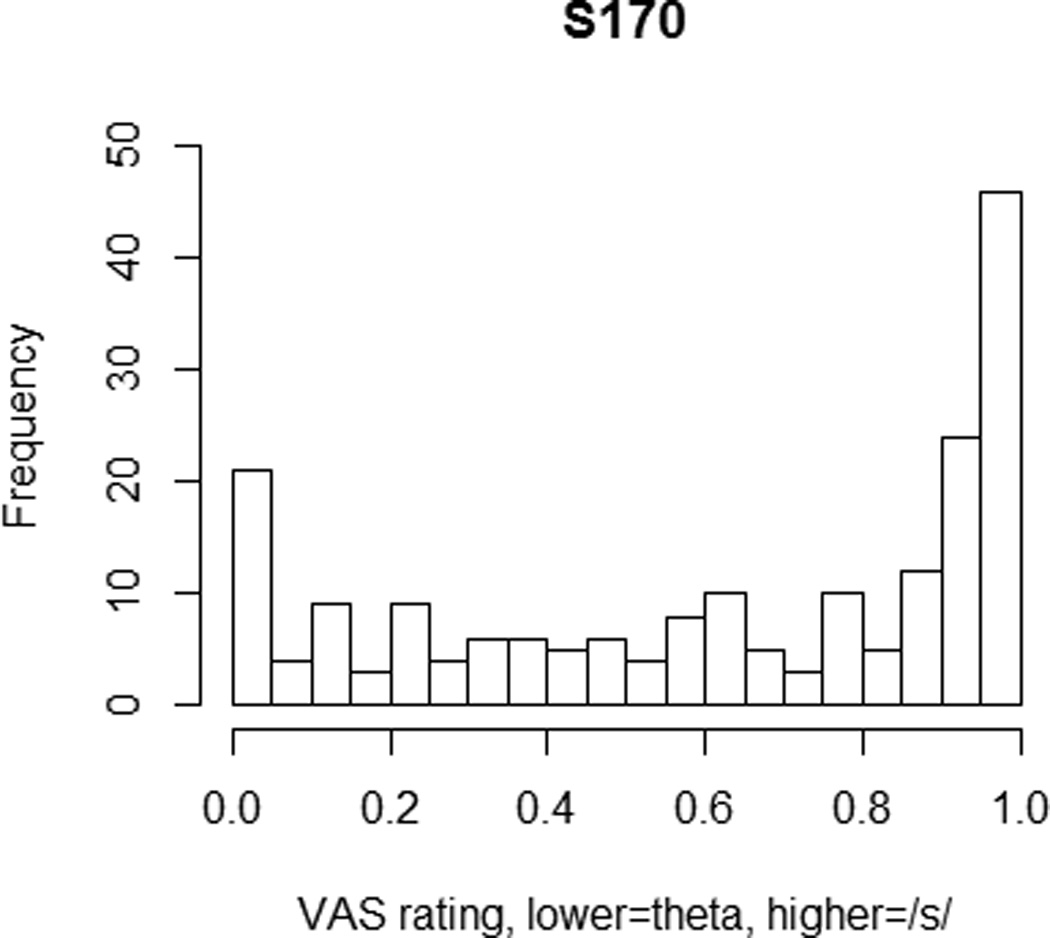
Histogram of VAS responses for participant s170
Two analyses explored individual differences in click distributions quantitatively. The first of these examined the extent to which individual listeners’ ratings differentiated among the six transcription categories described earlier: [s] for /s/, [s] for /θ/, [s:θ], [θ:s], [θ] for /s/, and [θ] for /θ/. To examine this, we conducted a series of one-way ANOVAs predicting VAS rating from transcription category. Post-hoc Scheffe tests were used to determine the number of homogeneous subsets in the data. Homogenous subsets are clusters of levels of a categorical independent variable which do not differ from one another, but which do differ from variables in other subsets. For example, one hypothetical listener might have a homogeneous subset of ratings for [s] for /s/, [s] for /θ/, and [s:θ], and another homogenous subset for the ratings of [θ:s], [θ] for /s/, and [θ] for /θ/.
The number of homogenous subsets for each participant’s ratings is shown in Table 3. As this table shows, the number of homogeneous subsets was either 2 (3/21 listeners), 3 (11/21 listeners) or 4 (7/21). The specific subsets that were generated for each listener differed; however, no listener had a homogeneous subset comprising two non-adjacent transcription categories in the order [s] for /s/ > [s] for /θ/ > [s:θ] > [θ:s] > [θ] for /s/ > [θ] for /θ/. Put differently, for only 3 of the 21 listeners were the ratings statistically equivalent to a two-category system, and for a third of the listeners the ratings were equivalent to a system with four categories. Figures 7 and 8 show probability-density distributions for the listeners whose histograms are plotted in Figures 5 and 6. Listener s158 had three homogeneous subsets, corresponding to the following groupings: [s] for /s/ and [s] for /θ/ (labeled ‘s’ in Figure 7), [s:θ] and [θ:s] (labeled ‘intermediate’ in Figure 7), and [θ] for /s/ and [θ] for /θ/ (labeled ‘theta’ in Figure 7). Listener s170 had four homogeneous subsets, corresponding to the following groupings: [s] for /s/ and [s] for /θ/ (labeled ‘s’ in Figure 8), [s:θ] (labeled ‘intermediate_s’ in Figure 8), [θ:s] and [θ] for /s/ (labeled ‘intermediate_theta’ in Figure 8), and [θ] for /θ/ (labeled ‘theta’ in Figure 8). Table 3 also shows the number of homogeneous subsets for an analysis of the by-item average VAS ratings across the listeners. This shows that average ratings could be differentiated into three homogeneous subsets: one for ratings of /s/ for [s] and [s] for /θ/, one for [s:θ] and [θ:s] , and one for [θ] for /s/ and [θ] for /θ/. That is, the average ratings differentiated among three transcription categories.
Figure 7.
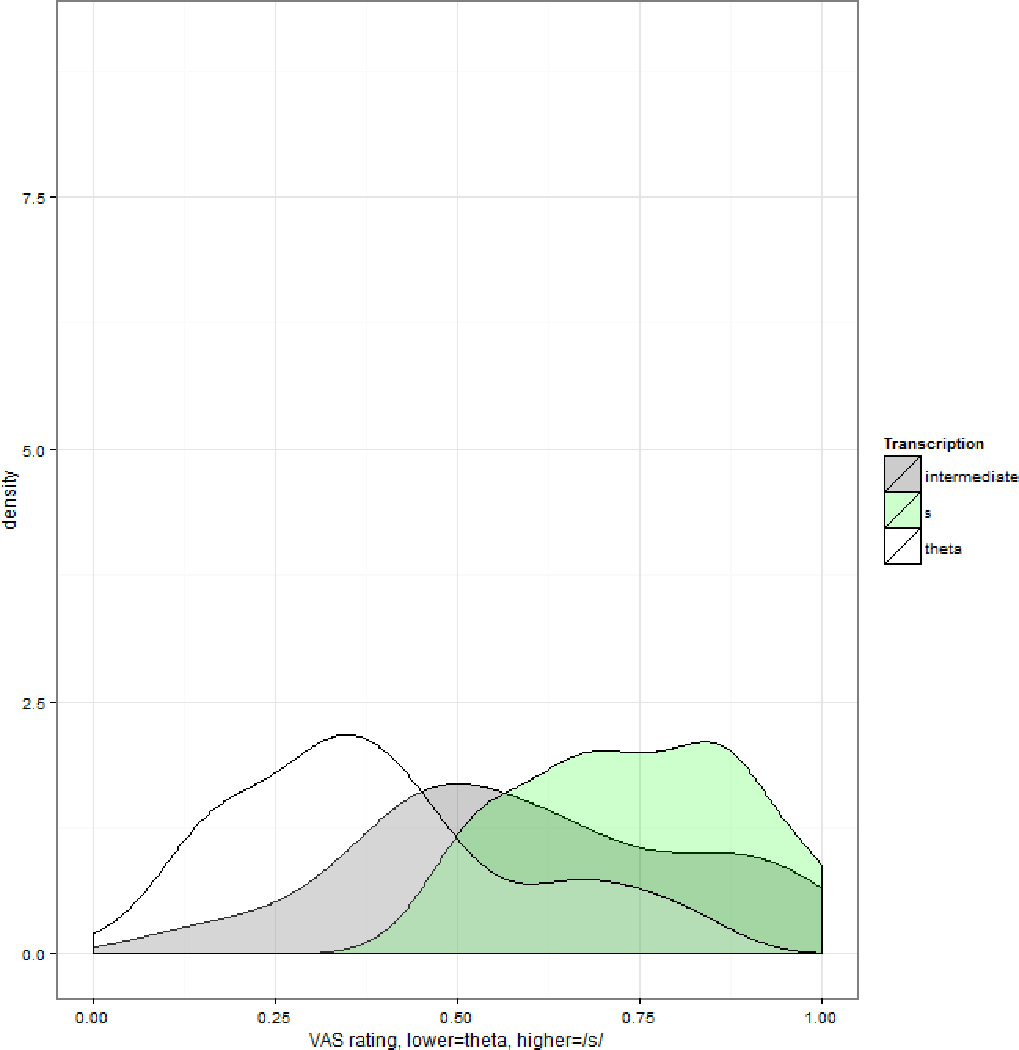
Probability density distribution of VAS responses for participant s158 separated by that participant’s homogeneous subsets of ratings.
Figure 8.
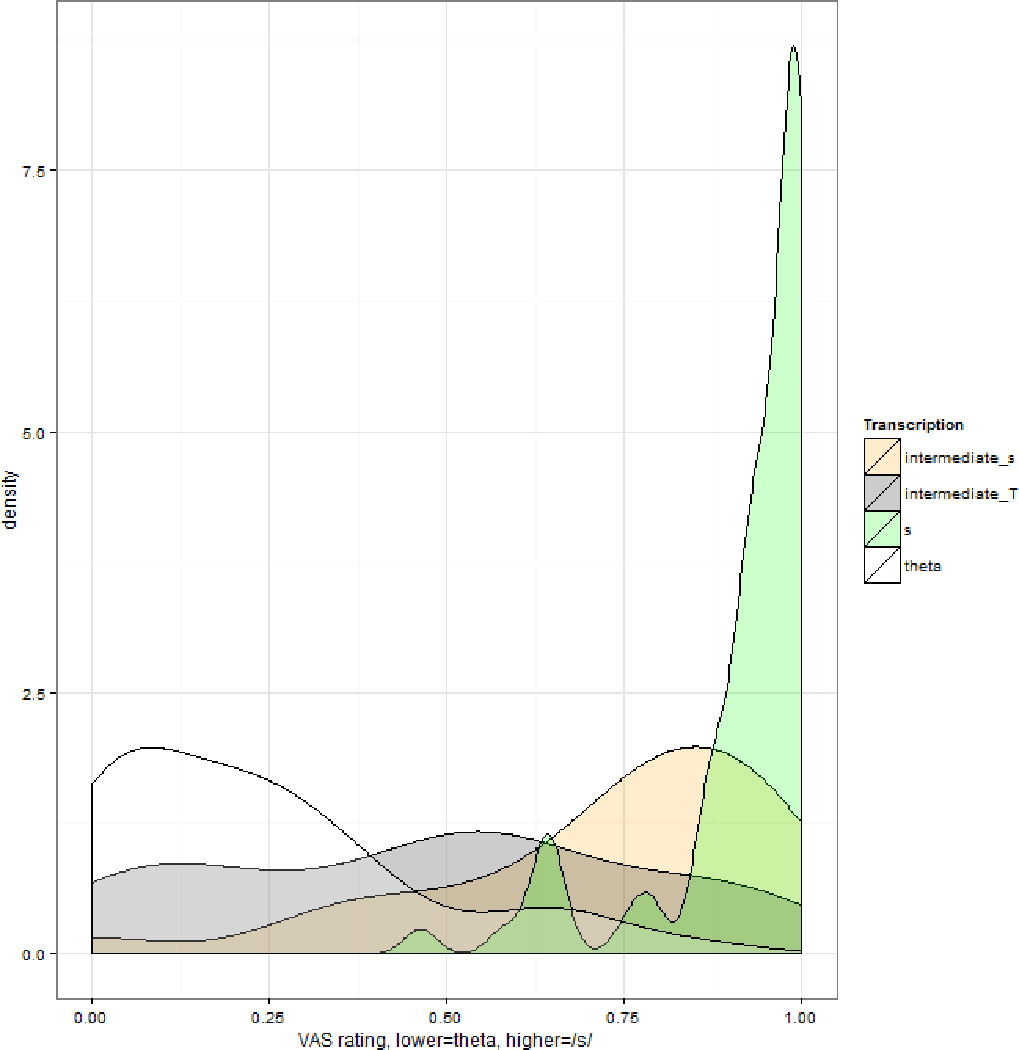
Probability density distribution of VAS responses for participant s170 separated by that participant’s homogeneous subsets of ratings.
The second analysis used mixture models, which are a class of analyses that decompose distributions into component distributions. The mixture models utilized in this analysis was the densitymclust function from the R package mclust (Fraley & Referty, 2002). This analysis decomposed the distributions of VAS clicks, like those shown in Figures 5 and 6, into Gaussian distributions with different means and variances. This was done based solely on the shape of the distribution of clicks, and not in reference to any of the characteristics of the stimuli. The densitymclust algorithm also reports the proportion of total stimuli that were placed into each component distribution. The algorithm uses an optimization procedure to determine the number of underlying distributions comprising a target distribution. Our analysis specified the maximum number of distributions to be 8, as the densitymclust algorithm is somewhat anticonservative, and we wanted to restrict the number of underlying distributions. The number of distributions for each listener is shown in Table 3. As this Table shows, the number of component distributions ranged from 1 to 8 (i.e., from the minimum to the maximum number of component distributions), with a median of 4 and only one individual having the maximum of 8 distributions. That is, on average, the listeners provided four different sets of ratings. Moreover, 16 of the 21 listeners’ ratings could be decomposed into more than two distributions. That is, the mixture modeling suggested that the majority of listeners were providing ratings that reflected more than two underlying categories. For illustration, consider the listeners whose ratings are shown in Figures 5 and 6. Listener s158’s ratings were estimated to reflect a single underlying distribution with a mean of 0.58 (variance=0.06). Listener 170’s ratings were estimated to reflect five underlying distributions with means of 0.02 (variance=0.003, 11% of all of the ratings), 0.23 (variance=0.01, comprising 20% of all of the ratings), 0.54 (variance=0.02, 30% of all ratings), 0.92 (variance=0.001, 21% of all of the ratings), and 0.99 (variance=0.0002, 18% of all ratings). Table 3 shows the density distributions for the by-item average VAS ratings. The probability-density distribution for the average ratings could be decomposed into three categories.
In sum, the analyses in this section show that the listeners provided ratings that sampled the entire scale. For most listeners, these ratings distinguished among more than two of the transcription categories that were used to select the stimuli. Moreover, many of the listeners’ ratings could be decomposed into more than two underlying distributions. These two analyses complemented one another: a listener who had a single underlying distribution (participant s158, shown in Figure 5) nonetheless provided different ratings that differentiated more than two categories. These analyses suggest that VAS ratings are more informative than a simple two-category system, as would be used if stimuli were assigned the phonetic symbol [s] or [θ].
Predictors of Individual Listeners’ VAS ratings
The final set of analyses used linear mixed-effects modeling to examine the extent to which individual listeners’ VAS ratings for individual stimuli could be predicted by a continuous measure of phonetic variation, the community identification judgments, that is, the proportion of /s/ judgments for those stimuli made by listeners in the binary identification task. The reliability of the binary judgments for the 20 listeners was calculated as the φ correlation between the first rating and the second rating, with /s/ judgments coded as 1 and /θ/ judgments as 0. The median φ was 0.70. Four of the listeners’ φ correlations were not statistically significant. These were listeners who made relatively few /θ/ judgments in the first part of the experiment, and whose ratings therefore reflected stable perception of /s/ but changing perception of /θ/ over the course of the experiment.
A histogram of the community identification judgments is shown in Figure 9. As this figure shows, the strongest modes were at 0 and 1, i.e., sounds that were uniformly perceived as /s/ or /θ/. These comprised approximately 40% of the responses. However, the remaining approximately 60% of the responses were not perceived uniformly to be /s/ or /θ/. These were distributed relatively evenly. This suggests that the proportion of /s/ responses from the binary identification task is a suitable measure of continuous variation between /s/ and /θ/. A logit mixed-effects regression analysis showed that the likelihood of a sound being labeled as /s/ or /θ/ differed systematically as a function of transcription category. In this analysis, the binary identification was the dependent measure, while transcription category was the fixed effect. There was also a random intercept for subjects (to account for individual differences in the overall tendency to label a sound as /s/ or /θ/), and a random slope for the effect of transcription type on subjects (to account for individual differences in the effect of transcription category on labeling patterns). Moreover, the shading of the symbols in Figures 2 and 3 shows that this variation was in the predicted direction given the acoustic characteristics of the stimuli.
Figure 9.
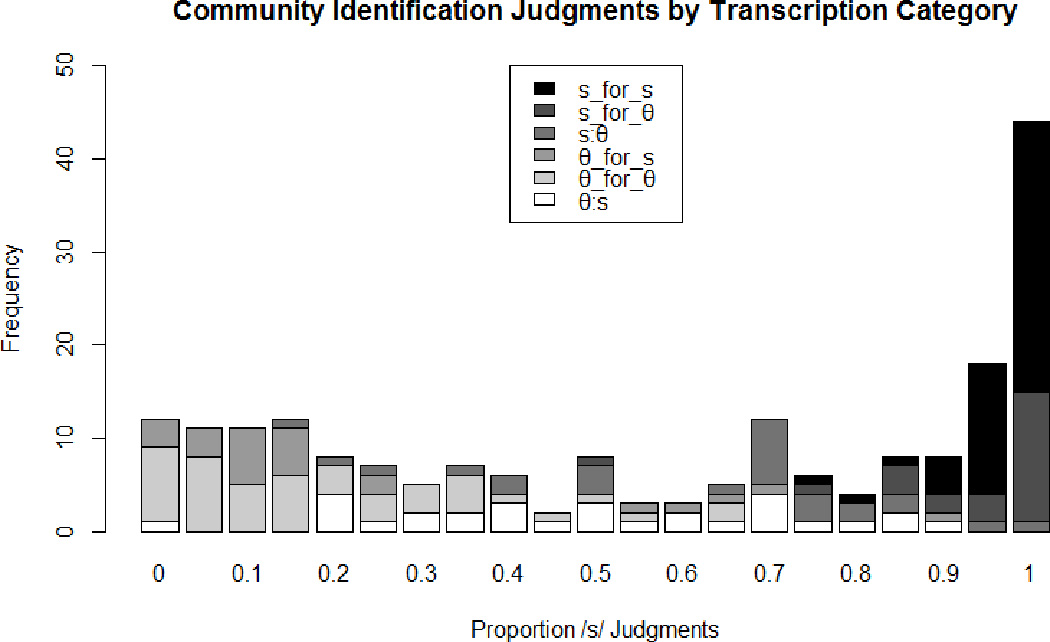
Community identification scores separated by transcription type.
A series of linear mixed-effect models was built. The dependent measure was individual listeners’ VAS ratings. The package lme4 (Bates, Mächler, Bolker, & Walker, 2014) in the R statistical environment was used. To assess statistical significance of effects within models, the lmerTest package was used (Kuznetskova, Brockhoff, & Christensen, 2015). To assess the significance of a factor in a model, we assessed whether the model with the factor had a better fit than a model without that factor. Following the suggestion of Barr, Levy, Scheepers, and Tily (2013), we included all logically possible random slopes for each new fixed effect that we added. Given the nature of our analyses, these were always random slopes for subjects and not for items (i.e., there cannot be a random effect of transcription on items, as each item has only one transcription).
The first set of models examined whether the community identification judgments predicted VAS judgments beyond what could be predicted by a variable coding whether the sound was transcribed as /s/ (collapsing the categories [s] for /s/, [s] for /θ/ and [s:θ]) or /θ/ (collapsing the categories [θ:s], [θ] for /s/, and [θ] for /θ/). This variable was dummy-coded with contrast coding. The simplest model (i.e., the base model) had only a random intercept for listeners and items. Next, a model was constructed that added a fixed effect for the transcription, and a random slope for the effect of transcription on listeners. This model had a significantly better fit than the base model (χ2[df=2]= 332.78, p<0.001). The next model had an additional fixed effect of community identification judgments (z-transformed), and an additional random effect of the influence of community identification judgments on individual listeners’ ratings. The fit of this model was significantly better than that of the previous model (χ2[df=2]= 348.81, p<0.001). In this most-complex model, the coefficient for the effect of community identification judgments on VAS ratings was significant (β=0.199, SEM=0.0167 t=11.923, p<0.001); however, the coefficient for the effect of transcribed consonant was not (β=0.027, SEM=0.020 t=1.396, p=0.164). That is, the VAS ratings were significantly better predicted by the fine-grained variation in this set of children’s /s/ and /θ/ productions that were reflected in the proportion of /s/ judgments than they were predicted whether the sound was transcribed as /s/ or /θ/. Indeed, there was so strong a relationship between VAS ratings and community identification judgments that the effect of whether the sound was transcribed as /s/ or /θ/ was not significant in the model.
The conclusion that VAS judgments were a better measure than a two-category transcription system is perhaps not surprising, given the small degrees of freedom in the transcription system (in which a sound can be only one of two values) versus the VAS system (in which the number of values is limited only by the system used to collect responses). A more rigorous test of the utility of VAS in tracking continuous variation is to examine whether the community identification judgments predict VAS beyond what is predicted a categorical variable representing the six transcription types that characterize these stimuli. The second set of linear mixed-effects models examined this. The same base model described above was used. The next model added a fixed effect for the six-category transcription type, and a random slope for the effect of transcription type on listeners. This model fit the data significantly better than the base model (χ2[df=26]= 552.25, p<0.001). The next model had an additional fixed effect of community identification judgments (z-transformed), and an additional random effect of the influence of community identification judgments on individual listeners’ VAS ratings. This model did not converge. However, a model without the random intercept for items did converge. That model had a significantly better fit than the simpler model without the community identification judgments (χ2[df=1]= 45.942, p<0.001). The model with community identification judgments but without the random intercept for items had a significantly better model fit than did a simpler model without community identification judgments and without a random intercept for items (χ2[df=2]= 707.54, p<0.001). There was also an effect of transcription type in the full model, albeit a weaker effect than in the simpler model without community identification judgments in it. The t-values associated with the β coefficients for the five transcription types [excluding the reference level] in the full model ranged from 3.27 to 5.54; those in the model without the community consensus judgments ranged from 5.37 to 47.3 Together, these findings suggest that the community identification judgments predict individual VAS judgments beyond what was predicted by a six-category transcription system.
The final analysis examined correlations between individual listeners’ VAS ratings and the community identification judgments (i.e., the proportion of /s/ judgments). The results of the correlational analysis are displayed in Table 3. The first set of correlations was for the entire 200 stimuli. The correlation coefficient (r) for the relationship between VAS click location and the community identification judgment for a given CV stimulus is shown for each of the 21 listeners in the VAS task. As shown in the table, the correlation coefficient for all of our 21 listeners was significant (p<.001). This means that for all listeners, individual click locations were significantly related to the proportion of trials for which the stimulus was labeled an “s” in the binary identification task. The correlation indicates that as the community identification judgments increased (i.e., the CV stimulus was judged to be an “s” a greater proportion of trials), the individual VAS click location was closer to the /s/ end of the line. This magnitude of this correlation was also strong overall; the correlation coefficient for 19 of our 21 listeners was greater than 0.5, a level characterized as a large effect size based on Cohen’s (1992) classification. This correlation was especially strong when examining the by-item averages across the listeners.
The strong correlations described in the previous paragraph might be driven largely by the relatively high number of stimuli that were consistently judged in the binary-identification experiment as /s/ or /θ/. To examine whether these strong correlations held when only intermediate stimuli were examined, we did a second analysis including only stimuli whose community identification judgments was between 25% and 75%, i.e., only the stimuli that were neither clearly /s/ nor clearly /θ/. This was a set of 64 stimuli, i.e., approximately 1/3 of the total set. These correlations are shown in Table 3. Not surprisingly, these correlations were weaker than those for the entire set of stimuli. Three of the correlations were not significant, one was significant at the α < 0.10 level, five at the α < 0.05 level, and 12 at the α < 0.01 level. That is, for most listeners, there is still a statistically significant correlation between VAS ratings and the proportion of /s/ judgments when only a small subset of very intermediate stimuli is examined.
Discussion
The purpose of this study was to investigate whether visual analog scaling may be a useful and valid clinical tool to characterize fine phonetic detail in the speech of young children. Our underlying assumption was that use of a continuous measurement tool such as VAS should enable listeners to provide a more nuanced description of the fine phonetic characteristics of children’s speech than would be possible with a discrete measure, such as an identification task. Previous work found support for this assumption by showing that VAS ratings of productions of /s/ and /ʃ/, averaged across a group of listeners, strongly correlated with the acoustic parameter of centroid frequency (Julien & Munson, 2012; Munson, Johnson, & Edwards, 2012). However, based on their analysis, we cannot infer anything about the responses of individual listeners. Understanding the response patterns of individual listeners is critical given that in practice, it is generally a single listener (i.e., the treating clinician) who provides perceptual judgments about a child’s speech.
As a result, our initial analyses focused on investigating responses from listeners individually. We first aimed to determine whether listeners would actually use the VAS line in a continuous manner. Although the line offers listeners the opportunity to make subtle distinctions between speech sound productions, we could not ignore the possibility that listeners would instead only use a few points on the line to characterize all the productions. For example, if a listener only used the endpoints of the line, the task would be essentially identical to the binary-choice identification task. However, as the density plots and mixture models demonstrated, these listeners did treat the VAS line in a relatively continuous manner. Although some listeners tended to use certain regions of the line more than others, none of the listeners only used one or two discrete points along the line. This suggests that not only were the listeners able to hear subtle acoustic-phonetic differences between stimuli, but they were also able to use the VAS line to provide detailed information about their perceptions.
Our next question was to determine the concurrent validity of VAS judgments by examining the relationship between individual listeners’ VAS judgments and community identification scores, i.e., group-averaged judgments made using a binary-choice sound identification task. As anticipated, a significant, and in most cases strong, correlation between these two measures was found for all of the listeners in the VAS rating task. Furthermore, community identification scores were stronger predictors of individual listeners’ VAS ratings than either the two-category or the six-category transcription systems. This finding is particularly important because community identification scores can be considered a measure of how the general public would perceive the child’s speech. That VAS was so strongly correlated with this suggests that a single individual’s VAS judgment might serve as a good proxy for an aggregate measure of how members of a child’s speech community would perceive his or her speech.
The benefit of a VAS task, however, is that only a single listener is needed to obtain information on the fine phonetic detail of individual productions. For a binary-choice identification task between two contrasting phonemes, the only way to identify whether a production is intermediate between the two sounds (or doesn’t quite sound like a prototypical, adult-like production) is to ask many listeners to identify it and then calculate the community identification score. A score close to .5 might indicate that the production is somewhere in between the two sounds. For obvious reasons, this type of procedure would be impractical for use in clinical practice.
Similarly, although phonetic transcription, especially when “intermediate” categories or diacritics are utilized, can provide some information on fine phonetic detail, it is at a rather broad level. VAS, on the other hand, provides a means to quantify the degree to which a given token approximates correct production. One important benefit of this quantification is that it may allow for more precise monitoring of subtle changes over time. For example, imagine a child participating in treatment program targeting fronted /s/ productions. If the clinician uses transcription to monitor change, there are only a limited number of categories with which to measure the child’s progress. She or he may begin with a production transcribed as /θ/, then to something that sounds intermediate between /s/ and /θ/, and finally to /s/ at the culmination of treatment. Thus it appears that there is a discrete trajectory of change, wherein the child progresses through three separate stages. It may also be the case that the child appears to plateau at a given stage if progress is slow. This may make it difficult to justify the continuation of treatment if no further improvement can be documented. While some children certainly may progress in discrete stages, others, especially those exhibiting covert contrast, demonstrate a more gradual trajectory. VAS allows a means to monitor this gradual change and demonstrate the benefit of treatment, even if the child would have appeared to have plateaued using transcription alone. One challenge to this recommendation is that there is a weaker (though generally still statistically significant) correlation between individual VAS ratings and community consensus judgments for intermediate sounds than for sounds that were generally perceived as /s/ or /θ/. This is hardly unexpected, given the fact that intermediate sounds are atypical and hence less frequently encountered by average listeners. Future research should consider the types of training that would be needed to improve the perception of intermediate sounds.
For these reasons, we conclude that use of VAS in the assessment of children’s speech has a number of important benefits over the sole reliance on more conventional measures, such as identification judgments. Nevertheless, there are several limitations to our study that must be addressed. First, we analyzed VAS responses for a single speech sound contrast: /s/ versus /θ/. Listeners might be especially likely to attend to fine phonetic detail in this contrast, as it is the locus of a great deal of social meaning related to gender and sexual orientation (i.e., Mack & Munson, 2012; Munson, McDonald, DeBoe, & White, 2006). As a result, it is not clear whether the same results would hold for other speech sound contrasts, especially those involving other manners of articulation. Stop consonants, for example, tend to be perceived more categorically than fricatives (e.g., Mann and Repp, 1980). As a result, listeners may be less able to perceive subphonemic detail in stop place of articulation, and might consequently use a VAS line in a less continuous manner. We are currently examining this possibility. Recent findings by Munson et al. (2012) and by Cline, Johnson, Beckman, Edwards, and Munson (2015) suggest that fine detail in stop place of articulation can also be perceived and denoted using VAS, insomuch as VAS ratings can distinguish among six transcription categories, analogous to those in this experiment (i.e., [t] for /t/, [t] for /k/, [t:k], [k:t], [k] for /t/, and /k/ for /k/).
Another important limitation is that the data in this study were obtained from naïve listeners only. Given that our ultimate goal in this line of research is to determine the utility, validity, and feasibility of VAS in clinical practice, it is critical to determine whether Speech Language Pathologists use the VAS line in a similar way as less trained and experienced listeners. We are currently involved in an additional research project addressing this question. Another related limitation relates to the proposed utility of visual analog scaling in measuring change over time. While it seems intuitive that VAS might be sensitive to subtle changes in articulatory-phonetic precision, we are not aware of any studies that demonstrate use of VAS in a longitudinal context. To be a valid measure of change over time, clinicians must be able to judge productions with a high degree of reliability. Furthermore, their ratings must be impervious to the bias resulting from the expectation of improvement. For example, Locke and Bookshester (1973) demonstrated that listeners’ judgments on a phonetic identification task were biased simply by the expectation that a child would improve over time. At this point, there is no research to indicate whether clinicians’ VAS judgments would be any more or less susceptible to this type of bias. A related area of ongoing research on this topic is to examine whether VAS ratings are subject to the same biases as phonetic transcription. As described by Kent (1994), Ladd (2011), and others, phonetic transcriptions are subject to myriad biases. For example, listeners are more likely to report an intermediate sound as correct after hearing it multiple times than after hearing it once (Munson & Brinkman, 2004). One possibility is that VAS ratings are subject to the same biases. If, however, VAS ratings were less susceptible to these biases, they might have an additional utility beyond those documented in this study.
These weaknesses aside, we believe that the results of this paper contribute to the growing literature showing that continuous ratings of children’s speech have great potential in providing a clearer picture of speech-sound development, and that our understanding of development will be improved if they are incorporated into studies of children’s language.
Acknowledgments
This research was supported by NIH grant DC02932 to Jan Edwards and Mary E. Beckman, NSF grant BCS-0729140 to Jan Edwards, and NSF grant BCS-0729277 to Benjamin Munson. The authors thank Mary E. Beckman and Kari Urberg Carlson for the useful suggestions on this work. The first author’s current affiliation is Department of Communication Sciences and Disorders, St. Xavier University, Chicago, IL. The third author’s current affiliation is the Department of Hearing and Speech Sciences, University of Maryland, College Park.
Footnotes
The authors have no conflicts of interest.
Contributor Information
Sarah K. Schellinger, Department of Speech-Language-Hearing Sciences, University of Minnesota, Twin Cities
Benjamin Munson, Department of Speech-Language-Hearing Sciences, University of Minnesota, Twin Cities.
Jan Edwards, Department of Communication Disorders and Sciences, University of Wisconsin, Madison.
References
- Barr D, Levy R, Scheepers C, Tily H. Random effects structure for confirmatory hypothesis testing: Keep it maximal. Journal of Memory and Language. 2013;68:255–278. doi: 10.1016/j.jml.2012.11.001. [DOI] [PMC free article] [PubMed] [Google Scholar]
- Bates D, Maechler M, Bolker B, Walker S. lme4: Linear mixed-effects models using Eigen and S4. 2014 R package version 1.1–7, http://CRAN.R-project.org/package=lme4.
- Baum SR, McNutt JC. An acoustic analysis of frontal misarticulation on /s/ in children. Journal of Phonetics. 1990;18:51–63. [Google Scholar]
- Bijur PE, Silver W, Gallagher EJ. Reliability of the visual analog scale for measurement of acute pain. Academic Emergency Medicine. 2001;8:1153–1157. doi: 10.1111/j.1553-2712.2001.tb01132.x. [DOI] [PubMed] [Google Scholar]
- Carney A, Widin G, Viemeister NF. Noncategorical perception of stop consonants differing in VOT. The Journal of the Acoustical Society of America. 1977;62:961–970. doi: 10.1121/1.381590. [DOI] [PubMed] [Google Scholar]
- Clark H. The language-as-fixed-effect fallacy: A critique of language statistics in psychological research. Journal of Verbal Learning and Verbal Behaviour. 1973;12:335–359. [Google Scholar]
- Cline S, Johnson A, Beckman ME, Edwards J, Munson B. Child-Level Factors & Acquisition of the /t/-/k/ Contrast: Perception; Denver, CO. Poster presentation at the American Speech-Language-Hearing Association.2015. Nov 12, [Google Scholar]
- Cohen J. A power primer. Psychological Bulletin. 1992;112:155–159. doi: 10.1037//0033-2909.112.1.155. [DOI] [PubMed] [Google Scholar]
- Edwards J, Beckman ME. Methodological questions in studying phonological acquisition. Clinical Linguistics and Phonetics. 2008;22:937–956. doi: 10.1080/02699200802330223. [DOI] [PMC free article] [PubMed] [Google Scholar]
- Forrest K, Weismer G, Elbert M, Dinnsen DA. Spectral analysis of target-appropriate /t/ and /k/ produced by phonologically disordered and normally articulating children. Clinical Linguistics & Phonetics. 1994;8:267–281. doi: 10.3109/02699209408985312. [DOI] [PubMed] [Google Scholar]
- Forrest K, Weismer G, Hodge M, Dinnsen DA, Elbert M. Statistical analysis of word-initial /k/ and /t/ produced by normal and phonologically disordered children. Clinical Linguistics & Phonetics. 1990;4:327–340. [Google Scholar]
- Fraley C, Raftery AE. Model-based clustering, discriminant analysis, and density estimation. Journal of the American Statistical Association. 2002;97:611–631. [Google Scholar]
- Fudala JB, Reynolds WM. Arizona Articulation Proficiency Scale. Second. Los Angeles: Western Psychological Services; 1986. [Google Scholar]
- Gallagher EJ, Liebman M, Bijur PE. Prospective validation of clinically important changes in pain severity measured on a visual analog scale. Annals of Emergency Medicine. 2001;38:633–638. doi: 10.1067/mem.2001.118863. [DOI] [PubMed] [Google Scholar]
- Gierut J, Dinnsen DA. On word-initial voicing: converging sources of evidence in phonologically disordered speech. Language and Speech. 1986;29:29–114. doi: 10.1177/002383098602900201. [DOI] [PubMed] [Google Scholar]
- Hewlett N. Acoustic properties of /k/ and /t/ in normal and phonologically disordered speech. Clinical Linguistics and Phonetics. 1988;2:29–45. [Google Scholar]
- Holliday J, Reidy P, Beckman M, Edwards J. Quantifying the robustness of the English sibilant fricative contrast in children. Journal of Speech, Language, and Hearing Research. 2015 doi: 10.1044/2015_JSLHR-S-14-0090. [DOI] [PMC free article] [PubMed] [Google Scholar]
- Jongman A, Wayland R, Wong S. Acoustic characteristics of English fricatives. Journal of the Acoustical Society of America. 2000;108:1252–1263. doi: 10.1121/1.1288413. [DOI] [PubMed] [Google Scholar]
- Jongman A. Duration of fricative noise required for identification of English fricatives. Journal of the Acoustical Society of America. 1989;85:1718–1725. doi: 10.1121/1.397961. [DOI] [PubMed] [Google Scholar]
- Julien H, Munson B. Modifying Speech to Children based on their Perceived Phonetic Accuracy. Journal of Speech, Language, and Hearing Research. 2012;55:1836–1849. doi: 10.1044/1092-4388(2012/11-0131). [DOI] [PMC free article] [PubMed] [Google Scholar]
- Keating P, Mikos M, Ganong W. A cross-language study of range of voice onset time in the perception of initial stop voicing. Journal of the Acoustical Society of America. 1981;70:1261–1271. [Google Scholar]
- Kent RD. Hearing and believing: some limits to the auditory-perceptual assessment of speech and voice disorders. American Journal of Speech-Language Pathology. 1996;5:7–23. [Google Scholar]
- Kempster GB, Gerratt BR, Verdolini Abbott K, Barkmeier-Kraemer J, Hillman RE. Consensus auditory-perceptual evaluation of voice: Development of a standardized clinical protocol. American Journal of Speech-Language Pathology. 2009;18:124–132. doi: 10.1044/1058-0360(2008/08-0017). [DOI] [PubMed] [Google Scholar]
- Kuznetsova A, Brockhoff P, Christensen R. lmerTest: Tests for random and fixed effects for linear mixed effect models (lmer objects of lme4 package) 2013 R package version 2.0-0. http://CRAN.R-project.org/package=lmerTes.
- Ladd DR. Phonetics in phonology. In: Goldsmith J, Riggle J, Yu A, editors. Handbook of Phonological Theory. 2nd. New York: Blackwell; 2011. pp. 348–373. [Google Scholar]
- Li F, Edwards J, Beckman ME. Contrast and covert contrast: The phonetic development of voiceless sibilant fricatives in English and Japanese toddlers. Journal of Phonetics. 2009;37:111–124. doi: 10.1016/j.wocn.2008.10.001. [DOI] [PMC free article] [PubMed] [Google Scholar]
- Li F, Munson B, Edwards J, Yoneyama K, Hall KC. Language specificity in the perception of voiceless sibilant fricatives in Japanese and English: Implications for cross-language differences in speech-sound development. Journal of the Acoustical Society of America. 2011;129:999–1011. doi: 10.1121/1.3518716. [DOI] [PMC free article] [PubMed] [Google Scholar]
- Locke JL, Bookshester J. Children’s phonetic learning in the laboratory: Judgmental or real? Journal of Speech and Hearing Research. 1973;16:667–670. doi: 10.1044/jshr.1604.667. [DOI] [PubMed] [Google Scholar]
- Mack S, Munson B. The association between /s/ quality and perceived sexual orientation of men’s voices: implicit and explicit measures. Journal of Phonetics. 2012;40:198–212. [Google Scholar]
- Macken M, Barton D. The acquisition of the voicing contrast in English: a study of voice onset time in word-initial stop consonants. Journal of Child Language. 1980;7:41–74. doi: 10.1017/s0305000900007029. [DOI] [PubMed] [Google Scholar]
- Mann V, Repp B. Influence of vocalic context on perception of the [ʃ]-[s] distinction. Perception and Psychophysics. 1980;28:213–228. doi: 10.3758/bf03204377. [DOI] [PubMed] [Google Scholar]
- McAllister Byun T, Halpin P, Harel D. Proceedings of the 18th International Congress of Phonetic Sciences. Glasgow, UK: the University of Glasgow; 2015. [on March 17, 2016]. Crowdsourcing for gradient ratings of child speech: Comparing three methods of response aggregation. In The Scottish Consortium for ICPhS 2015 (Ed.) ISBN 978-0-85261-941-4 Paper retrieved from https://www.internationalphoneticassociation.org/icphs-proceedings/ICPhS2015/Papers/ICPHS0935.pdf. [Google Scholar]
- McAllister Byun T, Halpin PF, Szeredi D. Online crowdsourcing for efficient rating of speech: A validation study. Journal of Communication Disorders. 2015;53:70–83. doi: 10.1016/j.jcomdis.2014.11.003. [DOI] [PMC free article] [PubMed] [Google Scholar]
- McMurray B, Tanenhaus M, Aslin R. Gradient effects of within-category phonetic variation on lexical access. Cognition. 2002;86:B33–B42. doi: 10.1016/s0010-0277(02)00157-9. [DOI] [PubMed] [Google Scholar]
- Maxwell EM, Weismer G. The contribution of phonological, acoustic, and perceptual techniques to the characterization of a misarticulating child’s voice contrast for stops. Applied Psycholinguistics. 1982;3:29–43. [Google Scholar]
- McGlone R, Proffitt WR. Patterns of tongue contact in normal and lisping speakers. Journal of Speech and Hearing Research. 1973;16:456–476. doi: 10.1044/jshr.1603.456. [DOI] [PubMed] [Google Scholar]
- Macrae T, Tyler A, Lewis K. Lexical and phonological variability in preschool children with speech sound disorder. American Journal of Speech-language Pathology. 2014;23(1):27–35. doi: 10.1044/1058-0360(2013/12-0037). [DOI] [PubMed] [Google Scholar]
- Macrae T, Sosa A. Predictors of token-to-token inconsistency in preschool children with typical speech-language development. Clinical Linguistics & Phonetics. 2015;29:922–937. doi: 10.3109/02699206.2015.1063085. [DOI] [PubMed] [Google Scholar]
- Munson B, Brinkman KN. The effect of multiple presentations on judgments of children’s speech production accuracy. American Journal of Speech-Language Pathology. 2004;13:341–354. doi: 10.1044/1058-0360(2004/034). [DOI] [PubMed] [Google Scholar]
- Munson B, Edwards J, Schellinger SK, Beckman ME, Meyer MK. Deconstructing phonetic transcription: covert contrast, perceptual bias, and an extraterrestrial view of Vox Humana. Clinical Linguistics and Phonetics. 2010;24:245–260. doi: 10.3109/02699200903532524. [DOI] [PMC free article] [PubMed] [Google Scholar]
- Munson B, Johnson J, Edwards J. The Role of Experience in the Perception of Phonetic Detail in Children’s Speech: A Comparison of Speech-Language Pathologists with Clinically Untrained Listeners. American Journal of Speech-Language Pathology. 2012;24:124–139. doi: 10.1044/1058-0360(2011/11-0009). [DOI] [PMC free article] [PubMed] [Google Scholar]
- Munson B, McDonald EC, DeBoe NL, White AR. Acoustic and perceptual bases of judgments of women and men’s sexual orientation from read speech. Journal of Phonetics. 2006;34:202–240. [Google Scholar]
- Munson B, Urberg Carlson K. An Exploration of Methods for Rating Children’s Productions of Sibilant Fricatives. Speech, Language, and Hearing. 2015 doi: 10.1080/2050571X.2015.1116154. in Press in. [DOI] [PMC free article] [PubMed] [Google Scholar]
- Pisoni D, Tash J. Reaction times to comparisons within and across phoneme categories. Perception and Psychophysics. 1974;15(2):285–290. doi: 10.3758/bf03213946. [DOI] [PMC free article] [PubMed] [Google Scholar]
- Price D, McGrath P, Rafii A, Buckingham B. The validation of visual analogue scales as ratio scale measures for chronic and experimental pain. Pain. 1983;17:45–56. doi: 10.1016/0304-3959(83)90126-4. [DOI] [PubMed] [Google Scholar]
- Sander EK. When are Speech Sounds Learned? Journal of Speech and Hearing Disorders. 1972;37:55–63. doi: 10.1044/jshd.3701.55. [DOI] [PubMed] [Google Scholar]
- Schneider W, Eschmann A, Zuccolotto A. E-Prime user’s guide. Pittsburgh, PA: Psychology Software Tools, Inc; 2002. [Google Scholar]
- Scobbie J, Gibbon F, Hardcastle WJ, Fletcher P. Covert contrasts as a stage in the acquisition of phonetics and phonology. In: Broe M, Pierrehumbert J, editors. Papers in Laboratory phonology V: Language acquisition and the lexicon. Cambridge, U.K: Cambridge University Press; 2000. pp. 194–207. [Google Scholar]
- Smit A, Hand L, Freilinger JJ, Bernthal J, Bird A. The Iowa Articulation Norms Project and its Nebraska Replication. Journal of Speech and Hearing Disorders. 1990;55:779–798. doi: 10.1044/jshd.5504.779. [DOI] [PubMed] [Google Scholar]
- Stoel-Gammon C. Transcribing the Speech of Young Children. Topics in language disorders. 2001;21:12–21. [Google Scholar]
- Strömbergsson S, Salvi G, House D. Acoustic and perceptual evaluation of category goodness of /t/ and /k/ in typical and misarticulated children’s speech. Journal of the Acoustical Society of America. 2015;137:3422–3435. doi: 10.1121/1.4921033. [DOI] [PubMed] [Google Scholar]
- Toscano J, McMurray B, Dennhardt J, Luck S. Continuous perception and graded categorization: Elecrophysiological evidence for a graded relationship between the acoustic signal and perceptual encoding of speech. Psychological Science. 2010;21:1532–1540. doi: 10.1177/0956797610384142. [DOI] [PMC free article] [PubMed] [Google Scholar]
- Tyler AA, Figurski GR, Langdale T. Relationships between acoustically determined knowledge of stop place and voicing contrasts and phonological treatment progress. Journal of Speech and Hearing Research. 1993;36:746–759. doi: 10.1044/jshr.3604.746. [DOI] [PubMed] [Google Scholar]
- You H-Y. An Acoustic and Perceptual Study of English Fricatives. Ms.C. Thesis. Canada: University of Edmonton, Edmonton; 1979. [Google Scholar]