

ABSTRACT
Signalling nanodomains requiring close contact between the plasma membrane and internal compartments, known as ‘junctions’, are fast communication hubs within excitable cells such as neurones and muscle. Here, we have examined two transgenic murine models probing the role of junctophilin-2, a membrane-tethering protein crucial for the formation and molecular organisation of sub-microscopic junctions in ventricular muscle cells of the heart. Quantitative single-molecule localisation microscopy showed that junctions in animals producing above-normal levels of junctophilin-2 were enlarged, allowing the re-organisation of the primary functional protein within it, the ryanodine receptor (RyR; in this paper, we use RyR to refer to the myocardial isoform RyR2). Although this change was associated with much enlarged RyR clusters that, due to their size, should be more excitable, functionally it caused a mild inhibition in the Ca2+ signalling output of the junctions (Ca2+ sparks). Analysis of the single-molecule densities of both RyR and junctophilin-2 revealed an ∼3-fold increase in the junctophilin-2 to RyR ratio. This molecular rearrangement is compatible with direct inhibition of RyR opening by junctophilin-2 to intrinsically stabilise the Ca2+ signalling properties of the junction and thus the contractile function of the cell.
KEY WORDS: Excitation-contraction coupling, Junctophilin-2, Ryanodine receptor, Ca2+ signalling, Super-resolution imaging, dSTORM
Highlighted Article: The availability of the membrane tether junctophilin-2 determines the nanostructure of the fast intracellular Ca2+ signalling junctions but, if present above a minimum required level, forms an auto-regulatory mechanism which maintains local Ca2+ signals broadly independent of the structural differences.
INTRODUCTION
The contraction of cardiac ventricular muscle cells is tightly controlled by a transient increase in cytosolic Ca2+ concentration. The majority of this Ca2+ enters the cytosol from the sarcoplasmic reticulum (SR), an intracellular Ca2+ store, through ryanodine receptors (RyRs; in this paper, we use RyR to refer to the myocardial isoform RyR2), that is, intracellular Ca2+ channels that form clusters in junctions between the sarcolemma (and its extensions, the t-tubules) and the SR (Bers, 2002). The t-tubules penetrate and form junctions with the SR throughout the entire thickness of ventricular myocytes, allowing the electrical activation to rapidly propagate within the cell and to be transduced uniformly. This is crucial for a forceful and near-simultaneous activation of the contractile machinery across the whole cell (Brette and Orchard, 2003). There is now firm evidence that a decline in the amplitude of the Ca2+ transient is a frequent contributing factor to the contractile deficit in heart failure. At least two mechanisms are implicated in the suppression of the Ca2+ transient: (1) a disappearance or reorganisation of t-tubules (Crossman et al., 2011; Lyon et al., 2009; Wei et al., 2010) that leaves regions of the cell distal to points of rapidly transduced electrical activation, and (2) that changes in the properties of RyR clusters might alter the properties of microscopic Ca2+ release (Song et al., 2006; Yano et al., 2000; McCall et al., 1996) events, termed Ca2+ sparks (Cheng et al., 1993).
These quite distinct mechanisms appear to be closely linked by the intrinsic SR protein junctophilin (JPH) (Takeshima et al., 2000). In the heart, the junctophilin type 2 isoform (JPH2) dominates and it is thought to stabilise junctions due to the lipid affinity of its N-terminus (Takeshima et al., 2000). Reduction of JPH2 expression can cause changes in junctional membrane distances (Van Oort et al., 2011; Takeshima et al., 2000) and also leads to loss of t-tubules and irregularity in t-system architecture (Van Oort et al., 2011; Wei et al., 2010). A progressive reduction of JPH2 expression has been observed in several models of heart failure (Minamisawa et al., 2004; Xu et al., 2007) and is thus closely linked to a loss of t-system regularity and contractile deficit (Woo et al., 2010; Landstrom et al., 2011; Wagner et al., 2012). Although the effect of altered JPH2 expression on the t-system has been documented in some detail, the effect of JPH2 expression on RyR organisation has not been investigated directly. Junctophilin-4 (JPH4) has been identified as a key component in the plasma-membrane–endoplasmic reticulum (PM–ER) junctions in T cells, where it is involved in recruitment of Ca2+-sensing proteins to these domains (Woo et al., 2016), indicating that the JPH family plays a role in junctional protein organisation. A difficulty in revealing RyR cluster properties stems from the limited resolution of conventional fluorescence imaging which cannot resolve cluster structures. Thin-section electron microscopy micrographs suggest some alterations in the cardiac dyad membrane topology (Guo et al., 2014), the narrow junction between terminal SR and sarcolemma, but the thin sectioning and limited contrast complicate the analysis of RyR clustering within this space. The recently established modality of fluorescence super-resolution fluorescence imaging has provided a new way to look at cluster properties with increased resolution and contrast (Baddeley et al., 2011; Jayasinghe et al., 2012; Hou et al., 2015). We have also demonstrated that the densities of fluorophore molecules detected with this method can faithfully report nanoscale differences in RyR expression levels in muscle couplons (Jayasinghe et al., 2014), making it a sensitive modality for detecting any changes in the molecular composition of the dyads. In this study, we have used single-molecule localisation microscopy (SMLM) to reveal marked changes in cluster properties in response to JPH2 modulation.
The overexpression of JPH2 has become a focus of recent interest as it might be protective by helping maintain sufficient JPH2 levels during cardiac remodelling and thereby preventing the loss and dysregulation of the t-system. Indeed, a recent study found that mice overexpressing JPH2 were protected from pressure-overload-induced t-tubule disruption (Guo et al., 2014), which showed a preservation of t-system regularity, but did not provide a detailed investigation of RyR clusters. With the great potential of exploiting JPH2 modulation as a biophysical as well as interventional tool, it is now crucial to understand how it affects RyR clustering at the nanoscale, and how that in turn modifies functional release events and cardiac excitation–contraction coupling. In addition to a putative structural role as a membrane anchor (Takeshima et al., 2000), it has been suggested that JPH2 plays a functional modulatory role, and that the association between RyRs and JPH might stabilise RyRs by reducing their open probability at a given cytosolic Ca2+ concentration (Beavers et al., 2013). Dissecting these two roles has proven to be challenging because it requires (1) conditions that are effective in altering the junctional availability of JPH2 and (2) a methodology to observe both the spatial properties of their mutual organisation and of the Ca2+ sparks under these conditions.
To achieve this, we conducted a super-resolution study of RyR cluster properties in a murine model of JPH2 overexpression and compared cluster properties to those in cells from control animals, and animals with acute JPH2 knockdown, while also studying the functional consequences by analysing a number of key features of intracellular Ca2+ handling. We show that JPH2 expression is pivotal in the regulation of the junctional nanodomain, whereby it determines not only the clustering properties of RyRs but also their functional gating for maintenance of Ca2+ signalling. Our new data reveal a clear change in RyR clustering in response to a molecular intervention, which, to our knowledge, has not been observed before.
RESULTS
RyR clusters in myocytes with altered JPH2 expression
In general, the distribution of RyR staining in murine ventricular myocytes, as seen in SMLM super-resolution images of transversely sectioned myocytes (Fig. 1A–C), broadly resembled that reported previously in rat (Baddeley et al., 2009; Hou et al., 2015). Extended RyR patches surrounded by areas occupied by myofibrils (which was confirmed in double labelling images with α-actinin, Fig. S1A–C), similar to previous observations in both rat and mouse myocytes (Hou et al., 2015; Wong et al., 2013). Closer inspection revealed differences between cells from animal models in which JPH2 expression was altered. Clusters of RyR labelling in JPH2-knockdown (JPH2-KD) mice appeared (Fig. 1A, inset) qualitatively similar in size to those observed in myocytes from control mice (Fig. 1B, inset). JPH2-overexpressing (JPH2-OE) cardiomyocytes, by contrast, frequently contained large RyR clusters that appeared more rounded in morphology (Fig. 1C, inset).
Fig. 1.

JPH2 expression influences the nanoscale organisation of RyR clusters. Super resolution images of RyR labelling in myocardium with transverse orientation from (A) JPH2-KD, (B) control and (C) JPH2-OE mice; magnified view of clusters are shown in the insets. Scale bars: 4 µm (main panels); 0.5 µm (insets). Analysis of RyR clusters imaged in transverse orientation showing: (D) the RyR cluster size and (E) the distribution of the number of RyR clusters across increasing cluster size on a logarithmic scale (colour-coded as in D). (F) The mean size of the RyR super-clusters, and (G) the prevalence of RyR macro-clusters as number observed per 100 µm2. Control, n=11 cells, 2 animals; JPH2-KD, n=12 cells, 2 animals; JPH2-OE, n=9 cells, 2 animals. Data are displayed as mean±s.e.m. *P<0.05, **P<0.01, ***P<0.001 (Kruskal–Wallis two-sided test).
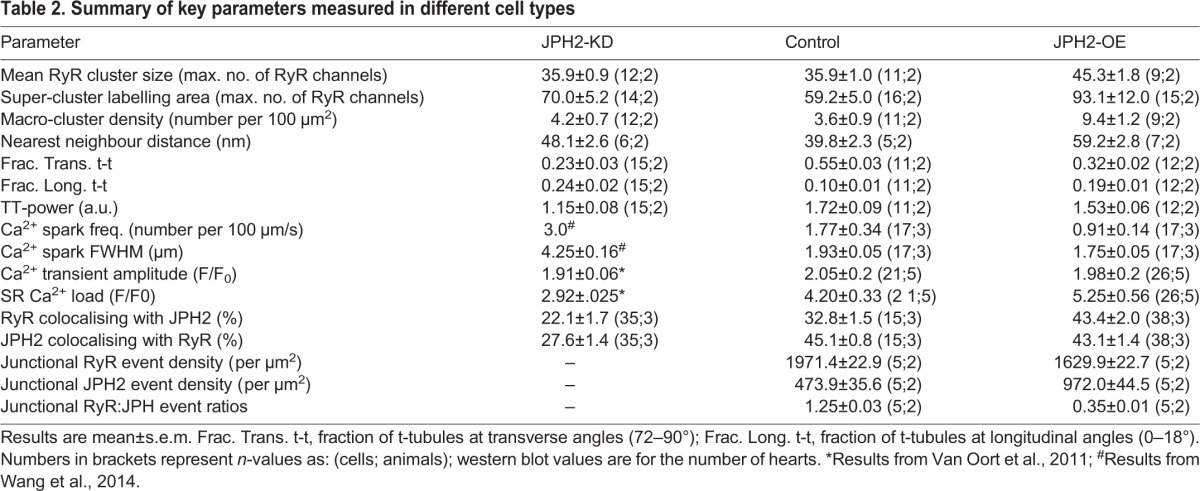
In addition to RyR cluster size and morphologies, we analysed inter-cluster distances, as these are important in determining the Ca2+-dependent coupling between clusters. The analysis showed that typically 80–90% of clusters are within a distance ≤100 nm of a nearest neighbour (see Fig. S1I), sufficiently close to see >10 µM [Ca2+]i (Sobie et al., 2006) during cluster activation, leading to a high probability of co-activation. We grouped such clusters into functional ‘super-clusters’ (Baddeley et al., 2009; Hou et al., 2015) which approximately doubled effective cluster sizes. Super-cluster sizes were comparable between JPH2-KD and control myocytes (70.0±5.2 RyR versus 59.2±5.0, RyR; mean±s.e.m.). By contrast, JPH2-OE myocytes exhibited a ∼57% increase as compared to control cells (93.1±12.0 RyR), as illustrated in Fig. 1F. Visually, the presence of very large clusters in JPH2-OE cells was prominent (Fig. 1C), and we quantified this by measuring the density of ‘macro-clusters’, which we defined as clusters with a capacity of >200 RyRs (see Table 1 for numbers of clusters analysed). JPH2-OE cells had an increased density of such clusters, ∼2.6-fold higher (9.4±1.2 per 100 µm2) compared to control cells (3.6±0.9 per 100 µm2), with no significant difference between the macro-cluster density in control and JPH2-KD myocytes (4.2±0.7; Fig. 1G). For a summary of results, see Table 2.
Table 1.
Summary of numbers for RyR cluster size analysis
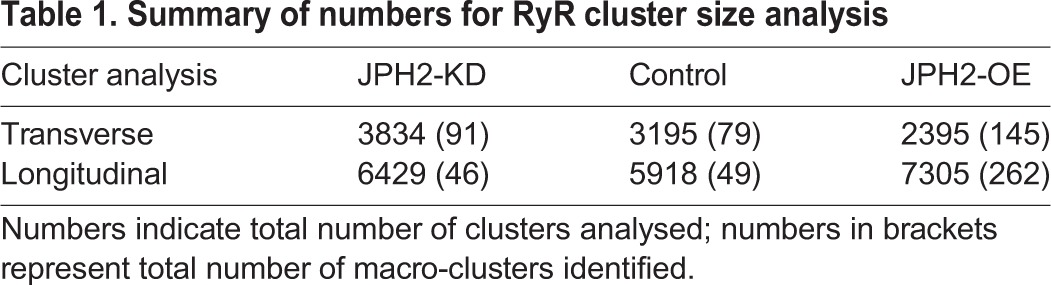
Table 2.
Summary of key parameters measured in different cell types
JPH2 and RyR association in cells with altered JPH2 expression
We investigated whether the additional JPH2 in JPH2-OE cells was associated with RyRs in a similar way to in myocytes from control animals. Longitudinal optical sections of cardiomyocytes labelled for JPH2 and RyR from JPH2-KD, control and JPH2-OE myocytes all showed a predominantly z-line-associated arrangement of both proteins (Fig. 2A–C). However, JPH2-KD labelling appears more dispersed from the z-line compared to control myocytes. Qualitatively, a reduced overlap between RyR and JPH2 labelling was also observed in JPH2-KD cells in comparison with control cells, which show tight transverse rows of clusters with moderate levels of colocalisation between JPH2 and RyR. JPH2-OE cardiomyocytes show a similar pattern of JPH2 and RyR distribution to controls, again containing many large clusters positive for both labels. We quantified the relative amount of JPH2 staining (see Methods) and, as expected, the mean density of JPH2 localisation events per µm2 was reduced ∼40% in the JPH2-KD cells compared to controls (140.8±8.4 and 226.0±19.9 events per µm2, respectively; mean±s.e.m.), while being increased ∼60% in JPH2-OE cells (361.2±44.6 events per µm2; Fig. 2D).
Fig. 2.

JPH2 expression influences colocalisation with RyR. Super resolution images showing dual immunolabelling of RyR (red) with JPH2 (green) in cardiomyocytes isolated from (A) JPH2-KD, (B) control and (C) JPH2-OE mice. Scale bars: 1.5 µm. (D) Global mean density per cell cross-sectional area of JPH2 localisation events in the three genotypes. JPH2-KD, n=38 cells, 3 animals; control, n=29 cells, 3 animals; JPH2-OE, n=40 cells, 3 animals. (E,F) Colocalisation analysis in JPH2-KD (red), control (blue) and JPH2-OE (green) mice showing the fraction of (E) RyR label colocalised with JPH2 and (F) JPH2 label colocalised with RyR; JPH2-KD: n=35 cells, 3 animals, control: n=15 cells, 3 animals, JPH2-OE: n=38 cells, 3 animals. (G) Western blot analysis of RyR, JPH2 and GAPDH expression levels in control and JPH2-OE mice with (H) GAPDH-normalised expression levels of RyR and JPH2 in control (blue) and JPH2-OE (green) mouse hearts; RyR, n=5 animals each; JPH2, n=5 control animals, n=6 JPH2-OE animals. Data are displayed as mean±s.e.m. *P<0.05, **P<0.01, ***P<0.001 (Kruskal–Wallis two-sided test in D; two-sided Student's t-test in E,F,H).
Colocalisation super-resolution analysis of RyR and JPH2 dual-labelled cells confirmed differences in the three genotypes. The colocalising percentage of RyR with JPH2 reduced to 22.1±1.7% in JPH2-KD cells, compared to 32.8±1.5% in control; of the remaining JPH2 following knockdown in the JPH2-KD cells, only 27.6±1.4% was colocalised with RyR, significantly reduced from 45.1±0.8% in control. Taken together, JPH2 knockdown greatly reduced colocalisation between RyR and JPH2. By contrast, in JPH2-OE myocytes, colocalisation of RyR with JPH2 was significantly increased to 43.4±2.0% (Fig. 2E), whereas the percentage of JPH2 colocalisation with RyR (43.1±1.4%) (Fig. 2F) was unaltered. This is consistent with the idea that a major fraction of the increased levels of JPH2 associate with RyR clusters, a point we investigate below in more detail.
The increased colocalisation of RyR with JPH2 raises the question of how RyR expression changes with JPH2 modulation. We therefore performed western blot analysis of protein expression levels which first confirmed a ∼3.1-fold increased JPH2 expression in JPH2-OE cells (Fig. 2G). By contrast, there was no significant change in the level of RyR expression in JPH2-OE mice (∼0.9-fold) compared to that in control mice (Fig. 2H).
T-tubule system changes in cells with altered JPH2
In the context of altered JPH2 expression, it is also important to consider any further changes to the plasma membrane structure itself. In cardiac muscle cells, the loss of JPH2 has previously been shown to play a major role in the organisation of the t-tubules (Van Oort et al., 2011; Wei et al., 2010; Wu et al., 2014; Chen et al., 2013). In addition to control and JPH2-OE myocytes, JPH2-KD myocytes were also included as a sample with known changes in t-system properties (Van Oort et al., 2011). As anticipated, JPH2-KD myocytes had a disrupted t-tubule architecture (Fig. 3A), as typically seen in previous JPH2-KD studies and murine models of heart failure (Van Oort et al., 2011; Wei et al., 2010). Control cardiomyocytes had predominantly transversely orientated t-tubules in a regular distribution within the cell (Fig. 3B). This regular arrangement of t-tubules was preserved in JPH2-OE cells, but along with an apparently slightly increased number of longitudinal connections (Fig. 3C). A fast Fourier transform (FFT) analysis confirmed the observed changes in regularity (see Fig. S2A–D). In addition, we performed an explicit quantification of the t-tubule orientations across all three genotypes. Briefly, this involved the skeletonisation of two-dimensional confocal data like that shown in Fig. 3A–C and the application of a directionality algorithm which determined the local angle of the skeleton elements in relation to the vertical (y) plane as illustrated in Fig. 3D. The primary output of this analysis was a frequency histogram of the tubule angles (Fig. 3E; see Fig. S2E–G for normalised histograms), which were categorised into ‘transverse’ and ‘longitudinal’ elements (Fig. 3F). In this analysis, control cells had mostly transversely oriented tubules (tt 53%±3% at 72–90° to the cell long axis; mean±s.e.m.) and few longitudinal tubules (lt 10±1% at 0–18°); however, JPH2-OE had a less pronounced excess of transverse over longitudinal elements (tt 32±2% versus lt 19±1%) reflecting the increased appearance of longitudinal connections. In JPH2-KD cardiomyocytes the directionality of the t-system had been largely lost as evidenced by an essentially flat angle-versus-frequency histogram (Fig. S2G) with longitudinal and transverse connections about equally frequent (tt 23±3% versus lt 24±2%). Taken together, this confirms that the loss of JPH2 profoundly affects the regularity and orientation of the t-system, as seen before, whereas overexpression of JPH2 has a more subtle effect on t-system architecture, promoting a moderate increase in the frequency of longitudinal t-system connections.
Fig. 3.

The t-tubule membrane system changes in cells with altered JPH2 expression. Deconvolved confocal micrographs showing t-tubule immunolabelling in cardiomyocytes isolated from (A) JPH2-KD, (B) control and (C) JPH2-OE mice. Scale bars: 5 µm. The local angles of t-tubules were analysed on skeletonised confocal images such as in A–C. The shown example image illustrates (D) a two-dimensional map of the locally determined angle, colour-coded and statistically analysed as (E) a frequency distribution of all t-tubule angles measured in relation to the longitudinal axis of the cell. (F) Fraction of longitudinally (0–18°; white) and transversely (72–90°; black) orientated t-tubules in JPH2-KD (n=15 cells, 2 animals), control (n=11 cells, 2 animals) and JPH2-OE (n=12 cells, 2 animals) cardiomyocytes. Data are displayed as mean±s.e.m. +++P<0.001 (transverse versus longitudinal within genotype); *P<0.05 (JPH2-KD versus JPH2-OE), ***P<0.001 (control versus JPH2-KD and JPH2-OE) longitudinal angles; #P<0.05 (JPH2-KD versus JPH2-OE), ###P<0.001 transverse angles (control versus JPH2-KD and JPH2-OE) (Kruskal–Wallis two-sided test).
JPH2-OE cardiomyocytes Ca2+ handling
The Ca2+ handling in response to acute JPH2 knockdown has previously been characterised and shown to increase the propensity for spontaneous Ca2+ release and reduced Ca2+ amplitude transients (Wu et al., 2012; Landstrom et al., 2011; Van Oort et al., 2011; Takeshima et al., 2000). The observed changes in RyR cluster properties and the increased amount of JPH2 raise the question as to how this affects excitation–contraction coupling in JPH2-OE myocytes. Analysis of spontaneous Ca2+ sparks in line scan images of quiescent JPH2-OE myocytes (Fig. 4A) showed a reduction in the frequency of Ca2+ sparks compared to controls (0.91±0.14 and 1.77±0.34 sparks/100 µm/s, respectively; mean±s.e.m.; Fig. 4B). Quantitative analysis of the recorded Ca2+ spark profiles in JPH2-OE cells revealed a moderate reduction in spark size [1.75±0.05 versus 1.93±0.05 µm for the full width at half maximum (FWHM); Fig. 4C].
Fig. 4.

Normal Ca2+ transients and reduced Ca2+ spark frequency in JPH2-OE mice. (A) Representative confocal line-scan images showing Ca2+ sparks in ventricular myocytes from control and JPH2-OE mice. (B) Quantification showing reduced Ca2+ spark frequency in JPH2-OE compared to control mice. (C) Quantification showing decreased Ca2+ spark size in JPH2-OE mice (FWHM; n=17 cells, 3 animals both genotypes). (D) Confocal linescan images showing similar Ca2+ transients in ventricular myocytes from control and JPH2-OE mice. (E) Bar graph showing quantification of Ca2+ transient amplitude (CaT). (F) Bar graph quantifying increased SR Ca2+ load in JPH2-OE cardiomyocytes (control n=21, cells, 5 animals; JPH2-OE, n=26 cells, 5 animals). Data are displayed as mean±s.e.m. *P<0.05, ***P<0.001 (two-sided Student's t-test).
Ca2+ transients in response to electrical stimulation looked broadly similar between control cells and JPH2-OE myocytes (Fig. 4D), but appeared more spatially non-uniform in JPH2-OE cells. Importantly, the amplitude and timecourse of the spatially averaged Ca2+ transients were very similar between JPH2-OE and control. The Ca2+ transient amplitude in JPH2-OE (F/F0=1.98±0.02) and control (F/F0=2.05±0.02) were statistically indistinguishable (Fig. 4E). Whereas the global Ca2+ transients appear essentially normal in JPH2-OE myocytes, this was associated with increased SR Ca2+ load compared to controls (F/F0=5.25±0.56 versus F/F0=4.20±0.33; Fig. 4F). These results suggest that JPH2-OE myocytes exhibit essentially normal excitation–contraction coupling, although this is associated with some modifications in microscopic Ca2+ handling (Ca2+ sparks and SR load), and, vitally, global Ca2+ handling remains ‘normal’ despite major changes in RyR cluster properties.
RyR and JPH2 density within co-clusters
With the increase in RyR cluster size, we would have expected an increase in Ca2+ spark rate and possibly in Ca2+ spark size in JPH2-OE myocytes. We therefore investigated the molecular makeup of JPH2 and RyR co-clusters in more detail as this might provide evidence of the molecular mechanisms influencing RyR cluster function, and because the local signalling that underlies cardiac excitation–contraction coupling will be controlled by the density of JPH2 (and RyRs) in a given cluster, rather than the spatially averaged densities. To obtain a measure of the density of proteins in a cluster, we used the number of marker localisations, which should be approximately proportional to the number of labelled proteins in a cluster (Baddeley et al., 2009; Hou et al., 2015). JPH2 and RyR co-cluster both in control and JPH2-OE cells (Fig. S3) and we compared marker event densities in both genotypes (Fig. 5A). The slope of RyR cluster area versus number of detected events was different between cell types (Fig. 5B), indicating a reduced density in JPH2-OE cells (1.63±0.22×103 μm−2; mean±s.e.m.) as compared to control cells (1.97±0.22×103 μm−2). A similar analysis was conducted for JPH2 revealing a >2-fold increase of JPH2 density in RyR–JPH2 co-clusters in JPH2-OE versus control (0.97±0.04 versus 0.47±0.04×103 μm−2).
Fig. 5.

RyR and JPH2 density in co-clusters with JPH2 overexpression. (A) Examples of corresponding RyR and JPH2 clusters in control and JPH2-OE cardiomyocytes, showing an overall similar junctional shape of the two proteins. Scale bars: 0.25 µm. (B) Super resolution event counts for junctional RyR according to cluster size in both genotypes, with a significantly reduced mean event density in JPH2-OE cells; the corresponding mean junctional JPH2 event density is significantly increased in JPH2-OE mice (control, n=5 cells, 2 animals; JPH2-OE, n=5 cells, 2 animals). Data are displayed as mean±s.e.m. ***P<0.001 (Mann–Whitney two-sided test). (C) The distribution ratio of RyR events to JPH2 events within the junction is altered between control and JPH2-OE mice, suggesting fewer RyR per JPH2 present in JPH2-OE [1.25±0.03 versus 0.35±0.01 RyR-events per JPH2-event; mean±s.e.m.; P<0.001, Z-statistic determined from slopes based on the Paternoster et al. (1998) equation]. (D) A schematic representing the organisation of the junction in control and JPH2-OE mice based on the nanoscale RyR and JPH2 cluster properties that were measured and the dyad membrane topology resolved by Guo et al. (2014).
RyR to JPH2 ratios
The observations above suggest that the ratio of RyRs to JPH2 is altered when JPH2 expression is increased. To test this possibility directly, we compared RyR versus JPH2 event counts on a per cluster basis. The relationships determined from scatter plots of data from control and JPH2-OE cells (Fig. 5C) exhibited markedly different slopes (1.25±0.03 versus 0.35±0.01 RyR-events per JPH2 event; mean±s.e.m.). Assuming that event counts are approximately proportional to local protein densities, this implies a more than 3-fold increase in the ratio of JPH2 to RyR in co-clusters within JPH2-OE myocytes as compared to control cells that have normal levels of JPH2 expression.
DISCUSSION
A putative role of JPH2 is the maintenance of the close contact between sarcolemmal and SR membranes to form dyadic junctions (Takeshima et al., 2000). In our study, we observed and quantified pronounced changes in junctional RyR cluster organisation predominantly in response to JPH2 overexpression. The superior resolution of our imaging methods and marker specificity were crucial for these investigations.
The functional effect of acute JPH2 knockdown has been previously shown to lead to remodelling of the t-system. Our new data demonstrate that the sizes of RyR clusters do not significantly change (Fig. 1; Fig. S1), although, as expected, the amount of JPH2 associated with RyR clusters is greatly reduced. In addition, as previously shown, expression of the Na+/Ca2+ exchanger NCX (also known as SLC8A) at RyR clusters is reduced (Wang et al., 2014). The amplitude of the Ca2+ transient was reduced in these myocytes, but an observed increase in both the frequency and size of Ca2+ sparks indicated increased ‘leakiness’ of RyRs (Van Oort et al., 2011). The loss of NCX might contribute to the observed increase in Ca2+ spark rates by increasing junctional Ca2+ levels (Wang et al., 2014). More directly, partial removal of JPH2 might reduce a putative stabilizing effect of JPH on RyRs [that likely involves JPH2 binding to RyRs (Van Oort et al., 2011)].
The observation of abnormal Ca2+ handling resulting from JPH2 knockdown and an observed progressive loss of JPH2 in several models of heart failure has led to the idea of JPH2 overexpression as a potentially protective mechanism to provide a reserve in the face of reductions in JPH2. The main focus of our study has therefore been the characterisation of the consequences of an overexpression of JPH2 on RyR clusters in the murine heart.
The idea of a protective role for JPH2 overexpression has been previously investigated by Guo et al. (2014) who showed that a JPH2-overexpressing mouse strain had essentially normal Ca2+ handling that protected these mice from pressure-overload-induced disruption of the t-tubule system (Guo et al., 2014). Although that study used thin-sectioning electron microscopy to show that ‘contact points’ between t-system and SR were more numerous, no detailed investigation of the changes in elementary Ca2+ release units (CRUs) could be conducted with that approach. Our study has used super-resolution microscopy as a sensitive tool to show that the RyR cluster structure is a vital part of the cellular response to JPH2 overexpression.
The presence of very large RyR ‘macro-clusters’ in our JPH2-OE myocytes was the most visually striking feature and was confirmed by quantitative analysis, which showed a nearly 30% increase in mean cluster size and a ∼2.6-fold increase in macro-clusters (containing >200 RyRs). Such large RyR clusters would be expected to be more readily triggered, as the opening of any single RyR might be sufficient to trigger firing of the whole cluster. In addition, the maximal release flux supported should grow with the number of RyRs, which could in principle lead to larger Ca2+ sparks. We therefore investigated the microscopic Ca2+ signalling in JPH2-OE myocytes.
Unexpectedly, despite larger RyR cluster sizes (and moderately increased SR load) the Ca2+ spark rates in JPH2-OE myocytes were reduced. In addition, Ca2+ spark size was slightly reduced. The fact that spark size does not increase might reflect that release is terminated by partial terminal SR depletion (Stern et al., 2013), which would greatly reduce the effect of RyR cluster size on the amount of Ca2+ released; differences in peak flux rates are difficult to resolve due to a rate-limiting effect of Fluo-4 kinetics (Kong et al., 2013). An additional point is the reduced spark size, which could be a consequence of the convoluted dyad shape (Guo et al., 2014), leading to impaired diffusion in the centre of the spark. The decreased Ca2+ spark rates in JPH2-OE cells are more difficult to explain unless the gating of RyRs has been altered or the arrangement of RyRs within clusters has been modified. By further analysing the data obtained from our RyR cluster studies, we found evidence for changes in the association of JPH2 with RyRs and RyR cluster structure that are broadly compatible with the observed changes in spark rates as discussed below. Importantly, we observed essentially normal Ca2+ signalling, similar to Guo et al. (2014), suggesting that this is a robust feature of JPH2 overexpression.
In a recent study by Woo et al. (2016), it was shown that overexpression of JPH4 is involved in the recruitment of stromal interaction molecule 1 (STIM1) to the plasma-membrane–ER junctions in T cells, where JPH4 is also implicated in regulating Ca2+ homeostasis (Woo et al., 2016). Our distance-based colocalisation analysis indicates that the increased cardiac JPH2 is largely associated with RyR clusters in junctions, which is also consistent with the observation of extended co-clusters of JPH2 and RyRs (Fig. S3). The increased JPH2 density leads to a larger fraction of RyRs being colocalised with JPH2, which raises the possibility that more RyRs are directly associated with molecularly close JPH2. We tested this idea by quantitatively comparing the density of JPH2 to RyR events within co-clusters. For this analysis, the density of single-molecule localisations was used as a proxy for the respective protein concentrations. The influence of dye photo-physics can complicate the relationship between event counts and actual marker concentration (Durisic et al., 2014); we minimised this effect by comparing cells imaged under identical conditions. When we performed relative comparisons these showed an ∼3-fold increase in the ratio of JPH2 to RyR event ratios in JPH2-OE myocytes, fully consistent with the idea that the fraction of RyRs to which JPH2 is bound is increased in JPH2-OE myocytes. This might explain the lower spark rate as JPH2s stabilise RyRs by right shifting their Ca2+ sensitivity curves, as supported by experiments with interfering peptides (Beavers et al., 2013). In addition, we observed a slightly reduced event density of RyR markers within RyR clusters (∼17%) when comparing data from control and JPH2-OE myocytes. This raises the possibility that the distances between RyRs within a cluster are larger in JPH2-OE myocytes (although this would also slightly change our cluster size calibration in JPH2-OE cells, the effect is small enough to not affect our conclusion that RyR clusters are larger). The distances between RyRs has recently been shown to be both variable and dynamically adjustable in cardiac myocytes (Asghari et al., 2014) and if increased would also tend to reduce excitability of a RyR cluster [e.g. the model by Walker et al. (2015)]. Increased RyR channel distances within a cluster might also secondarily reduce channel excitability by decreasing the likelihood of inter-channel interactions, such as those assumed in quasi-crystalline arrays, in which each channel can physically interact with up to four neighbouring channels (Yin et al., 2005; Cabra et al., 2016). This arrangement has been suggested to contribute to co-operative channel opening through coupled gating (Marx et al., 2001), which, if normally physiologically present, could potentially be reduced in JPH2-OE myocytes.
We have schematically summarised these changes within junctional RyR clusters in Fig. 5D. The stabilising effect of JPH2 on RyRs and an increased distance between RyRs together likely ensure that the larger clusters in JPH2-OE are not more excitable than those in control myocytes, and together with a largely normal t-system support stable, normal excitation–contraction coupling in JPH2-OE myocytes. These altered structure–function relationships in response to an overexpression of JPH2 provide a consistent mechanistic clarification of the surprising functional normality of these transgenic cells.
We note that an additional role might be attributable to NCX, which we therefore also investigated. NCX indeed exhibits increased colocalisation with RyRs in JPH2-OE myocytes (Fig. S4; Table S1), but the importance over the brief time course of Ca2+ release during a Ca2+ spark might not be large.
JPH2 overexpression had comparatively little impact on the t-system morphology similar to findings in Guo et al. (2014). Detailed analysis showed an increase in longitudinal t-system connections (by ∼10%) which might result from the role of JPH2 in the development of the t-system (Chen et al., 2013; Reynolds et al., 2013), but importantly this does not lead to any detectable impact on Ca2+ handling in intact myocytes. Taken together, the moderate effect on t-system architecture in conjunction with essentially normal Ca2+ handling in JPH2-OE murine myocytes in a mouse model independently developed from that shown in Guo et al. (2014) shows that these are robust observations that do not depend on details of the overexpression system, which is important when considering its therapeutic potential.
The detailed mechanisms how JPH leads to changes in RyR cluster organisation remain largely unclear. One possibility is that more JPH2 can maintain larger dyadic cleft spaces that harbour larger populations of RyRs. The shape of the RyR cluster size histograms remain very similar to those seen in control myocytes implying consistency with a cluster layout that results from self-organisation by stochastic aggregation of RyRs (Baddeley et al., 2009). A complicating point is the apparently lower density of RyRs in these larger junctional membrane patches, which points to a more complex role through which JPH2 influences junctional makeup. Our functional observations (i.e. reduced Ca2+ spark probabilities in spite of increased size of RyR clusters and SR load) provide increasing evidence for a stabilising role of JPH2 on RyRs that might result from JPH2 directly interacting with RyRs. Further studies on direct influences of JPH2 on RyR channel gating could help clarify these points. In addition, the links between nanoscale junctional changes and cell-wide t-system architecture remain only partially understood and reflect significant gaps in our mechanistic understanding of t-system maintenance and turnover.
The increased resolution afforded by super-resolution imaging, here direct stochastic optical reconstruction microscopy (dSTORM)-based approaches, was crucial to the new insights that were obtained. A fully quantitative imaging approach has not yet been achieved, but even if the relationship between event counts and actual protein concentrations is not strictly linear it should be monotonic. Nevertheless, an improvement of our imaging approaches to reveal RyR clusters with clear single-receptor resolution and a fully quantitative approach with the ability to count markers precisely and accurately would further increase the utility and insight that can be obtained in structure–function studies of cardiac Ca2+ signalling.
We have identified two different ways in which JPH2 appears to regulate Ca2+ release through RyRs. One effect is that of cluster size, where biophysical modelling has suggested that the details of cluster size and shape directly affect the ease with which release from a RyR cluster might be triggered (Walker et al., 2015). In addition, there is evidence for a more direct influence of JPH2 on RyRs in which JPH2 associates with RyRs and causes a right-shift of the Ca2+ channel open probability curve, effectively stabilising the closed state. A point mutation identified in JPH2 (E169K) was found to increase spontaneous Ca2+ spark rates in cardiomyocytes and was associated with reduced co-immunoprecipitation of JPH2 and RyR, indicating that the mutation mediated reduced binding of JPH2 to the RyR channel, resulting in increased open probability (Beavers et al., 2013). Furthermore, increased RyR open probability in JPH2-KD mice (Van Oort et al., 2011) was stabilised by the application of a JPH2-mimicking oligopeptide containing the E169 amino acid site (Beavers et al., 2013), supporting the proposed mechanistic role of JPH2. With these mechanistic observations, the data from JPH2-OE mice suggest that the two opposing ways in which JPH2 modifies RyR Ca2+ release might homeostatically cancel each other in overexpression; a certain minimal amount of JPH2 is required to stabilise the Ca2+ release system – which might be related to the important role that JPH2 plays in maintaining the architecture of the t-system. In any case, the new methods and quantitative in situ imaging with near molecular resolution should allow probing such intermolecular mechanisms in other signalling systems and enable us to test whether molecular regulation of receptor clustering is a mode of regulation widely used in other systems.
MATERIALS AND METHODS
Animals
All animal work was performed in accordance with Baylor College of Medicine Animal Use and Care Committee. Transgenic mouse strains were generated as previously described (Van Oort et al., 2011). In brief, JPH2 knockdown (JPH2-KD) mice were generated by crossing αMHC-MerCreMer (MCM) mice (on a B6129 background) with transgenic mice containing a cloned JPH2-shRNA (shJPH2) sequence (C57BI/6J background). MCM and JPH2-KD mice were administered tamoxifen injections (30 mg/kg body weight, intraperitoneal injection; daily for 5 consecutive days), which induced expression of short hairpin RNA against JPH2 (shJPH2) and subsequent cardiac-specific JPH2 protein knockdown in adult JPH2-KD mice, enabling embryonic lethality to be circumvented. Cardiac-specific JPH2-overexpressing (JPH2-OE) mice were generated by inserting JPH2 mouse cDNA into a αMHC vector between HindIII and NotI restriction enzyme sites (mice on C57BI/6J background). Following linearisation of the vector, it was injected into fertilised C57/BL6 oocyte pronuclei, which were then implanted into pseudo-pregnant recipients (vector kindly provided by Thomas Cooper, Baylor College of Medicine, Houston, TX). Both MCM and age-matched wild-type littermates were used as controls for JPH2-OE transgenic mice, with no functional differences observed between the two controls (Wang et al., 2014). For Ca2+ handling and imaging experiments, all animals were 3–5-month-old males, and due to being specific genotypes, randomisation was not performed for allocating animals into experimental groups. These experiments could not be performed in a blind manner.
Western blotting
Confirmation of the level of JPH2 expression was performed on control and JPH2-OE mouse strains by using western blot analysis (Van Oort et al., 2011), with both male and female animals aged 2–11 months used. Briefly, flash-frozen hearts were homogenised followed by sonication in radio-immunoprecipitation assay lysis buffer (containing 50 mM Tris-HCl pH 7.4, 150 mM NaCl, 10% CHAPS, 20 mM NaF, 1 mM Na3VO4 and 1× protease and phosphatase inhibitor tablets; Roche Diagnositics, Indianapolis) to produce tissue lysates. Following centrifugation to remove cellular debris, 100 µg of total protein was diluted in 2× Laemmli sample buffer (containing 0.5% β-mercaptoethanol; Bio-Rad, Hercules, CA). This was heated to 70°C for 10 min and resolved on a 6–10% gradient SDS polyacrylamide electrophoresis gel before electrotransferring proteins to PVDF membranes at 20 V at 4°C, overnight. Membranes were blocked for 1 h in 5% milk in Tris-buffered saline (milk-TBS) followed by primary antibody incubation (suspended in milk-TBS) for 4 h at room temperature, or overnight at 4°C. Primary antibodies used were custom polyclonal rabbit anti-JPH2 [1:1000; as previously detailed (Van Oort et al., 2011)], monoclonal mouse anti-GAPDH (1:10,000, MAB374, Millipore), anti-NCX1 (1:1000, R3F1, Swant) or anti-RyR2 (1:5000, MA3916, Thermo). Alexa-Fluor-680-conjugated anti-mouse-IgG (Invitrogen) or IRDye800-conjugated anti-rabbit-IgG (Rockland Immunochemicals, Gilbertsville, PA) secondary antibodies diluted 1:10,000 were used, and were incubated with samples for 1 h at room temperature. Blots were scanned using an Odyssey infrared scanner (Li-Cor, Lincoln, NE) with integrated densities of protein bands measured using ImageJ (NIH, Bethesda, MD). Corresponding GAPDH signal densities were used to normalise the protein signal densities.
Cardiomyocyte isolation, preparation and Ca2+ analysis
Enzymatic isolation of ventricular cardiomyocytes from adult mice was performed as previously described (Van Oort et al., 2011). Briefly, this involved quick excision of the heart following anaesthetisation of the animal, and rinsing in Ca2+-free Tyrode's solution (in mM: 137 NaCl, 5.4 KCl, 1 MgCl2, 5 HEPES, 10 glucose, 3 NaOH; pH 7.4). Cannulation was achieved through the aorta onto a retrograde Langendorf system with perfusion of Ca2+-free Tyrode's solution for 3–5 min, followed by Tyode's solution containing 20 µg/ml Liberase (Roche Applied Science) for 10–15 min, all at 37°C. Following enzymatic digestion, the heart was rinsed in KB buffer (in mM: 90 KCl, 30 K2HPO4, 5 MgSO4, 5 pyruvic acid, 5 β-hydroxybutyric acid, 5 creatine, 20 taurine, 10 glucose, 0.5 EGTA, 5 HEPES; pH 7.2) to rinse off enzyme. The ventricles were then minced in KB buffer, gently agitated and filtered through a 210 µm polyethylene mesh. After settling, the myocytes were washed once with KB buffer, and stored at room temperature until use.
Myocardium sections were also used for immunolabelling experiments. These were obtained by quick excision of hearts from the anaesthetised animals, followed by perfusion with 2% paraformaldehyde (PFA) for 10 min at room temperature. The whole hearts were then rinsed, and ventricles selectively dissected and frozen in O.C.T Tissue Tek™. Frozen sections (8-µm thick), typically oriented so that myocytes were sectioned transversely, were then cut using a Leica CM 3050 cryostat and collected onto pre-cleaned coverslips coated with 0.05% poly-L-lysine (Sigma).
For Ca2+ imaging experiments, isolated ventricular myocytes were incubated with 2 µM Fluo-4-acetoxymethyl ester (Fluo-4-AM, Life Technologies) in 1.8 mM Ca2+ Tyrode's solution for 60 min at room temperature before being washed in dye-free 1.8 mM Ca2+ Tyrode's solution for 15 min de-esterification. Fluo-4-AM-loaded isolated cardiomyocytes were transferred to a chamber equipped with a pair of parallel platinum electrodes on a Zeiss LSM 510 laser scanning confocal microscope with a 40× oil immersion objective. 488-nm excitation was used, with a 515-nm long pass filter for emission collection, and line-scan mode images were collected with 1024 pixels per line at 500 Hz. Following 1 Hz pacing for 2 min, cardiomyocytes with defined striations and normal contractility were exclusively selected for experiments. Pacing was paused for 30 s after steady-state Ca2+ transients were established to record Ca2+ sparks. The ImageJ (NIH) SparkMaster plugin was used to analyse Ca2+ spark parameters (Picht et al., 2007). Parameters analysed included spark frequency and size (full-width at half-maximal amplitude; FWHM) as well as Ca2+ transient amplitude and SR Ca2+ load. The Ca2+ spark event detection threshold was 3.8 times the standard deviation of the background noise over the mean value of the background. After pacing, SR Ca2+ content was estimated by rapid application of 10 mM caffeine.
Immunostaining and imaging
Freshly isolated cardiomyocytes were fixed for 10 min with 2% PFA along with myocardium cryosections (prepared as detailed above) for immunolabelling experiments. RyR distributions were investigated using single-molecule super-resolution microscopy (SMLM), based on previously described methods (Jayasinghe et al., 2009; Hou et al., 2015). In brief, dual labelling was performed using rabbit anti-JPH2 (Life Technologies; 40-5300; 1:50) or anti-RyR2 (Sigma; HPA016697; 1:50) primary antibodies in combination with mouse anti-RyR2 (Thermo; ma3-916; 1:100), anti-NCX1 (Swant, R3F1; 1:200), anti-α-actinin (Sigma, A7811; 1:200) or anti-caveolin-3 (BD Bioscience, 610421; 1:200) primary antibodies. T-tubule labelling was achieved by combining anti-NCX1 and anti-caveolin-3 mouse-raised primary antibodies, as established previously (Hou et al., 2015; Jayasinghe et al., 2015). Cells were permeabilised with 1% Triton-X100 (Sigma) for 10 min at room temperature, followed by blocking with 10% normal goat serum (Life Technologies) in PBS (isolated myocytes) or Image-iT Signal Enhancer (myocardium sections; Life Technologies) for 1 h at room temperature. Primary antibodies were applied overnight at 4°C, followed by incubation with highly cross-adsorbed goat-raised species-specific antibodies, with one species-specific secondary conjugated to each of Alexa Fluor 680 and 750 for super-resolution imaging, or Alexa Fluor 488 and 594 for confocal imaging. All secondary antibodies were purchased from Life Technologies and were incubated for 2 h at room temperature (1:200 dilution). Cells for confocal imaging were suspended in ProLong Gold (Life Technologies) whereas cells for super-resolution imaging were suspended in photoswitching buffer containing 90% (v/v) glycerol, 10% (v/v) PBS, 10% (w/v) glucose, 5 mM cysteamine (Sigma), 0.5 mg/ml glucose oxidase and 50 μg/ml catalase to induce dye switching (Van De Linde et al., 2008). The suspended cells were mounted onto a clean no. 1.5 glass coverslip and slide.
Confocal imaging of t-tubule labelled samples was performed on an inverted Zeiss LSM 710 laser scanning confocal microscope using a 63× oil immersion 1.4 NA Zeiss objective and excited with a 561-nm laser. Point-spread function information was acquired from the system by imaging sub-diffraction beads to enable accurate deconvolution of image stacks to be performed using an implementation of the Richardson–Lucy algorithm (Soeller and Cannell, 1999), coded in PYME (The Python Microscopy Environment, available at https://bitbucket.org/david_baddeley/python-microscopy).
Details of the super-resolution imaging system used in this study have been previously described (Baddeley et al., 2011; Jayasinghe et al., 2012). In brief, a Nikon TE2000 inverted microscope was used with a 63× oil immersion 1.49 NA Nikon objective, a custom objective holder and image splitter to allow for the simultaneous detection of the two colour channels on a single EMCCD camera. The samples were excited using a 671-nm laser source at a highly inclined angle to enable recording of single-molecule event data from both fluorophores simultaneously. Assignment of events into either channel was on the basis of the intensity ratio from the two channels, as previously described (Baddeley et al., 2011). Each image was acquired as a series of ∼25,000 raw frames, at 50 ms/frame, which were then rendered into a greyscale 5×5 nm/pixel 16-bit TIFF image whose local pixel intensity is linearly proportional to the local event density (Baddeley et al., 2010). Image acquisition, event localisation and greyscale rendering were performed using custom-written Python Microscopy Environment software (https://bitbucket.org/david_baddeley/python-microscopy).
Image analysis
Cells were selected for imaging based on the appearance of clear striations and adequate contrast of labelling. Images were selected for analysis based on the ability to acquire the ∼25,000 frames required for a sufficient number localisation data points to be determined to enable super resolution accuracy, in the absence of temporal drift.
RyR cluster analysis
The number of RyR channels within each cluster was calculated assuming an isotropic 30-nm centre-to-centre receptor packing density similar to the approach described in Hou et al. (2015). In brief, a binary mask capturing the regions of RyR labelling was constructed from rendered dSTORM data [using the triangulation methods described in Baddeley et al. (2010)] by adopting an intensity threshold calculated such that 80% of the integrated image intensity was included within the mask, as established previously (Hou et al., 2015). The two-dimensional area of labelled regions containing one or more receptors was analysed to calculate the size of the local RyR cluster or ‘macro-cluster’ (clusters whose two-dimensional area exceeded 0.2 µm2). The density of clusters in each cell was calculated by dividing the sum of clusters by the cell area analysed. As discussed in Hou et al. (2015), the analysis was essentially two-dimensional in nature but should give a reasonable estimate, which can be further improved in future once a suitable correction factor can be estimated with new imaging approaches. The Euclidean distance from the edge of each RyR cluster was calculated to determine the nearest neighbour distance and the grouping of RyR ‘super-clusters’ as detailed previously (Hou et al., 2015).
Colocalisation analysis
Colocalisation analysis was performed as previously described (Hou et al., 2015; Jayasinghe et al., 2012). Briefly, binary masks of each label distribution were generated as described in the RyR cluster analysis protocol. Distance transform analysis was performed whereby the amount of labelling in channel 1 at a given distance from the mask of channel 2 was calculated. The fractions of total labelling in channel 2 were determined as a function of distance from the edge of each binary mask in channel 1 (see also Fig. S1 of Jayasinghe et al., 2012). A single colocalisation value, when given, was calculated as being the fraction of labelling from one channel within the other channels mask. This is very similar to the well-known Manders coefficients (Hou et al., 2014).
Event density analysis
Event density analysis was performed on the super resolution images whereby the number of detected single-molecule events (as described above) was normalised to the imaging region of interest (ROI). Only images acquired within the same day of imaging, using the same photoswitching buffer at a similar imaging depth and exhibiting similar blinking rates rate were considered for analysis. Point data of localised events from the initial 20,000 frames in each of the data series were sub-sampled before calculating either the whole-cell event density (capturing the whole cross-sectional area of the cell) or junctional event density (events localised within the two-dimensional area delineated by the RyR cluster mask). We have previously shown that the event density is directly proportional to an independent measure of the number of receptors by the area method (Baddeley et al., 2009; Zinchuk et al., 2007), and have demonstrated its robustness in reporting varying RyR densities in muscle tissues that had been previously verified with independent biochemical and functional assays (Jayasinghe et al., 2014).
Analysis of T-tubule morphologies
T-tubule regularity was determined as a measure of strength of t-tubule labelling regularity (denoted the TT-power) from fast Fourier transform (FFT) analysis of deconvolved t-tubule-labelled confocal images (Crossman et al., 2015). This involved using a single representative image that was rotated to align the longitudinal axis of the cell in the vertical direction, followed by selective exclusion of the surface sarcolemma labelling. FFT analysis was then performed using custom-written scripts in IDL software (Exelis Inc.) to produce a power spectrum (available from the corresponding author on request). The amplitude of the peak in the resulting spectrum was estimated by fitting a Gaussian curve, and used as the TT-power. T-tubule angle analysis was performed using custom routines in the publically available PYME software package on deconvolved 3D confocal image stacks that were projected over a 0.6 µm axial depth and then skeletonised. Skeletonised images were analysed and colour-coded according to the local angle of the t-tubule skeleton relative to vertical direction (0°), which is aligned with the longitudinal axis of the cardiomyocyte. The fraction of t-tubules occurring at each angle between 0–180° was determined and grouped into bins representing 9°, which were then normalised to angles between 0–90°, to give 10 bins representing 9° each; i.e. 81–90° grouped with angles of 90–99° into a single bin. A distribution histogram was then produced of the fraction of t-tubules occurring at each of the 10 normalised angle bins. Fractions occurring in the 0–9° and 9–18° were grouped into a single ‘longitudinal’ bin, whereas the 72–81° and 81–90° bins were grouped together to make a ‘transverse’ bin for comparison across the three genotypes.
Statistical analysis
Results are presented as mean±s.e.m. Student's t-test was used for statistical analysis of the Ca2+ spark and transient data, whereas the Mann–Whitney U-test (two groups) or Kruskal–Wallis k-test (three groups) was used for image statistical analysis. Two-sided tests were performed, with a P<0.05 considered to be statistically significant. Sample size (n-values) and P values are indicated in the figures and/or figure legends as well as results tables. Slopes of the JPH–RyR junctional events relationship were determined with the Linear Model Fitting tools in R (using the lm function) to fit a linear relationship with slope and offset. Comparison of slopes from the returned parameters and statistics were performed according to Eqn 4 in Paternoster et al. (1998) to obtain a Z-score and the probability of the null hypothesis was determined by looking up the corresponding probability from the Z statistic. Based on previous work, we predicted an expected effect size of 0.6. Using this value, it was calculated that to obtain statistical power of 0.8, ten observations per group would be required. The actual number of observations for each analysis generally surpassed this calculated number due to allowing for potential post-hoc exclusion of observations, based on criteria described above.
Footnotes
Competing interests
X.H.T.W. is a founder and equity holder in Elex Biotech Llc.
Author contributions
Conceived and designed the experiments: M.L.M., X.H.T.W., C.S.; performed the experiments: M.L.M., A.Q., W.W., Q.W.; analysed the data: M.L.M., I.D.J., A.Q., C.S., W.W.; contributed software and/or materials D.B., X.H.T.W., C.S.; wrote the paper: M.L.M., I.D.J., C.S.
Funding
This work was supported by Health Research Council of New Zealand (HRC.govt.nz) (12/240) and a Human Frontier Science Programme award to C.S. (RGP0027/2013). It was also supported by the American Heart Association (14PRE20490083 to A.Q., 13EIA14560061 to X.H.T.W.), the National Institutes of Health (R01-HL089598, R01-HL091947, R01-HL117641, R41-HL129570 to X.H.T.W.) and the UK Royal Society (RG.IMSB.107729 to I.D.J.). Deposited in PMC for release after 12 months.
Supplementary information
Supplementary information available online at http://jcs.biologists.org/lookup/doi/10.1242/jcs.196873.supplemental
References
- Asghari P., Scriven D. R. L., Sanatani S., Gandhi S. K., Campbell A. I. M. and Moore E. D. W. (2014). Nonuniform and variable arrangements of ryanodine receptors within mammalian ventricular couplons. Circ. Res. 115, 252-262. 10.1161/CIRCRESAHA.115.303897 [DOI] [PubMed] [Google Scholar]
- Baddeley D., Jayasinghe I. D., Lam L., Rossberger S., Cannell M. B. and Soeller C. (2009). Optical single-channel resolution imaging of the ryanodine receptor distribution in rat cardiac myocytes. Proc. Natl. Acad. Sci. USA 106, 22275-22280. 10.1073/pnas.0908971106 [DOI] [PMC free article] [PubMed] [Google Scholar]
- Baddeley D., Cannell M. B. and Soeller C. (2010). Visualization of localization microscopy data. Microsc. Microanal. 16, 64-72. 10.1017/S143192760999122X [DOI] [PubMed] [Google Scholar]
- Baddeley D., Crossman D., Rossberger S., Cheyne J. E., Montgomery J. M., Jayasinghe I. D., Cremer C., Cannell M. B. and Soeller C. (2011). 4D super-resolution microscopy with conventional fluorophores and single wavelength excitation in optically thick cells and tissues. PLoS ONE 6, e20645 10.1371/journal.pone.0020645 [DOI] [PMC free article] [PubMed] [Google Scholar]
- Beavers D. L., Wang W., Ather S., Voigt N., Garbino A., Dixit S. S., Landstrom A. P., Li N., Wang Q., Olivotto I. et al. (2013). Mutation E169K in Junctophilin-2 Causes Atrial Fibrillation Due to Impaired RyR2 Stabilization. J. Am. Coll. Cardiol. 62, 2010-2019. 10.1016/j.jacc.2013.06.052 [DOI] [PMC free article] [PubMed] [Google Scholar]
- Bers D. M. (2002). Cardiac excitation-contraction coupling. Nature 415, 198-205. 10.1038/415198a [DOI] [PubMed] [Google Scholar]
- Brette F. and Orchard C. (2003). T-tubule function in mammalian cardiac myocytes. Circ. Res. 92, 1182-1192. 10.1161/01.RES.0000074908.17214.FD [DOI] [PubMed] [Google Scholar]
- Cabra V., Murayama T. and Samsó M. (2016). Ultrastructural analysis of self-associated RyR2s. Biophys. J. 110, 2651-2662. 10.1016/j.bpj.2016.05.013 [DOI] [PMC free article] [PubMed] [Google Scholar]
- Chen B., Guo A., Zhang C., Chen R., Zhu Y., Hong J., Kutschke W., Zimmerman K., Weiss R. M., Zingman L. et al. (2013). Critical roles of junctophilin-2 in T-tubule and excitation-contraction coupling maturation during postnatal development. Cardiovasc. Res. 100, 54-62. 10.1093/cvr/cvt180 [DOI] [PMC free article] [PubMed] [Google Scholar]
- Cheng H., Lederer W. J. and Cannell M. B. (1993). Calcium sparks: elementary events underlying excitation-contraction coupling in heart muscle. Science 262, 740-744. 10.1126/science.8235594 [DOI] [PubMed] [Google Scholar]
- Crossman D. J., Ruygrok P. R., Soeller C. and Cannell M. B. (2011). Changes in the organization of excitation-contraction coupling structures in failing human heart. PLoS ONE 6, e17901 10.1371/journal.pone.0017901 [DOI] [PMC free article] [PubMed] [Google Scholar]
- Crossman D. J., Young A. A., Ruygrok P. N., Nason G. P., Baddelely D., Soeller C. and Cannell M. B. (2015). t-tubule disease: relationship between t-tubule organization and regional contractile performance in human dilated cardiomyopathy. J. Mol. Cell. Cardiol. 84, 170-178. 10.1016/j.yjmcc.2015.04.022 [DOI] [PMC free article] [PubMed] [Google Scholar]
- Durisic N., Cuervo L. L. and Lakadamyali M. (2014). Quantitative super-resolution microscopy: pitfalls and strategies for image analysis. Curr. Opin. Chem. Biol. 20, 22-28. 10.1016/j.cbpa.2014.04.005 [DOI] [PubMed] [Google Scholar]
- Guo A., Zhang X., Iyer V. R., Chen B., Zhang C., Kutschke W. J., Weiss R. M., Franzini-Armstrong C. and Song L.-S. (2014). Overexpression of junctophilin-2 does not enhance baseline function but attenuates heart failure development after cardiac stress. Proc. Natl. Acad. Sci. USA 111, 12240-12245. 10.1073/pnas.1412729111 [DOI] [PMC free article] [PubMed] [Google Scholar]
- Hou Y., Crossman D. J., Rajagopal V., Baddeley D., Jayasinghe I. and Soeller C. (2014). Super-resolution fluorescence imaging to study cardiac biophysics: alpha-actinin distribution and Z-disk topologies in optically thick cardiac tissue slices. Prog. Biophys. Mol. Biol. 115, 328-339. 10.1016/j.pbiomolbio.2014.07.003 [DOI] [PubMed] [Google Scholar]
- Hou Y., Jayasinghe I., Crossman D. J., Baddeley D. and Soeller C. (2015). Nanoscale analysis of ryanodine receptor clusters in dyadic couplings of rat cardiac myocytes. J. Mol. Cell. Cardiol. 80, 45-55. 10.1016/j.yjmcc.2014.12.013 [DOI] [PubMed] [Google Scholar]
- Jayasinghe I. D., Cannell M. B. and Soeller C. (2009). Organization of ryanodine receptors, transverse tubules, and sodium-calcium exchanger in rat myocytes. Biophys. J. 97, 2664-2673. 10.1016/j.bpj.2009.08.036 [DOI] [PMC free article] [PubMed] [Google Scholar]
- Jayasinghe I. D., Baddeley D., Kong C. H. T., Wehrens X. H. T., Cannell M. B. and Soeller C. (2012). Nanoscale organization of junctophilin-2 and ryanodine receptors within peripheral couplings of rat ventricular cardiomyocytes. Biophys. J. 102, L19-L21. 10.1016/j.bpj.2012.01.034 [DOI] [PMC free article] [PubMed] [Google Scholar]
- Jayasinghe I. D., Munro M., Baddeley D., Launikonis B. S. and Soeller C. (2014). Observation of the molecular organization of calcium release sites in fast- and slow-twitch skeletal muscle with nanoscale imaging. J. R. Soc. Interface 11, 20140570 10.1098/rsif.2014.0570 [DOI] [PMC free article] [PubMed] [Google Scholar]
- Jayasinghe I. D., Clowsley A. H., Munro M., Hou Y., Crossman D. J. and Soeller C. (2015). Revealing t-tubules in striated muscle with new optical super-resolution microscopy techniques. Eur. J. Transl. Myology 25, 15-26. 10.4081/ejtm.2015.4747 [DOI] [PMC free article] [PubMed] [Google Scholar]
- Kong C. H. T., Laver D. R. and Cannell M. B. (2013). Extraction of sub-microscopic Ca fluxes from blurred and noisy fluorescent indicator images with a detailed model fitting approach. PLoS Comput. Biol. 9, e1002931 10.1371/journal.pcbi.1002931 [DOI] [PMC free article] [PubMed] [Google Scholar]
- Landstrom A. P., Kellen C. A., Dixit S. S., Van Oort R. J., Garbino A., Weisleder N., Ma J., Wehrens X. H. T. and Ackerman M. J. (2011). Junctophilin-2 expression silencing causes cardiocyte hypertrophy and abnormal intracellular calcium-handling. Circ. Heart Fail. 4, 214-223. 10.1161/CIRCHEARTFAILURE.110.958694 [DOI] [PMC free article] [PubMed] [Google Scholar]
- Lyon A. R., Macleod K. T., Zhang Y., Garcia E., Kanda G. K., Lab M. J., Korchev Y. E., Harding S. E. and Gorelik J. (2009). Loss of T-tubules and other changes to surface topography in ventricular myocytes from failing human and rat heart. Proc. Natl. Acad. Sci. USA 106, 6854-6859. 10.1073/pnas.0809777106 [DOI] [PMC free article] [PubMed] [Google Scholar]
- Marx S. O., Gaburjakova J., Gaburjakova M., Henrikson C., Ondrias K. and Marks A. R. (2001). Coupled gating between cardiac calcium release channels (Ryanodine Receptors). Circ. Res. 88, 1151-1158. 10.1161/hh1101.091268 [DOI] [PubMed] [Google Scholar]
- Mccall E., Li L., Satoh H., Shannon T. R., Blatter L. A. and Bers D. M. (1996). Effects of FK-506 on contraction and Ca2+ transients in rat cardiac myocytes. Circ. Res. 79, 1110-1121. 10.1161/01.RES.79.6.1110 [DOI] [PubMed] [Google Scholar]
- Minamisawa S., Oshikawa J., Takeshima H., Hoshijima M., Wang Y., Chien K. R., Ishikawa Y. and Matsuoka R. (2004). Junctophilin type 2 is associated with caveolin-3 and is down-regulated in the hypertrophic and dilated cardiomyopathies. Biochem. Biophys. Res. Commun. 325, 852-856. 10.1016/j.bbrc.2004.10.107 [DOI] [PubMed] [Google Scholar]
- Paternoster R., Brame R., Mazerolle P. and Piquero A. (1998). Using the correct statistical test for the equality of regression coefficients. Criminology 36, 859-866. 10.1111/j.1745-9125.1998.tb01268.x [DOI] [Google Scholar]
- Picht E., Zima A. V., Blatter L. A. and Bers D. M. (2007). SparkMaster: automated calcium spark analysis with ImageJ. Am. J. Physiol. Cell Physiol. 293, C1073-C1081. 10.1152/ajpcell.00586.2006 [DOI] [PubMed] [Google Scholar]
- Reynolds J. O., Chiang D. Y., Wang W., Beavers D. L., Dixit S. S., Skapura D. G., Landstrom A. P., Song L.-S., Ackerman M. J. and Wehrens X. H. T. (2013). Junctophilin-2 is necessary for T-tubule maturation during mouse heart development. Cardiovasc. Res. 100, 44-53. 10.1093/cvr/cvt133 [DOI] [PMC free article] [PubMed] [Google Scholar]
- Sobie E. A., Guatimosim S., Gomez-Viquez L., Song L.-S., Hartmann H., Saleet Jafri M. and Lederer W. J. (2006). The Ca 2+ leak paradox and “rogue ryanodine receptors”: SR Ca 2+ efflux theory and practice. Prog. Biophys. Mol. Biol. 90, 172-185. 10.1016/j.pbiomolbio.2005.06.010 [DOI] [PMC free article] [PubMed] [Google Scholar]
- Soeller C. and Cannell M. B. (1999). Examination of the transverse tubular system in living cardiac rat myocytes by 2-photon microscopy and digital image-processing techniques. Circ. Res. 84, 266-275. 10.1161/01.RES.84.3.266 [DOI] [PubMed] [Google Scholar]
- Song L.-S., Sobie E. A., Mcculle S., Lederer W. J., Balke C. W. and Cheng H. (2006). Orphaned ryanodine receptors in the failing heart. Proc. Natl. Acad. Sci. USA 103, 4305-4310. 10.1073/pnas.0509324103 [DOI] [PMC free article] [PubMed] [Google Scholar]
- Stern M. D., Rios E. and Maltsev V. A. (2013). Life and death of a cardiac calcium spark. J. Gen. Physiol. 142, 257-274. 10.1085/jgp.201311034 [DOI] [PMC free article] [PubMed] [Google Scholar]
- Takeshima H., Komazaki S., Nishi M., Iino M. and Kangawa K. (2000). Junctophilins: a novel family of junctional membrane complex proteins. Mol. Cell 6, 11-22. 10.1016/s1097-2765(05)00005-5 [DOI] [PubMed] [Google Scholar]
- Van De Linde S., Kasper R., Heilemann M. and Sauer M. (2008). Photoswitching microscopy with standard fluorophores. Appl. Phys. B Lasers Optics, 93, 725-731. 10.1007/s00340-008-3250-9 [DOI] [Google Scholar]
- Van Oort R. J., Garbino A., Wang W., Dixit S. S., Landstrom A. P., Gaur N., De Almeida A. C., Skapura D. G., Rudy Y., Burns A. R. et al. (2011). Disrupted junctional membrane complexes and hyperactive ryanodine receptors after acute junctophilin knockdown in mice. Circulation 123, 979-988. 10.1161/CIRCULATIONAHA.110.006437 [DOI] [PMC free article] [PubMed] [Google Scholar]
- Wagner E., Lauterbach M. A., Kohl T., Westphal V., Williams G. S. B., Steinbrecher J. H., Streich J.-H., Korff B., Tuan H.-T. M., Hagen B. et al. (2012). Stimulated emission depletion live-cell super-resolution imaging shows proliferative remodeling of T-tubule membrane structures after myocardial infarction. Circ. Res. 111, 402-414. 10.1161/CIRCRESAHA.112.274530 [DOI] [PMC free article] [PubMed] [Google Scholar]
- Walker M. A., Kohl T., Lehnart S. E., Greenstein J. L., Lederer W. J. and Winslow R. L. (2015). On the adjacency matrix of RyR2 cluster structures. PLoS Comput. Biol. 11, e1004521 10.1371/journal.pcbi.1004521 [DOI] [PMC free article] [PubMed] [Google Scholar]
- Wang W., Landstrom A. P., Wang Q., Munro M. L., Beavers D., Ackerman M. J., Soeller C. and Wehrens X. H. T. (2014). Reduced junctional Na+/Ca2+-exchanger activity contributes to sarcoplasmic reticulum Ca2+ leak in junctophilin-2-deficient mice. Am. J. Physiol. Heart Circ. Physiol. 307, H1317-H1326. 10.1152/ajpheart.00413.2014 [DOI] [PMC free article] [PubMed] [Google Scholar]
- Wei S., Guo A., Chen B., Kutschke W., Xie Y.-P., Zimmerman K., Weiss R. M., Anderson M. E., Cheng H. and Song L.-S. (2010). T-tubule remodeling during transition from hypertrophy to heart failure. Circ. Res. 107, 520-531. 10.1161/CIRCRESAHA.109.212324 [DOI] [PMC free article] [PubMed] [Google Scholar]
- Wong J., Baddeley D., Bushong E. A., Yu Z., Ellisman M. H., Hoshijima M. and Soeller C. (2013). Nanoscale distribution of ryanodine receptors and caveolin-3 in mouse ventricular myocytes: dilation of T-tubules near junctions. Biophys. J. 104, L22-L24. 10.1016/j.bpj.2013.02.059 [DOI] [PMC free article] [PubMed] [Google Scholar]
- Woo J. S., Hwang J.-H., Ko J.-K., Weisleder N., Kim D. H., Ma J. and Lee E. H. (2010). S165F mutation of junctophilin 2 affects Ca2+ signalling in skeletal muscle. Biochem. J. 427, 125-134. 10.1042/BJ20091225 [DOI] [PubMed] [Google Scholar]
- Woo J. S., Srikanth S., Nishi M., Ping P., Takeshima H. and Gwack Y. (2016). Junctophilin-4, a component of the endoplasmic reticulum-plasma membrane junctions, regulates Ca2+ dynamics in T cells. Proc. Natl. Acad. Sci. USA 113, 2762-2767. 10.1073/pnas.1524229113 [DOI] [PMC free article] [PubMed] [Google Scholar]
- Wu H.-D., Xu M., Li R.-C., Guo L., Lai Y.-S., Xu S.-M., Li S.-F., Lü Q.-L., Li L.-L., Zhang H.-B. et al. (2012). Ultrastructural remodelling of Ca2+ signalling apparatus in failing heart cells. Cardiovasc. Res. 95, 430-438. 10.1093/cvr/cvs195 [DOI] [PMC free article] [PubMed] [Google Scholar]
- Wu C. Y., Chen B., Jiang Y. P., Jia Z., Martin D. W., Liu S., Entcheva E., Song L. S. and Lin R. Z. (2014). Calpain-dependent cleavage of junctophilin-2 and T-tubule remodeling in a mouse model of reversible heart failure. J. Am. Heart Assoc. 3, e000527 10.1161/JAHA.113.000527 [DOI] [PMC free article] [PubMed] [Google Scholar]
- Xu M., Zhou P., Xu S. M., Liu Y., Feng X., Bai S. H., Bai Y., Hao X. M., Han Q., Zhang Y. et al. (2007). Intermolecular failure of L-type Ca2+ channel and ryanodine receptor signaling in hypertrophy. PLoS Biol. 5, 0203-0211. 10.1371/journal.pbio.0050021 [DOI] [PMC free article] [PubMed] [Google Scholar]
- Yano M., Ono K., Ohkusa T., Suetsugu M., Kohno M., Hisaoka T., Kobayashi S., Hisamatsu Y., Yamamoto T., Kohno M. et al. (2000). Altered stoichiometry of FKBP12.6 versus ryanodine receptor as a cause of abnormal Ca2+ leak through ryanodine receptor in heart failure. Circulation 102, 2131-2136. 10.1161/01.CIR.102.17.2131 [DOI] [PubMed] [Google Scholar]
- Yin C.-C., Blayney L. M. and Anthony Lai F. (2005). Physical coupling between ryanodine receptor–calcium release channels. J. Mol. Biol. 349, 538-546. 10.1016/j.jmb.2005.04.002 [DOI] [PubMed] [Google Scholar]
- Zinchuk V., Zinchuk O. and Okada T. (2007). Quantitative colocalization analysis of multicolor confocal immunofluorescence microscopy images: pushing pixels to explore biological phenomena. Acta Histochem. Cytochem. 40, 101-111. 10.1267/ahc.07002 [DOI] [PMC free article] [PubMed] [Google Scholar]