Abstract
Purpose:
The aim of this study was to compare the accuracy of magnetic resonance imaging (MRI) for the prediction of response to neo-adjuvant chemotherapy in triple negative (TN) breast cancer, with respect to other subtypes.
Materials and Methods:
There were a total of 1610 breast cancers diagnosed between March 2009 and August 2014, out of which 82 patients underwent MRI before and after neo-adjuvant chemotherapy but just before surgery. TN cancers were analyzed with respect to others subtypes. Accuracy of MRI for prediction of pathological complete response was compared between different subtypes by obtaining receiver operating characteristic (ROC) curves. The Statistical Package for the Social Sciences version 21 was used for all data analysis, with P value of 0.05 as statistically significant.
Results:
Out of 82 patients, 29 were luminal (HR+/HER2−), 23 were TN (HR−, HER2−), 11 were HER2 positive (HR−, HER2+), and 19 were of hybrid subtype (HR+/HER2+). TN cancers presented as masses on the pre-chemotherapy MRI scan, were grade 3 on histopathology, and showed concentric shrinkage following chemotherapy. TN cancers were more likely to have both imaging and pathological complete response following chemotherapy (P = 0.055) in contrast to luminal cancers, which show residual cancer. ROC curves were constructed for the prediction of pathological complete response with MRI. For the TN subgroup, MR had a sensitivity of 0.745 and specificity of 0.700 (P = 0.035), with an area under curve of 0.745 (95% confidence interval: 0.526–0.965), which was significantly better compared to other subtypes.
Conclusion:
TN breast cancers present as masses and show concentric shrinkage following chemotherapy. MRI is most accurate in predicting response to chemotherapy in the TN group, compared to others subtypes. MRI underestimates residual disease in luminal cancers.
Keywords: Breast, chemotherapy, MRI
Introduction
Breast cancer is not a homogenous entity and molecular subtypes behave differently, both in their imaging patterns and clinico-biological behavior.[1,2] Using clinico-pathological factors alone for risk stratification can lead to potential overuse of chemotherapy. While traditional classification of breast cancer offers limited prognostic value,[3] novel molecular characterizations offer predictive categories of disease aggressiveness. Tumour subtypes based on estrogen receptor (ER), progesterone receptor (PR), and human epidermal growth factor receptor 2-(HER2) status is now increasingly used for prognosis and treatment.
Neo-adjuvant chemotherapy (NAC) for treatment for locally advanced breast cancer has been used widely in clinical practice. Moreover, patients with pathological complete response (pCR) have favourable prognosis.[4,5,6] Previous studies have demonstrated that triple negative (TN; all three receptors negative) breast cancer is a distinct entity and behaves differently to other subtypes, especially with respect to attainment of pCR to NAC and imaging presentation on pre-chemotherapy magnetic resonance imaging (MRI).[7,8,9,10,11,12] The purpose of this study was to evaluate the accuracy of MRI for predicting the response to chemotherapy in different subtypes of breast cancer. The radiological and histo-pathological factors that influence the accuracy of MRI in predicting the response to NAC were also evaluated, especially with respect to the grading of cancer, axillary status, and size of the tumour. The strengths and weaknesses of MRI for predicting residual cancer in different subtypes of breast cancer were evaluated, enabling better surgical planning and prediction of prognosis. By combining clinicopathological parameters with genetic properties, more informed decision about the use of neo-adjuvant and adjuvant treatment could be made.
Materials and Methods
Patients and treatment
The University Health Board approved this retrospective study as a service evaluation project (Ref. 8674, Reg. Nov 2014). Requirement of informed consent and ethical approval was waived. Between March 2009 and August 2014, 1610 breast cancer patients were treated in this institution, out of which 89 patients with breast cancer underwent NAC. Inclusion criteria included baseline MRI before the start of the neo-adjuvant treatment and an MRI scan after the completion of NAC, however, just before the surgery. Further inclusion was based on availability of core biopsy prior to the start of NAC to determine the histological diagnosis, hormone receptor status, and HER2 over-expression status, by using immunohistochemical (IHC) staining or fluorescence in situ hybridization (FISH). Patients were subdivided into four groups based on the receptor status, as presented in Table 1.
Table 1.
Intrinsic sub-types of breast cancer

Patients who were not able to have a pre and post-treatment MRI scan or whose receptor status was not available or inadequately described or who did not undergo surgery at our institute were excluded from the analysis. After all exclusions, there were a total of 82 patients, out of which 29 were luminal (HR+/HER−), 23 were TN (HR−, HER−), 11 were HER positive (HR-, HER+), and 19 were Hybrid (HR+/HER+ hybrid).
The therapeutic treatment plan was explained to the patients, following which informed consent was obtained from all patients. The standard protocol was a combination of fluorouracil, cylclophosphamide, and epirubicin (FEC75) for six cycles if nodes were normal, or FEC-T (addition of doxetaxel) for three cycles each if the nodes were involved with cancer. Trastuzumab (Herceptin) was added for 12 weeks if HER2 was over-expressed in breast cancer tissue.
MRI was performed on a 1.5T magnet (GE HDxt 1.5 T, GE Health care, Tokyo, Japan), using an eight-channel phased array breast coil. Imaging was performed with the patient lying in a prone position. Following a three-plane localizer and axial three-dimensional (3D) T1 (high resolution) sequences, multiphase VIBRANT dynamic post-contrast axial 3D T1 fat suppressed high-resolution images were obtained. Axial images were obtained using a spin echo sequence (TR/TE 500/7.6), with a 2 mm slice thickness, matrix 512 × 256, field of view (FOV) 34 cm, and number of excitations (NEX) 1. A dynamic study of both the breasts was obtained after intravenous injection of gadopentetate dimeglumine (0.1 mmol/kg body weight), and fat-suppressed subtracted images were obtained in axial plane approximately every minute for 8 min. A 3D spoiled gradient recalled acquisition in the steady state sequence (TR/TE/TI 6/2.5/18 ms); flip angle 10°, FOV 34 cm, section thickness 2 mm, matrix 512 × 256, and acquisition time 1 min and 5 s was used for post-contrast images. MRI was performed in all the patients both at baseline and following the end of chemotherapy, however, just before surgery.
Radiologic tumour size was based on the largest two dimensions on the baseline axial post-contrast MRI images and post-treatment axial MRI images. Dynamic time intensity curves and diffusion-weighted images (DWI) were performed at the time of imaging interpretation, however, they were not used for measurement of the axial size. All images were read by one of the radiologists (JB) with more than 3 years of reading breast MR, who was blinded to both the receptor status and post-surgical findings. For the purpose of this study, “mass” was defined as a tumour visible in all three planes with a “space occupying effect” and a margin and shape. “Non mass” did not have “space occupying effect” and has a linear, segmental, or regional distribution [Figures 1 and 2]. Presence of two or more foci in the same quadrant was defined as “multifocal” and in different quadrants as “multi-centric.” After treatment with NAC, all patients underwent surgery, either mastectomy or wide local excision (WLE). Surgical specimens were evaluated by an on-site histo-pathologist by cutting into 5 mm slices and staining with hematoxylin and eosin (H and E) for detailed histopathological evaluations. Pathological response following NAC was evaluated by estimating the maximum size of residual disease in two dimensions or by estimating residual tumor gross size and cellularity through the residual cancer burden (RCB) method in some cases.[13] The RCB method may be ideal for estimating the residual tumour size in resected specimens, however, it is not ideal for comparison with radiological tumour size. Therefore, maximum pathological residual tumour size in two dimensions was used in the majority. For the purpose of this study, pCR was defined as absence of invasive malignancy within breast tissues on final pathology.
Figure 1 (A-D).
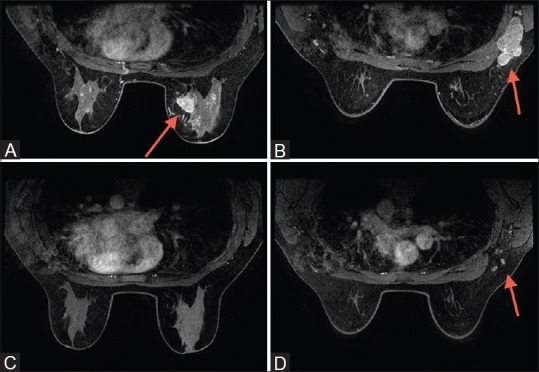
(A) Triple negative cancer presenting as mass within right breast; (B) same patients as in (A), with right axillary lymphadenopathy at the time of presentation. (C) Following neo-adjuvant chemotherapy (NAC), there is complete imaging response of the tumor within the breast; (D) following NAC, right axillary lymph nodes appear normal
Figure 2 (A-D).
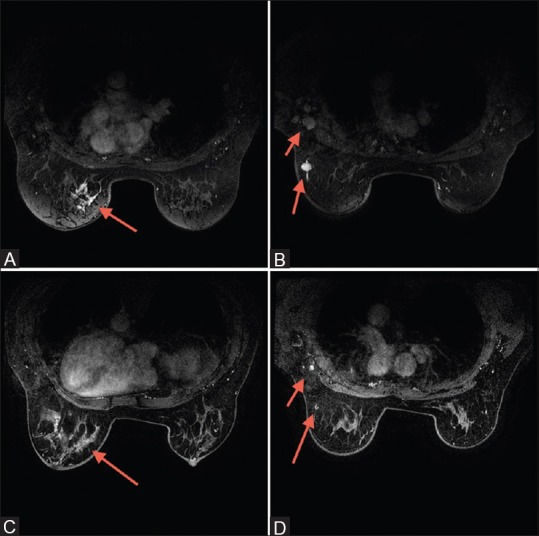
(A) Luminal cancer presenting as non-mass enhancement within the left breast; (B) Same patient as in (2A) showing the left intra-mammary node and left axillary lymphadenopathy at the time of presentation. (C) Following neo-adjuvant chemotherapy (NAC), subtle enhancement persists at the site of known cancer within the left breast; (D) Following NAC, there is partial response of the nodes within the left axilla and of the intramammary lymph node within the left breast
Chi-square test and Mann–Whitney U test was used for comparison of the groups and for comparison of nominal (categorical) variables and non-parametric scale variables, respectively. The Statistical Package for the Social Sciences, version 21 (SPSS Inc, Chicago, IL, USA) was used for all data analysis, with P value of 0.05 considered to be statistically significant. MRI as a predictor of pCR was evaluated with a receiver operating characteristic (ROC) curve in different subgroups. The mean age of our patients were 48.6 years (median: 47 years), ranging 28–70 years.
Results
The mean size of cancer on the initial MRI for the whole group was 53.5 mm (median: 46 mm), ranging 14–113 mm. Overall, there were 63 (76.9%) ductal, 2 (2.6%) lobular, 12 (14.1%) ductolobular, 3 (3.8%) ductal carcinoma in situ (DCIS), and 2 (2.6%) ductal with associated DCIS on the initial core biopsy. Forty-three (53%) were grade 2 and 39 (47%) were grade 3 cancer. Fifty-six (68%) patients presented as mass on the initial MRI and 26 (32%) as non-mass enhancement, with 60 (73.7%) patients showing axillary involvement on presentation. Seventeen (21.1%) patients achieved radiological complete response. Twenty-two patients (26.8%) achieved pCR in our series. The mean difference between post-treatment residual cancer on MRI and post-surgical size was 16 mm (±10.1), ranging 0–80 mm.
TN cancers are more likely to present as a mass on the initial MRI (P = 0.035), whereas non-mass enhancement is more likely to be associated with luminal cancer (P = 0.014) [Figures 1 and 2; Table 2]. TN cancers were more likely to be grade 3 at the time of presentation (P = 0.006). Following NAC, TN cancers are more likely to show concentric shrinkage with no surrounding lesions (P = 0.049), whereas shrinkage with surrounding lesions is more likely with luminal cancer (P = 0.004) [Table 3]. There was no significant difference between the different subtypes with respect to axillary status or initial MRI size at the time of presentation (P = 0.192) [Table 4].
Table 2.
Initial MRI presentation

Table 3.
Type of MRI shrinkage following NAC

Table 4.
Baseline axillary involvement with proven cancer

TN cancers are more likely to have both radiological and pathological complete response following NAC (P = 0.006) [Table 5]. Luminal cancers are more likely to have residual cancer following NAC (P = 0.004), both on imaging and on histology. Mann–Whitney U test was used to calculate significant differences between the subgroups with respect to residual imaging size on MRI and post-surgical invasive size. The difference between post-chemotherapy MR size of residual tumour and post-surgical pathological size was the least for TN cancer, when compared to other subtypes (P = 0.051; 95% confidence interval (CI): 0.047–0.055) [Table 6].
Table 5.
Imaging complete response

Table 6.
Difference between post -NAC MRI size and post- surgical size (mm±SD)(range)

Overall, the correlation between radiological and pathological complete response is demonstrated in Table 7. Nine out of 12 (75%) patients achieving both pathological and radiological complete response were TN cancers. There was no other significant difference among subtypes in the distribution of pathological or radiological complete responses. Figures 3 and 4 illustrate examples of false negative MRI and false positive MRI, respectively. False negative MRI finding was of a hybrid (ER+, HER+) inflammatory breast cancer presenting as a non-mass enhancement on baseline MRI and radiological complete response following treatment but was found to have 77 mm of invasive disease on pathology. False positive patient was a TN cancer that presented as a mass on baseline MRI and non-mass minimal enhancement following treatment, however, it was found to have pCR.
Table 7.
4x4 table of radiological and pathological complete response

Figure 3 (A and B).
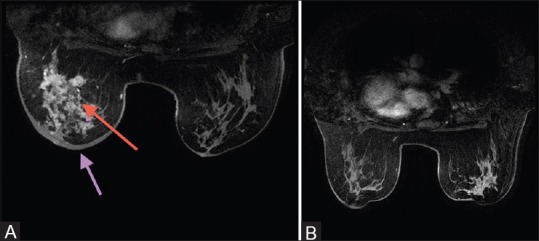
(A) Baseline magnetic resonance imaging (MRI) – inflammatory breast cancer (ER+/HER+); skin thickening (pink arrow); nonmass enhancement (red arrow); (B) posttreatment MRI of the same patient (RCR)
Figure 4 (A and B).
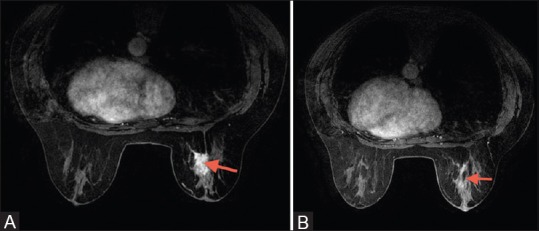
(A) Baseline magnetic resonance imaging (MRI) presenting as a mass in triple negative cancer. (B) Following treatment, there is residual non-mass enhancement
ROC curves were constructed for the prediction of pCR with MRI. At a post-chemotherapy size difference of 5 mm between post-chemotherapy MRI and post-surgical pathology, for the TN group, MRI had a sensitivity of 0.745 and specificity of 0.700 (P = 0.035) for predicting pCR, with an area under curve (AUC) of 0.745 (95% CI: 0.526–0.965). For luminal, HER positive cancers and hybrid cancers, results were not statistically significant (P = 0.908 P = 0.317 and P = 0.230, respectively [Figures 5 and 6]. MRI underestimated the disease by more than 5 mm in 17 out of 29 (58.6%) luminal cancers. Within the TN group, there was overestimation of disease by more than 5 mm in 8 (34.7%) [Figure 4], underestimation in 4 (17.3%), and pathological and radiological sizes were within 5 mm of each other in 11 (47.8%).
Figure 5.
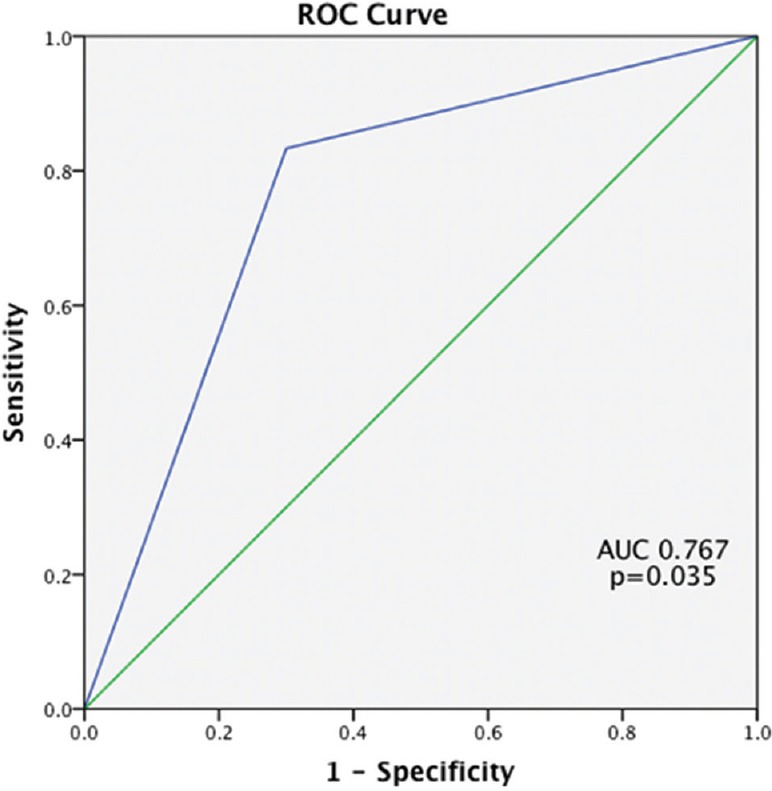
Receiver operating characteristics curve for triple negative breast cancer
Figure 6.
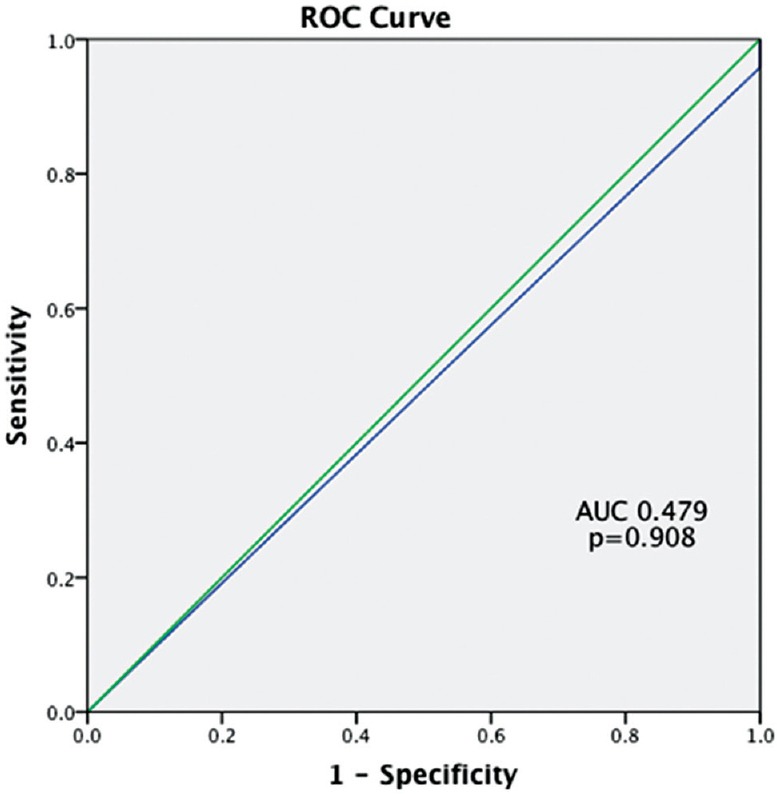
Receiver operating characteristics curve for luminal cancer
Overall, the following were statistically associated with an increased likelihood of pCR: Grade 3 (P = 0.014) and TN cancers (P = 0.055). Luminal cancers were more likely to not have pCR (P = 0.014).
Discussion
“Cancer radio-genomics” is a recently coined term that correlates the imaging features of cancer with its different subtypes. This can be helpful in “personalized” diagnosis, treatment, and prognosis.[14] This field is rapidly expanding with the use of various imaging modalities such as computed tomography (CT), MRI, or positron emission tomography (PET) scan. In addition, breast cancer is a heterogeneous group and can be divided into different subgroups,[15] based on which routine clinical therapeutic plans are formed.
In our study, TN cancers were more likely to present as a mass on baseline MR and were grade 3. Previous studies[16,7,11] have evaluated imaging characteristics of different subtypes, however, few characteristics have been revealed apart from TN cancers.[16] Dent et al.[7] evaluated 1601 women, out of which 180 were TN. They demonstrated that TN cancers were larger at the time of presentation, involved lymph nodes more frequently, and were high-grade tumours. Many studies have demonstrated TN cancers as uni-focal mass on mammography and ultrasound.[8,9,10] Uematsu et al.[11] was the first to describe MR features of TN cancers. He evaluated 59 TN cancers and demonstrated that they are more likely to be uni-focal masses. Absence of non-mass enhancement correlated with the absence/rarity of DCIS with TN cancers.[11] This is similar to our study where non-mass enhancement was more likely to be associated with luminal cancers, in keeping with higher incidence of DCIS associated with them. We did not find any difference in the lymph node positivity or initial MR size between different subtypes.
NAC is increasingly being offered to women with breast cancers because it offers an opportunity of tumour shrinkage and breast conserving surgery. Previous investigators have demonstrated that the accuracy of MR varies with different subtypes of breast cancer. For the purpose of this study, we defined pCR as the absence of invasive malignancy in the breast tissues, without consideration of the axillary involvement. We wanted to focus on the NAC response of the breast tissue, with respect to different subtypes of breast cancer. Moreover, previous studies have shown that TN cancers do not show a linear correlation between tumour size and likelihood of lymph node involvement.[17] Some authors even demonstrated a propensity for node negative but direct systemic progression in the TN group.[18] We have ignored the presence of DCIS in the surgical specimen for the definition of pCR because there is no evidence that residual in situ carcinoma alone increases risk of future distant relapse.[19]
While the definition of pCR varies in different studies, investigators have shown that accuracy of MRI for predicting pCR varies with different subtypes.[4,5,6,20] Loo et al.[4] demonstrated residual disease in 93% luminal cancers compared to 66% TN cancers. In their study, TN cancers had a typical concentric shrinkage pattern following NAC, which is similar to our study. Authors also found excellent correlation between residual tumour size on MRI and post-treatment surgical size for TN and HER+ subtypes, however, not for luminal cancers. However, MRI was performed during the NAC treatment not after the completion of chemotherapy in their study. Heterogeneous appearance of luminal cancer on MRI and areas of non-mass enhancement with low rate of pCR contributed to these findings, which is similar to our study. We did not find a good response in HER+ subgroup in our study. This may be due to a small number of HER+ cancers in our group. Similar result was demonstrated by De Los Santos,[20] who evaluated 475 luminal cancers, 150 TN cancers, and 101 HER+ cancers. They found the highest negative predictive value (the ability to predict pCR) with TN and HER cancers. Hayashi et al.[5] evaluated 264 breast cancers and found the highest discrepancy between imaging and pathology for luminal cancers and cautioned when interpreting MR images in luminal cancers, with underestimation of the disease in two-thirds of them. In our study, MRI underestimated disease in 17 out of 29 (58.6%) luminal cancers. The false negative and false positive MRI findings could be due to chemotherapy-induced vasoconstriction and chemotherapy-induced inflammatory changes, respectively.
There are certain strengths of this study. While in some previous studies[16] diagnostic performance of MRI was reported as true positive, true negative, false positive, and false negative, it did not reflect the accuracy of MRI for prediction of exact post-NAC tumour size and the actual extent of the disease for surgical planning. In the present study, the size discrepancy between the post-NAC residual MRI tumour size and post-surgical size has been used, allowing better evaluation of the extent of disease for surgical planning. Second, all imaging, histopathology, and treatment were performed “in-house,” following standard protocols with no variation in individual management of patients. Third, all patients had their second MRI performed after finishing the NAC treatment and less than 30 days before surgery. Fourth, our definition of pCR did not include axilla and DCIS. The focus of this study was to evaluate the response of the breast tissue to NAC. Response of axillary nodes to chemotherapy may not correlate with response of breast tissue and this could be the focus for further studies. Detection of DCIS by MRI is likely to improve in future and can become a regular indication of post-NAC MRI, however, further studies are needed to assess MRI efficacy in assessing DCIS after NAC.[19,20,21]
There are a few limitations of this study. First, this is a small retrospective study with a small number of patients in each subgroup. Further prospective studies with large number of cases would help to reinforce our findings. Second, our definition of pCR did not include the axilla and DCIS, which could be considered to be a limitation by some. However, the focus of this study was the response of the breast tissue to NAC. Another potential limitation is that we did not calculate the tumour volume on MRI. Hylton et al.[22] used tumour volume of residual tumour on MR in ISPY-1 and found that it was significantly more accurate. However, tumour volume is still not used widely as a parameter of response monitoring in breast cancer patients due to lack of large multicentre studies to validate its superiority. Another potential limitation could be lack of evaluation of MRI contrast dynamics. However, morphology trumps dynamics in breast MRI and dynamics alone cannot be used to make clinical decisions. Finally, our HER+ group had small numbers and the result may not be representative of the entire population.
Conclusion
In conclusion, the molecular classification of breast cancers is clinically relevant and supports treatment choices. This study demonstrates that MRI is more accurate in predicting the size of residual cancer in TN cancers as compared to luminal cancers, where there is a high incidence of underestimation of residual disease. Refining our understanding of the different subtypes of cancers will lead to more personalized management and lesser rates of re-excisions.
Financial support and sponsorship
Nil.
Conflicts of interest
There are no conflicts of interest.
References
- 1.National Cancer Institute. Surveillance, epidemiology and End results (SEER) programme. SEER website. [Last accessed on 2016 Jun]. Available from http://www.seer.cancer.gov/
- 2.van 't Veer LJ, Dai H, van de Vijver MJ, He YD, Hart AA, et al. Gene expression profiling predicts clinical outcome of breast cancer. Nature. 2002;415:530–6. doi: 10.1038/415530a. [DOI] [PubMed] [Google Scholar]
- 3.Edge SB, Byrd DR, Compton CC, Fritz AG, Greene FL, Trotti A. AJCC Cancer staging manual. 7th ed. New York, NY: Springer; 2009. pp. 347–76. [Google Scholar]
- 4.Loo CE, Straver ME, Rodenhuis S, Muller SH, Wesseling J, Peeters MJ, et al. Magnetic resonance imaging response monitoring of breast cancer during neo-adjuvant chemotherapy: Relevance of breast cancer subtype. J Clin Oncol. 2011;29:660–6. doi: 10.1200/JCO.2010.31.1258. [DOI] [PubMed] [Google Scholar]
- 5.Hayashi Y, Takei H, Nozu S, Tochigi Y, Ichikawa A, Kobayashi N, et al. Analysis of complete response by MRI following neoadjuvant chemotherapy predicts pathological tumour responses differently for molecular subtypes of breast cancer. Oncol Lett. 2013;5:83–9. doi: 10.3892/ol.2012.1004. [DOI] [PMC free article] [PubMed] [Google Scholar]
- 6.von Minckwitz G, Untch M, Blohmer JU, Costa SD, Eidtmann H, Fasching PA, et al. Definition and impact of pathologic complete response on prognosis after neoadjuvant chemotherapy in various intrinsic breast cancer subtypes. J Clin Oncol. 2012;30:1796–804. doi: 10.1200/JCO.2011.38.8595. [DOI] [PubMed] [Google Scholar]
- 7.Dent R, Trudeau M, Pritchard KI, Hanna WM, Kahn HK, Sawka CA, et al. Triple negative Breast cancer: Clinical features and patterns of recurrence. Clin cancer Res. 2007;13:4429–34. doi: 10.1158/1078-0432.CCR-06-3045. [DOI] [PubMed] [Google Scholar]
- 8.Ko ES, Lee BH, Kim HA, Noh WC, Kim MS, Lee SA. Triple negative Breast cancer: Correlation between imaging and pathologic findings. Eur Radiol. 2010;20:1111–7. doi: 10.1007/s00330-009-1656-3. [DOI] [PubMed] [Google Scholar]
- 9.Dogan BE, Gonzalez-Angulo AM, Gilcrease M, Dryden MJ, Yang WT. Multi-modality imaging of triple receptors negative tumours with mammography, US and MRI. AJR Am J Roentgenol. 2010;194:1160–6. doi: 10.2214/AJR.09.2355. [DOI] [PubMed] [Google Scholar]
- 10.Krizmanich-Conniff KM, Paramagul C, Patterson SK, Helvie MA, Roubidoux MA, Myles JD, et al. Triple receptor negative breast cancer: Imaging and clinical characteristics. AJR Am J Roentgenol. 2012;199:458–64. doi: 10.2214/AJR.10.6096. [DOI] [PMC free article] [PubMed] [Google Scholar]
- 11.Uematsu T, Kasami M, Yuen S. Triple-negative breast cancers: Correlation between MR imaging and pathological findings. Radiology. 2009;250:638–47. doi: 10.1148/radiol.2503081054. [DOI] [PubMed] [Google Scholar]
- 12.Youk JH, Son EJ, Chung J, Kim JA, Kim EK. Triple-negative breast cancers on dynamic contrast enhanced and diffusion weighted MR imaging: Comparison with other breast cancer subtypes. Eur Radiol. 2012;22:1724–34. doi: 10.1007/s00330-012-2425-2. [DOI] [PubMed] [Google Scholar]
- 13.Symmans WF, Peintinger F, Hatzis C, Rajan R, Kuerer H, Valero V, et al. Measurement of residual breast cancer burden to predict survival after neoadjuvant chemotherapy. J Clin Oncol. 2007;25:4414–22. doi: 10.1200/JCO.2007.10.6823. [DOI] [PubMed] [Google Scholar]
- 14.Rutman AM, Kuo MD. Radiogenomics: Creating a link between molecular diagnostics and diagnostic imaging. Eur J Radiol. 2009;70:232–41. doi: 10.1016/j.ejrad.2009.01.050. [DOI] [PubMed] [Google Scholar]
- 15.Perou CM, Borrensen-Dale AL. Systems biology and genomics of breast cancer. Cold spring Harb Perspect Biol. 2011;3:2. doi: 10.1101/cshperspect.a003293. [DOI] [PMC free article] [PubMed] [Google Scholar]
- 16.Bae MS, Seo M, Kim KG, Park IA, Moon WK. Quantitative MRI morphology of invasive breast cancer: Correlation with Immuno-histochemical biomarkers and subtypes. Acta Radiol. 2015;56:269–75. doi: 10.1177/0284185114524197. [DOI] [PubMed] [Google Scholar]
- 17.Foulkes WD, Smith IE, Reis-Filho JS. Triple negative Breast cancer. N Eng J Med. 2010;363:1938–48. doi: 10.1056/NEJMra1001389. [DOI] [PubMed] [Google Scholar]
- 18.Cheang MC, Voduc D, Bajdik C, Leung S, McKinney S, Chia SK, et al. Basal like Breast cancer defined by five bio-markers has superior prognostic value than triple negative phenotype. Clin cancer Res. 2008;14:1368–76. doi: 10.1158/1078-0432.CCR-07-1658. [DOI] [PubMed] [Google Scholar]
- 19.Jones RL, Lakhani SR, Ring AE, Ashley S, Walsh G, Smith IE. Pathological complete response and residual DCIS following neoadjuvant chemotherapy for breast carcinoma. Br J Cancer. 2006;94:358–62. doi: 10.1038/sj.bjc.6602950. [DOI] [PMC free article] [PubMed] [Google Scholar]
- 20.De Los Santos JF, Cantor A, Amos KD, Forero A, Golshan M, Horton JK, et al. Magnetic resonance imaging as a predictor of pathologic response in patients treated with neo-adjuvant systemic treatment for operable breast cancer. Translational Breast cancer research Consortium trial 017. Cancer. 2013;119:1776–83. doi: 10.1002/cncr.27995. [DOI] [PMC free article] [PubMed] [Google Scholar]
- 21.Choi HK, Cho N, Moon WK, Im Sa, Han W, Noh DY. Magnetic resonance imaging evaluation of residual ductal carcinoma in situ following preoperative chemotherapy in breast cancer patients. Eur J Radiol. 2012;81:737–43. doi: 10.1016/j.ejrad.2011.01.013. [DOI] [PubMed] [Google Scholar]
- 22.Hylton N, Blume J, Gatsonis C, Gomez R, Bernreuter W, Pisano E, et al. ACRIN 6657/ISPY Trial team. Locally advanced breast cancer: MRI imaging for predicting response to neoadjuvant chemotherapy. Radiology. 2012;263:663–72. doi: 10.1148/radiol.12110748. [DOI] [PMC free article] [PubMed] [Google Scholar]


