

Abstract
Importance
Published definitions of “plus disease” in retinopathy of prematurity (ROP) reference arterial tortuosity and venous dilation within the posterior pole based on a standard published photograph. One possible explanation for limited inter-expert reliability for plus disease diagnosis is that experts deviate from the published definitions.
Objective
To identify vascular features used by experts for diagnosis of plus disease through quantitative image analysis.
Design
We developed a computer-based image analysis system (Imaging and Informatics in ROP, i-ROP), and trained the system to classify images compared to a reference standard diagnosis (RSD). System performance was analyzed as a function of the field of view (circular crops 1–6 disc diameters [DD] radius) and vessel subtype (arteries only, veins only, or all vessels). The RSD was compared to the majority diagnosis of experts.
Setting
Routine ROP screening in neonatal intensive care units at 8 academic institutions.
Participants
A set of 77 digital fundus images was used to develop the i-ROP system. A subset of 73 images was independently classified by 11 ROP experts for validation.
Main Outcome Measures
The primary outcome measure was the percentage accuracy of i-ROP system classification of plus disease with the RSD as a function of field-of-view and vessel type. Secondary outcome measures included the accuracy of the 11 experts compared to the RSD.
Results
Accuracy of plus disease diagnosis by the i-ROP computer based system was highest (95%, confidence interval [CI] 94 – 95%) when it incorporated vascular tortuosity from both arteries and veins, and with the widest field of view (6 disc diameter radius). Accuracy was ≤90% when using only arterial tortuosity (P<0.001), and ≤85% using a 2–3 disc diameter view similar to the standard published photograph (p<0.001). Diagnostic accuracy of the i-ROP system (95%) was comparable to that of 11 expert clinicians (79–99%).
Conclusions and Relevance
ROP experts appear to consider findings from beyond the posterior retina when diagnosing plus disease, and consider tortuosity of both arteries and veins, in contrast to published definitions. It is feasible for a computer-based image analysis system to perform comparably to ROP experts, using manually segmented images.
INTRODUCTION
Retinopathy of prematurity (ROP) is a vasoproliferative disease affecting premature infants. Since the 1980s, clinical diagnosis has been standardized using the International Classification for ROP (ICROP).1,2 Diagnostic cut-points identifying severe treatment-requiring ROP have been proposed and tested.3 As a result of multicenter clinical trials, it is known that severe ROP may be successfully treated if diagnosed early.3,4 Furthermore, in spite of these advances in diagnosis and treatment, ROP continues to be a leading cause of childhood blindness worldwide.5,6
The Early Treatment for ROP (ETROP) multicenter clinical trial showed that “plus disease” is the most important ICROP parameter for identifying treatment-requiring ROP.3 Plus disease is defined as arterial tortuosity and venous dilation in the posterior pole greater than that of a standard published photograph selected by expert consensus during the 1980s.1 Thus, accurate and consistent diagnosis of plus disease is critical to ensure infants at risk for blindness receive the appropriate screening and treatment. Since that time, a newer “pre-plus” category has been defined by the revised ICROP as retinal vascular abnormalities that are insufficient for plus disease but have more arterial tortuosity and venous dilation than normal.1
There are numerous limitations in the definition of plus disease. Studies have found that clinical plus disease diagnosis is subjective and varies among experts.7,8 The ICROP definition explicitly states that “plus disease” refers only to arterial tortuosity and venous dilation within the posterior pole vessels, and the standard published photograph displays only a very narrow-angle retinal view of 2 to 3 disc diameters (Figure 1A). However, our previous work suggests that experts consider additional retinal features (such as venous tortuosity) and larger retinal fields of view during real-world clinical diagnosis.9–11 Better understanding of the retinal vascular abnormalities that characterize “plus disease” will lead to improved clinical diagnosis, improved education,12–14 and improved methods for automated computer-based diagnosis.15,16
Figure 1.
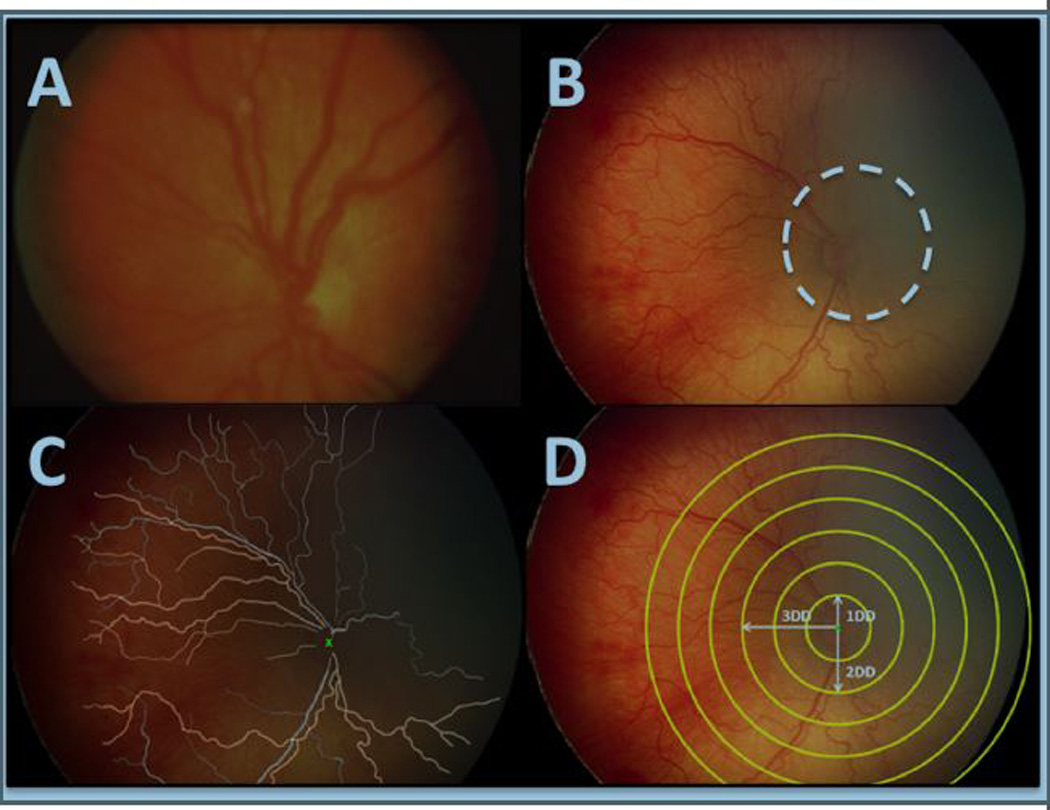
Computer-based image analysis. (a) Standard published photograph of plus disease. (b) A representative fundus image, where the white dashed line demarcates approximate field of view of the standard published photograph. (c) Results of manual segmentation of retinal vessels. (d) Circular crops with radius 1 – 6 disc diameters for subsequent analysis.
Our purpose is to identify quantitative retinal vascular features that correlate with plus disease diagnosis by ROP experts. We have developed a computer-based image analysis system (Imaging and informatics in ROP, i-ROP), and have demonstrated that it can accurately identify plus disease and pre-plus disease.17 In this study, we use i-ROP to correlate quantitative vascular features with a reference standard diagnosis (RSD) defined by consensus of image reviews by three expert ROP image graders combined with the clinical diagnosis.
METHODS
This study was approved by the Institutional Review Board at Oregon Health & Science University, and followed the tenets of the Declaration of Helsinki.
Description of data set
We developed a database of 77 wide-angle retinal images acquired during routine clinical care and established a RSD for each image using previously published methods that combine three expert graders’ (independent, masked gradings from two ophthalmologists and one ROP study coordinator) interpretations and the clinical diagnosis.18 In brief, when the majority of the experts independently agreed with the clinical diagnosis (made at bedside using indirect ophthalmoscopy by examining clinician), this consensus became the RSD. If there was disagreement, the image was discussed among the group for consensus to determine the RSD. Among these 77 images, 14 had a reference standard diagnosis of plus disease, 16 had pre-plus disease, and 47 were normal. Each image was manually segmented by one author (SNP) to identify retinal vessels for computer-based analysis, and cropped into circles of a range of sizes based on methodology described previously (Figure 1).17
Computer-based image analysis
We developed the i-ROP computer-based image analysis system.17 Briefly, we used 11 previously described measurements of dilation and tortuosity and trained i-ROP system to identify the vascular features that best classified normal, pre-plus, and plus disease into the correct categories compared to the RSD.17,19 From each measurement algorithm, we obtained a set of distribution of values for each image and analyzed them using a two-component Gaussian Mixed Model (GMM) system, which helped us represent the image-features extracted from a vasculature structure as a probability distribution (with two components, respectively representing the straight and tortuous segments) rather than a set of values coming from regular statistics such as mean and median. Finally, we compared the ordered probability distributions for each image and compared them to the RSD to train the system to correctly classify the images as plus, pre-plus, or normal. We examined several algorithms to quantify vascular tortuosity, and found that the most accurate algorithm utilized an “acceleration” function, which was a point-based feature, defined as the second derivative of the best-fit line at each point on the vascular tree.17
Data analysis
Agreement of the RSD (plus, pre-plus, or normal) with findings from computer-based image analysis was examined over a range of circular image crop sizes, from a 1 disc diameter (DD) radius to a 6 DD radius (Figure 1). Agreement of the reference standard diagnosis with findings from computer-based image analysis was then examined when considering arteries only, veins only, and all vessels. To improve the external validity of image analysis, we utilized a leave-one-out cross validation process, which uses a repeated process of using a subset of the data to train the system and compare to the remaining dataset.17 We then used a jack-knife variance estimate to calculate standard deviation and confidence intervals for the performance of the system for each subset of values, and Stata v 11.0 (College Station, TX) for determination of statistical significance using the t-test function.
Finally, to determine whether the RSD was adequately representative of the general population of clinicians, a subset of 73 of the 77 wide-angle retinal images was separately classified by 11 clinical experts as part of a larger set of 100 images (four images [all of which were unanimously diagnosed as plus disease by all experts, clinical diagnosis, and the i-ROP system] were excluded from the larger dataset for methodological reasons). All 11 experts were experienced in ROP examination and treatment, and had all participated as experts in NIH-funded ROP research studies and/or published at least 2 peer-reviewed ROP papers. To examine the classification performance of the i-ROP computer-based image analysis system, we calculated the tabular confusion matrix for the plus disease classification of the RSD compared to the i-ROP system for each of the 77 images.
RESULTS
Impact of field of view and vessel subtype on plus disease diagnosis
Data present in Table 1 demonstrate improved performance of i-ROP computer-based analysis with increased field of view, in which accuracy compared with the RSD generally improved from 1 DD radius field of view (64% accuracy [CI 61 – 67] when considering all vessels) to 3 DD (approximate field of view of the standard photograph, 85% accuracy [CI 83 – 86]) to 6 DD radius field of view (95% accuracy [CI 94 – 95], P<0.001 vs. 3DD). Findings also demonstrate improved i-ROP system performance when considering all vessels (95% accuracy [CI 94 – 95] with 6 DD radius field of view), rather than only arteries (87% accuracy [CI 86 – 88] with 6 DD radius field of view, P<0.001) or only veins (79% accuracy [77 – 81] with 6 DD radius field of view, P<0.001). None of the dilation features performed better than 80% accuracy (data not shown).17 Examples of study images demonstrating these points are shown in Figure 2.
Table 1. Impact of field of view and retinal vessel subtype on accuracy of plus disease diagnosis.
Performance of i-ROP system compared to reference standard (determined by combining image review by panel of 3 graders with the actual clinical diagnosis) is displayed as percentage of correct diagnoses (plus, pre-plus, or normal).
| Field of View (disc diameter radius) | ||||||
|---|---|---|---|---|---|---|
| 1× | 2× | 3× | 4× | 5× | 6× | |
| All vessels | 64%* (61 – 67%) |
81%* (80 – 82%) |
85%* (83 – 86%) |
91%* (90 – 92%) |
95% (94 – 95%) |
95% (94 – 95%) |
| Arteries | 58%* (54 – 61%) |
78%* (75 – 81%) |
82%* (81 – 83%) |
90%* (88 – 91%) |
90%* (88 – 91%) |
87%* (86 – 88%) |
| Veins | 64%* (61 – 66%) |
70%* (67 – 73%) |
75%* (75 – 77%) |
77%* (75 – 80%) |
78%* (75 – 81%) |
79%* (77 – 81%) |
P < 0.05 versus 6× all vessels (upper right)
Figure 2.
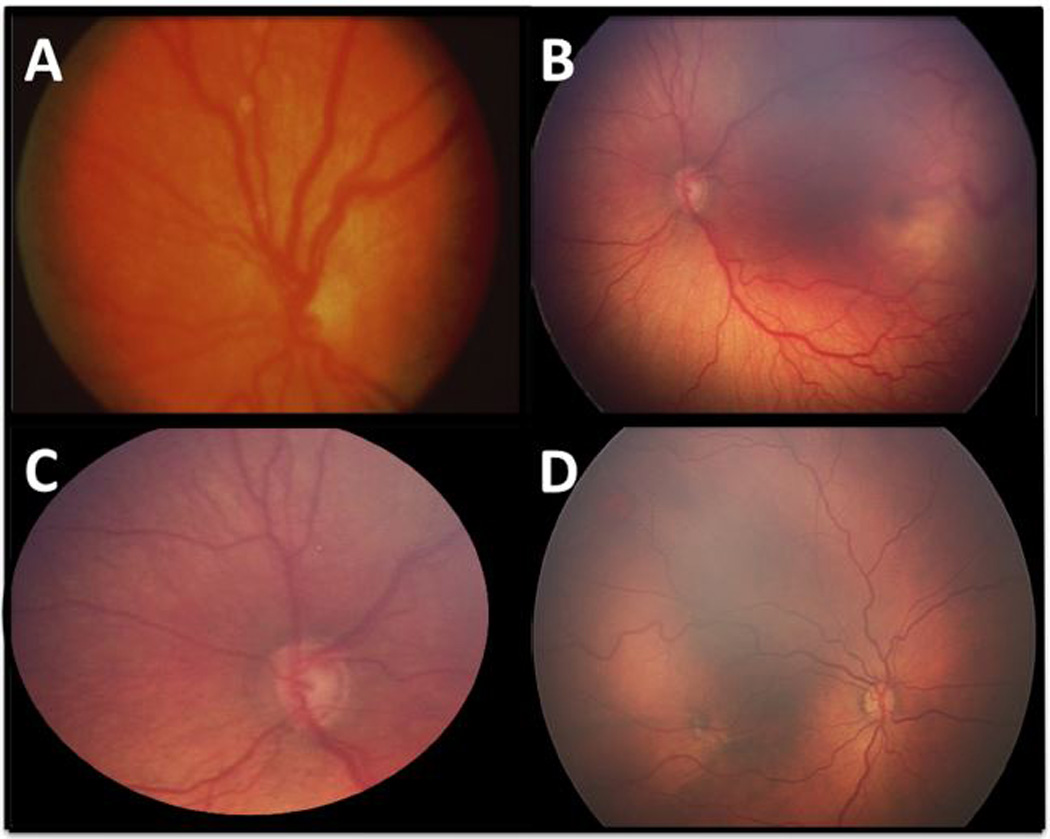
Examples of study images with reference standard diagnosis of plus disease. (a) Standard photograph. (b) Representative wide-angle example of plus disease (c) The same retinal image as (b), cropped to field of view of the standard photograph. (d) A study image with plus disease, with venous tortuosity out of proportion to arterial tortuosity.
Diagnostic accuracy of i-ROP image analysis system and outside experts
Table 2 displays the diagnostic accuracy of plus disease diagnosis of the i-ROP system, compared with the RSD. For an additional comparison, the diagnostic accuracy of 11 clinical experts was also determined using a subset of 73/77 images. Among the 73 images, accuracy of the 11 clinical experts ranged from 79–99% (mean 87%), and accuracy of the i-ROP image analysis system was 95% (69/73 images). When the diagnosis selected by the majority of the 11 experts was compared to the RSD, the clinical expert accuracy was 97% (71/73 images).
Table 2. Accuracy of plus disease diagnosis by clinical experts and i-ROP image analysis system.
| Classifier | Accuracy |
|---|---|
| Expert 1 | 65/73 (89%) |
| Expert 2 | 60/73 (82%) |
| Expert 3 | 64/73 (87%) |
| Expert 4 | 63/73 (86%) |
| Expert 5 | 58/73 (79%) |
| Expert 6 | 72/73 (99%) |
| Expert 7 | 64/73 (88%) |
| Expert 8 | 62/73 (85%) |
| Expert 9 | 68/73 (93%) |
| Expert 10 | 64/73 (88%) |
| Expert 11 | 57/73 (78%) |
| Majority Expert Diagnosis | 71/73 (97%) |
| i-ROP system | 69/73 (95%) |
Table 3 provides details about diagnostic performance of the i-ROP system on the full dataset of 77 images, including the 4/77 images that were diagnosed incorrectly compared to the reference standard. The i-ROP system performed similarly to the three expert image graders who collectively determined the RSD for the 77 images, who individually agreed with the RSD in 72/77 (94%), 74/77 (96%), and 71/77 (92%) images.
Table 3. Accuracy of computer-based diagnosis of plus disease by i-ROP system.
| i-ROP System | ||||
|---|---|---|---|---|
| Plus | Pre-Plus | Normal | ||
| RSD | Plus (n=14) | 12 | 2 | 0 |
| Pre-Plus (n=16) | 1 | 14 | 1 | |
| Normal (n=47) | 0 | 0 | 47 | |
DISCUSSION
This study examines the retinal features used by ROP experts while classifying plus disease, by correlating their diagnoses with pre-specified quantitative parameters from computer-based image analysis. Key findings from this study are: (1) ROP experts appear to consider findings from beyond the central retina when diagnosing plus disease, and consider tortuosity of both arteries and veins, and (2) it is feasible for a computer-based image analysis system to perform comparably to ROP experts, using manually segmented images.
These findings suggest that clinicians incorporate information beyond the ICROP definition of plus disease, which is based only on abnormality within the “posterior pole” vessels. Although the 2005 revised ICROP classification provided examples of wide-field fundus images of pre-plus disease, there continues to be only a single standard published photograph of plus disease, which displays a very narrow field of view (Figure 1A and Figure 2A).1 In this study, a computer-based machine learning system for identifying plus disease was more accurate when evaluating larger-angle fields of view (Table 1). Similarly, we have previously demonstrated that the accuracy of experts decreases when fundus images are cropped closer to the field of view of the standard photograph (Figure 2B).10 In combination, this suggests that the mid-peripheral and peripheral vessels contain information that clinicians use diagnostically to improve their diagnosis, but was not included in the original definition of plus disease. This is consistent with previously published literature.9–11 Similarly, in a different study using qualitative research methods to analyze the diagnostic process of experts, we found that some experts specifically cited peripheral retinal vascular features as being useful for plus disease diagnosis.9
Our findings also show that plus disease diagnosis by experts incorporates tortuosity of both arteries and veins, rather than only the arteries as suggested in the ICROP definition.1 In fact, we have previously shown that veins in the standard published photograph (Figure 1A and Figure 2A) actually have greater tortuosity than the arteries.20 This is consistent with findings by Wilson et al, who demonstrated that quantitative arterial and venous tortuosity both increased with worsening clinical stage of ROP, and both increased regardless of whether 4 or 8 vessels were analyzed.21 This may be useful from a clinical perspective because distinguishing between retinal arteries and veins in infants with ROP can be difficult for a computer system – or even for expert clinicians.22 Furthermore, findings from this study are consistent with other ROP algorithms and suggest that retinal vascular tortuosity is more correlated with expert diagnosis than, although this may be in part because quantitative analysis of vascular dilation is dependent on external factors such as image magnification.23
Because this study finds that expert diagnosis of plus disease is not consistent with published ICROP definitions and there is some inter-expert diagnostic variability, it may be that different experts are weighting particular retinal features differently to arrive at their diagnosis.8,9 This has implications for ROP education, given that our previous work has shown that trainees often perform poorly in clinical diagnosis.10,12–14,24 An important step toward improving clinical diagnosis and education would be through dissemination of wider-angle representative retinal images of ROP. To foster that development we are creating a website (http://www.i-rop.com) that provides examples of such images. We acknowledge that it may be problematic to change the definition of plus disease ex-post-facto in terms of extrapolating prognostic information to a population that may be different than the original population, but feel it would be helpful for all experts to be utilizing the same validated parameters. In the original CRYO-ROP study, using only the “gold standard” of binocular indirect ophthalmoscopy, we note that experts disagreed on the need for treatment based on a diagnosis of threshold disease in 12% of cases.25,26
These study results confirm that CBIA systems can perform similarly to clinicians, and provide objective measurements of the vascular features labeled “plus” and “pre-plus” disease. Additionally, our findings raise the question of whether our attempts at developing CBIA systems ought to be constrained by existing clinical definitions (e.g. “arterial tortuosity and venous dilation”), or whether they as in this case they should model real-world clinician improvement and be designed to “fit the data.” As described above, our study results are consistent with previous work suggesting that distinguishing between arteries and veins is not necessary for CBIA development, and that quantitative measurements of vascular dilation are less accurate than measurements of tortuosity for plus disease diagnosis.16,21 From this analysis, we cannot conclude that experts are ignoring dilation features; for example, it may be that measurements of tortuosity are more continuous as plus disease severity increases, whereas venous dilation correlates strongly only at one or both ends of the plus disease spectrum and therefore tortuosity works better as a single quantitative variable. This may partially explain why other image analysis systems, such as ROPTool™ have lower receiver operating characteristic curves with dilation measures, or it may be related to the imprecision and technical challenges of measuring vascular dilation on RetCam images.22,23,27
Although it is difficult to directly compare the performance of the i-ROP system to prior systems such as ROPTool™ given the use of manual segmentation, different populations studied, and different endpoints for comparison, the i-ROP system appears to have at least two key advantages to previously reported systems, which have been discussed in detail in a prior publication.17 Most importantly, given the high inter-expert variability for the diagnosis of plus disease, the i-ROP system was trained against a rigorously developed reference standard diagnosis, as opposed to a single clinical examiner’s impression. Second, the i-ROP system is the first reported system to accurately incorporate pre-plus disease into the semi-automated classification. Using the i-ROP system, no plus disease eyes were classified as normal, and no normal eyes were classified as plus (Table 3). In comparison, published results using ROPTool™ have reported sensitivity of plus disease detection (against a clinical examiner and without pre-plus identification) between 71 – 86% for plus disease,27,28 and in a recent publication by et al a sensitivity of 91% for any vascular abnormality (≥1 on a scale from 0–16).23
The advantage of the continuous scale used in the Abbey et al paper is that it avoids the inherent limitation in all studies involving computer-based diagnosis, which is the identification of a “gold standard.”15 In this study, our reference standard was developed by combining the image-based diagnoses of 3 ROP image grading experts combined with the actual clinical diagnosis. The majority vote of the 11 clinicians agreed with the RSD in 71/73 (97%) cases, suggesting that the external validity of our RSD is high, and therefore the implications of these findings are likely generalizable to the larger population of ROP clinicians. It is notable that though the majority consensus of the 11 performed well with the reference standard, there was variability even among experts in this group, which may imply different thresholds for each clinician, attention to different vascular features, or imprecision in the classification of the clinicians. The clinical relevance of this variability is unknown, and these questions will be avenues of future research.
There are several additional limitations to this study: (1) The i-ROP system was trained utilizing manually segmented images, which limits its immediate clinical utility. For the purposes of training the machine learning software, we wanted to avoid the potential noise caused by automated segmentation algorithms, however we are working on using the information gleaned from this work to develop a fully automated system. (2) Despite the cross-validation procedures, these data will be more convincing when validated against other datasets. With only 77 images in the dataset, it is possible that different parameters would be found more important in other image sets. (3) We did not analyze whether a combination of image features would have worked better than individual features, so we did not compare “arterial tortuosity and venous dilation” to our current system which uses only a measurement of tortuosity. It may be that some combination actually performs better than the current i-ROP system. (4) There is variability in the routine use of photographic diagnosis during routine clinical care and some of the variability of the expert consensus may be due to unfamiliarity with this technique and not represent true clinical differences.
These findings have important implications for quality of care, education, and delivery of care with emerging technologies such as computer-based decision support and telemedicine.29–31 First, clinicians and trainees can use these findings to improve standardization of plus disease in ROP diagnosis. Second, using the i-ROP system, it may be possible to develop a fully automated plus disease classification system that performs as well as experts at three-level classification.
Acknowledgments
Supported by grants R01 EY19474 and P30 EY010572 from the National Institutes of Health, Bethesda, MD (JPC, MFC), unrestricted departmental funding from Research to Prevent Blindness, New York, NY (JPC, SP, SO, KJ, RVPC, MFC), the St. Giles Foundation (RVPC), and the iNsight Foundation (RVPC, KEJ). None of the funding organizations had any direct or indirect role in any part of this study.
MFC is an unpaid member of the Scientific Advisory Board for Clarity Medical Systems (Pleasanton, CA).
Dr. Michael F. Chiang had full access to all of the data in the study and takes responsibility for the integrity of the data and the accuracy of the data analysis
Members of the i-ROP research consortium
Oregon Health & Science University (Portland, OR): Michael F. Chiang, MD, Susan Ostmo, MS, Kemal Sonmez, PhD, J. Peter Campbell, MD, MPH. Cornell University (New York, NY): RV Paul Chan, MD, Karyn Jonas, RN. Columbia University (New York, NY): Jason Horowitz, MD, Osode Coki, RN, Cheryl-Ann Eccles, RN, Leora Sarna, RN. Bascom Palmer Eye Institute (Miami, FL): Audina Berrocal, MD, Catherin Negron, BA. William Beaumont Hospital (Royal Oak, MI): Kimberly Denser, MD, Kristi Cumming, RN, Tammy Osentoski, RN, Tammy Check, RN. Children’s Hospital Los Angeles (Los Angeles, CA): Thomas Lee, MD, Evan Kruger, BA, Kathryn McGovern, MPH. Cedars Sinai Hospital (Los Angeles, CA): Charles Simmons, MD, Raghu Murthy, MD, Sharon Galvis, NNP. LA Biomedical Research Institute (Los Angeles, CA): Jerome Rotter, MD, Ida Chen, PhD, Xiaohui Li, MD, Kaye Roll, RN. Massachusetts General Hospital (Boston, MA): Jayashree Kalpathy-Cramer, PhD. Northeastern University (Boston, MA): Deniz Erdogmus, PhD. Asociacion para Evitar la Ceguera en Mexico (APEC) (Mexico City): Maria Ana Martinez-Castellanos, MD, Samantha Salinas-Longoria, MD, Rafael Romero, MD, Andrea Arriola, MD.
Footnotes
Conflict of interest:
No conflicting relationship exists for any author.
REFERENCES
- 1.International Committee for the Classification of Retinopathy of Prematurity. The International Classification of Retinopathy of Prematurity revisited. Vol. 123. American Medical Association; 2005. pp. 991–999. [DOI] [PubMed] [Google Scholar]
- 2.Multicenter trial of cryotherapy for retinopathy of prematurity. Preliminary results. Cryotherapy for Retinopathy of Prematurity Cooperative Group. Arch Ophthalmol. 1988;106(4):471–479. doi: 10.1001/archopht.1988.01060130517027. [DOI] [PubMed] [Google Scholar]
- 3.Good WV, Hardy RJ. The multicenter study of Early Treatment for Retinopathy of Prematurity (ETROP) Ophthalmology. 2001;108(6):1013–1014. doi: 10.1016/s0161-6420(01)00540-1. [DOI] [PubMed] [Google Scholar]
- 4.Mintz-Hittner HA, Kennedy KA, Chuang AZ BEAT-ROP Cooperative Group. Efficacy of intravitreal bevacizumab for stage 3+ retinopathy of prematurity. N Engl J Med. 2011;364(7):603–615. doi: 10.1056/NEJMoa1007374. [DOI] [PMC free article] [PubMed] [Google Scholar]
- 5.Sommer A, Taylor HR, Ravilla TD, et al. Challenges of ophthalmic care in the developing world. JAMA Ophthalmol. 2014;132(5):640–644. doi: 10.1001/jamaophthalmol.2014.84. [DOI] [PMC free article] [PubMed] [Google Scholar]
- 6.Gilbert C, Foster A. Childhood blindness in the context of VISION 2020--the right to sight. Bull World Health Organ. 2001;79(3):227–232. [PMC free article] [PubMed] [Google Scholar]
- 7.Wallace DK, Quinn GE, Freedman SF, Chiang MF. Agreement among pediatric ophthalmologists in diagnosing plus and pre-plus disease in retinopathy of prematurity. J AAPOS. 2008;12(4):352–356. doi: 10.1016/j.jaapos.2007.11.022. [DOI] [PMC free article] [PubMed] [Google Scholar]
- 8.Chiang MF, Jiang L, Gelman R, Du YE, Flynn JT. Interexpert agreement of plus disease diagnosis in retinopathy of prematurity. Arch Ophthalmol. 2007;125(7):875–880. doi: 10.1001/archopht.125.7.875. [DOI] [PubMed] [Google Scholar]
- 9.Hewing NJ, Kaufman DR, Chan RVP, Chiang MF. Plus Disease in Retinopathy of Prematurity: Qualitative Analysis of Diagnostic Process by Experts. JAMA Ophthalmol. 2013;131(8):1026. doi: 10.1001/jamaophthalmol.2013.135. [DOI] [PMC free article] [PubMed] [Google Scholar]
- 10.Rao R, Jonsson NJ, Ventura C, et al. Plus disease in retinopathy of prematurity: diagnostic impact of field of view. Retina (Philadelphia, Pa) 2012;32(6):1148–1155. doi: 10.1097/IAE.0b013e31823ac3c3. [DOI] [PMC free article] [PubMed] [Google Scholar]
- 11.Keck KM, Kalpathy-Cramer J, Ataer-Cansizoglu E, You S, Erdogmus D, Chiang MF. Plus disease diagnosis in retinopathy of prematurity: vascular tortuosity as a function of distance from optic disk. Retina (Philadelphia, Pa) 2013;33(8):1700–1707. doi: 10.1097/IAE.0b013e3182845c39. [DOI] [PMC free article] [PubMed] [Google Scholar]
- 12.Myung JS, Paul Chan RV, Espiritu MJ, et al. Accuracy of retinopathy of prematurity image-based diagnosis by pediatric ophthalmology fellows: implications for training. J AAPOS. 2011;15(6):573–578. doi: 10.1016/j.jaapos.2011.06.011. [DOI] [PMC free article] [PubMed] [Google Scholar]
- 13.Paul Chan RV, Williams SL, Yonekawa Y, Weissgold DJ, Lee TC, Chiang MF. Accuracy of retinopathy of prematurity diagnosis by retinal fellows. Retina (Philadelphia, Pa) 2010;30(6):958–965. doi: 10.1097/IAE.0b013e3181c9696a. [DOI] [PMC free article] [PubMed] [Google Scholar]
- 14.Wong RK, Ventura CV, Espiritu MJ, et al. Training fellows for retinopathy of prematurity care: a Web-based survey. J AAPOS. 2012;16(2):177–181. doi: 10.1016/j.jaapos.2011.12.154. [DOI] [PMC free article] [PubMed] [Google Scholar]
- 15.Wittenberg LA, Jonsson NJ, Chan RVP, Chiang MF. Computer-based image analysis for plus disease diagnosis in retinopathy of prematurity. J Pediatr Ophthalmol Strabismus. 2012;49(1):11–19. doi: 10.3928/01913913-20110222-01. quiz10–20. [DOI] [PMC free article] [PubMed] [Google Scholar]
- 16.Chiang MF, Gelman R, Martinez-Perez ME, et al. Image analysis for retinopathy of prematurity diagnosis. J AAPOS. 2009;13(5):438–445. doi: 10.1016/j.jaapos.2009.08.011. [DOI] [PMC free article] [PubMed] [Google Scholar]
- 17.Ataer-Cansizoglu E, Bolon-Canedo V, Campbell JP, et al. Computer-based image analysis for plus disease diagnosis in retinopathy of prematurity: image analysis features associated with expert diagnosis. Transl Vis Sci Technol. 2015 doi: 10.1167/tvst.4.6.5. In Press. [DOI] [PMC free article] [PubMed] [Google Scholar]
- 18.Ryan MC, Ostmo S, Jonas K, et al. Development and Evaluation of Reference Standards for Image-based Telemedicine Diagnosis and Clinical Research Studies in Ophthalmology. AMIA Annu Symp Proc. 2014;2014:1902–1910. [PMC free article] [PubMed] [Google Scholar]
- 19.Ataer-Cansizoglu E, You S, Kalpathy-Cramer J, Keck K, Chiang MF, Erdogmus D. OBSERVER AND FEATURE ANALYSIS ON DIAGNOSIS OF RETINOPATHY OF PREMATURITY. IEEE Int Workshop Mach Learn Signal Process. 2012:1–6. doi: 10.1109/MLSP.2012.6349809. [DOI] [PMC free article] [PubMed] [Google Scholar]
- 20.Gelman SK, Gelman R, Callahan AB, et al. Plus disease in retinopathy of prematurity: quantitative analysis of standard published photograph. Arch Ophthalmol. 2010;128(9):1217–1220. doi: 10.1001/archophthalmol.2010.186. [DOI] [PubMed] [Google Scholar]
- 21.Wilson CM, Wong K, Ng J, Cocker KD, Ells AL, Fielder AR. Digital image analysis in retinopathy of prematurity: a comparison of vessel selection methods. J AAPOS. 2012;16(3):223–228. doi: 10.1016/j.jaapos.2011.11.015. [DOI] [PubMed] [Google Scholar]
- 22.Wallace DK. Computer-assisted quantification of vascular tortuosity in retinopathy of prematurity (an American Ophthalmological Society thesis) Trans Am Ophthalmol Soc. 2007;105:594–615. [PMC free article] [PubMed] [Google Scholar]
- 23.Abbey AM, Besirli CG, Musch DC, et al. Evaluation of Screening for Retinopathy of Prematurity by ROPtool or a Lay Reader. Ophthalmology. 2015 Dec; doi: 10.1016/j.ophtha.2015.09.048. [DOI] [PubMed] [Google Scholar]
- 24.Paul Chan RV, Patel SN, Ryan MC, et al. The Global Education Network for Retinopathy of Prematurity (Gen-Rop): Development, Implementation, and Evaluation of A Novel Tele-Education System (An American Ophthalmological Society Thesis) Trans Am Ophthalmol Soc. 2015;113:T21–T226. [PMC free article] [PubMed] [Google Scholar]
- 25.Trese MT. What is the real gold standard for ROP screening? Retina (Philadelphia, Pa) 2008;28(3 Suppl):S1–S2. doi: 10.1097/IAE.0b013e31816a5587. [DOI] [PubMed] [Google Scholar]
- 26.Reynolds JD, Dobson V, Quinn GE, et al. Evidence-based screening criteria for retinopathy of prematurity: natural history data from the CRYO-ROP and LIGHT-ROP studies. Arch Ophthalmol. 2002;120(11):1470–1476. doi: 10.1001/archopht.120.11.1470. [DOI] [PubMed] [Google Scholar]
- 27.Cabrera MT, Freedman SF, Kiely AE, Chiang MF, Wallace DK. Combining ROPtool measurements of vascular tortuosity and width to quantify plus disease in retinopathy of prematurity. J AAPOS. 2011;15(1):40–44. doi: 10.1016/j.jaapos.2010.11.019. [DOI] [PubMed] [Google Scholar]
- 28.Cabrera MT, Freedman SF, Hartnett ME, Stinnett SS, Chen BB, Wallace DK. Real-time, computer-assisted quantification of plus disease in retinopathy of prematurity at the bedside. Ophthalmic Surg Lasers Imaging Retina. 2014;45(6):542–548. doi: 10.3928/23258160-20141118-09. [DOI] [PMC free article] [PubMed] [Google Scholar]
- 29.Chiang MF, Wang L, Busuioc M, et al. Telemedical retinopathy of prematurity diagnosis: accuracy, reliability, and image quality. Arch Ophthalmol. 2007;125(11):1531–1538. doi: 10.1001/archopht.125.11.1531. [DOI] [PubMed] [Google Scholar]
- 30.Quinn GE, Ying G-S, Daniel E, et al. Validity of a Telemedicine System for the Evaluation of Acute-Phase Retinopathy of Prematurity. JAMA Ophthalmol. 2014 Jun; doi: 10.1001/jamaophthalmol.2014.1604. [DOI] [PMC free article] [PubMed] [Google Scholar]
- 31.Chiang MF, Boland MV, Brewer A, et al. Special requirements for electronic health record systems in ophthalmology. Ophthalmology. 2011;118(8):1681–1687. doi: 10.1016/j.ophtha.2011.04.015. [DOI] [PubMed] [Google Scholar]