Abstract
The proper microstructural arrangement of complex neural structures is essential for establishing the functional circuitry of the brain. We present an MRI method to resolve tissue microstructure and infer brain cytoarchitecture by mapping the magnetic susceptibility in the brain at high resolution. This is possible because of the heterogeneous magnetic susceptibility created by varying concentrations of lipids, proteins and irons from the cell membrane to cytoplasm. We demonstrate magnetic susceptibility maps at a nominal resolution of 10-µm isotropic, approaching the average cell size of a mouse brain. The maps reveal many detailed structures including the retina cell layers, olfactory sensory neurons, barrel cortex, cortical layers, axonal fibers in white and gray matter. Olfactory glomerulus density is calculated and structural connectivity is traced in the optic nerve, striatal neurons, and brainstem nerves. The method is robust and can be readily applied on MRI scanners at or above 7 T.
Keywords: Quantitative susceptibility mapping, Cytoarchitecuture, Mouse brain
Introduction
The complex central nervous system (CNS) consists two main cell types, neurons and glia (Steinbusch, 1981). The average diameter of most neurons and glia cells is on the order of microns in the adult mouse brain (Geisert et al., 2002; Magavi et al., 2000). These cells are characterized by a wide variation in shape and are often location specific, e.g. pyramidal neurons are abundant in the cortical regions (Spruston, 2008). An understanding of these structures and their locations is essential to understand functional circuit properties and their relation to behaviors (Fields et al., 2015). However, mapping the entire brain at near cellular resolution is still challenging. Several imaging techniques are currently being used for acquiring high resolution data from a mouse brain, e.g. the conventional two-dimensional (2D) histology methods (Halliday et al., 2007; Lein et al., 2007) and optical microscopy (Dodt et al., 2007; Magavi et al., 2000). However, conventional 2D histology-based methods are limited by the orientation of available sections and sectioning-related damage and deformation. Optical approaches have limited tissue contrast for differentiating substructure within the brain. Dedicated high field (>7 T) animal MRI scanners have been shown to provide superior contrast and reveal fine anatomical details in the mouse brain (Jiang and Johnson, 2010; Wu et al., 2013). Advances in MRI techniques continue to improve resolution and contrast, providing a means to achieve a mesoscopic resolution (on the order of 10 µm) bridging gross neuroanatomy to the cellular architecture of the brain.
Several MRI contrast mechanisms that are thought to be sensitive to cellular organization have been applied to evaluate the mouse brain at high resolution. For example, current state-of-the-art DTI methods enable imaging an ex vivo adult mouse brain at approximately 40-µm isotropic resolution (Jiang and Johnson, 2010). But, DTI is inherently based on signal attenuation and is limited by T2 and decay, B0 inhomogeneity, and limited signal-to-noise ratio (SNR) (Jaermann et al., 2006). Thus, DTI and other diffusion-based methods are problematic in resolving small fiber tracts, such as the structures of medium-sized spiny neurons (MSN) which are also complex with frequent branches (Matamales et al., 2009). Studies have shown that the use of MRI signal phase in gradient-echo (GRE) can uncover a fine structure in the brain tissue (Duyn et al., 2007; He and Yablonskiy, 2009; Rauscher et al., 2005). Phase imaging allows an enhanced contrast within gray matter and white matter that are not resolved with conventional imaging at ultra-high field (>7.0 T) MRI (Abduljalil et al., 2003; Duyn et al., 2007; Marques et al., 2009). However, phase values are non-local, i.e. the phase at one location not only depends on the local tissue properties but also depends on the neighboring magnetic susceptibility distribution. Quantitative susceptibility mapping (QSM) addresses this limitation by computing the spatial distribution of the underlying source of the phase, i.e. magnetic susceptibility (Bilgic et al., 2012; Carpenter et al., 2016; Li and van Zijl, 2014; Liu, 2010; Liu et al., 2014, 2015; Schweser et al., 2010; Wei et al., 2016; Xie et al., 2015). QSM reveals excellent image contrast and quantifies the magnetic properties of brain tissue, affected by e.g., iron in the cell body and myelin in the axons (Argyridis et al., 2014; Benner et al., 2013; Bilgic et al., 2012; Lee et al., 2012; Liu et al., 2012;Wang and Liu, 2015), which indicates that magnetic susceptibility may be used to improve the spatial resolution and contrast for cytoarchitecture of the whole brain. Current QSM techniques suffer from the severe streaking artifacts in the computed susceptibility maps from the single-orientation data (Li et al., 2015; Liu et al., 2013; Wei et al., 2015). A number of recent studies have aimed to improve the accuracy of susceptibility estimation and reduce the streaking artifacts (Li et al., 2015; Liu et al., 2013; Wei et al., 2015; Wu et al., 2012). One method called the streaking artifact reduction for quantitative susceptibility mapping (STAR-QSM) reduces streaks by limiting the strong susceptibility components (Wei et al., 2015).
In this study, mouse brains (n = 2) were scanned ex vivo at a nominal 10-µm isotropic resolution using a three-dimensional (3D) GRE sequence at 9.4 T. We applied STAR-QSM to address current issues of streaking artifacts. In this dataset, QSM offers a powerful tool to resolve fine detailed magnetic susceptibility contrast in many structures, e.g. retina cell layers, olfactory sensory neurons, corpus callosum, putamen axon, cerebral cortical layers, barrel cortex, hippocampus layers, cerebellum, striatal neurons, and the brainstem. Using STAR-QSM, we are able to achieve in susceptibility mapping at a resolution and contrast exceeding traditional MR images.
Materials and methods
Perfusion and fixation
Mice (adult male C57BL/6) were provided with free access to food and water before experiments. Mice were anesthetized with isoflurane, a midline abdominal incision was made, and a catheter was inserted into the heart. Transcardial perfusion fixation was used with inflow to the left ventricle and outflow from the right atrium. The animals were perfused with saline and 0.1% heparin followed by a solution of 2.5 mM ProHance (Gadoteridol, Bracco Diagnostics Inc., Princeton, NJ) in 10% formalin. Both saline and ProHance-formalin were perfused at 8 ml/min for 5 min using a perfusion pump. Brain specimens were immersed in ProHance-formalin overnight and then immersed in solution of 2.5 mM ProHance in 10 mM phosphate buffered saline the next day. Imaging was obtained several weeks later. The study was approved by the local Institutional Animal Care & Use Committee.
Data acquisition
The specimen was firmly affixed in an 11-mm polyethylene tube filled with Fomblin (fluoropolyether; Ausimont, Inc., Morristown, NJ) to mitigate tissue dehydration and reduce large susceptibility distortions at the specimen surface. MR experiments were performed using a 9.4 T (400 MHz) 8.9-cm vertical bore Oxford magnet with shielded gradients of 2200 mT/m. The specimen was scanned with the long axis (rostral–caudal axis) of the mouse brain oriented perpendicular to the main magnetic field direction. A 3D spoiled multiecho GRE sequence was used with the following parameters: field of view (FOV) = 22 × 11 × 10 mm3, matrix size = 2200 × 1100 × 1000 resulting in a nominal voxel size of 10 × 10 × 10 µm3, TE1/TE2 = 6.8/16.4 ms, TR = 35 ms, and flip angle = 90°. Acquisition time for each scan was 10 h 42 min. Nine or ten signal averages were acquired to achieve adequate SNR making the total scan time around 100 h.
Data reconstruction
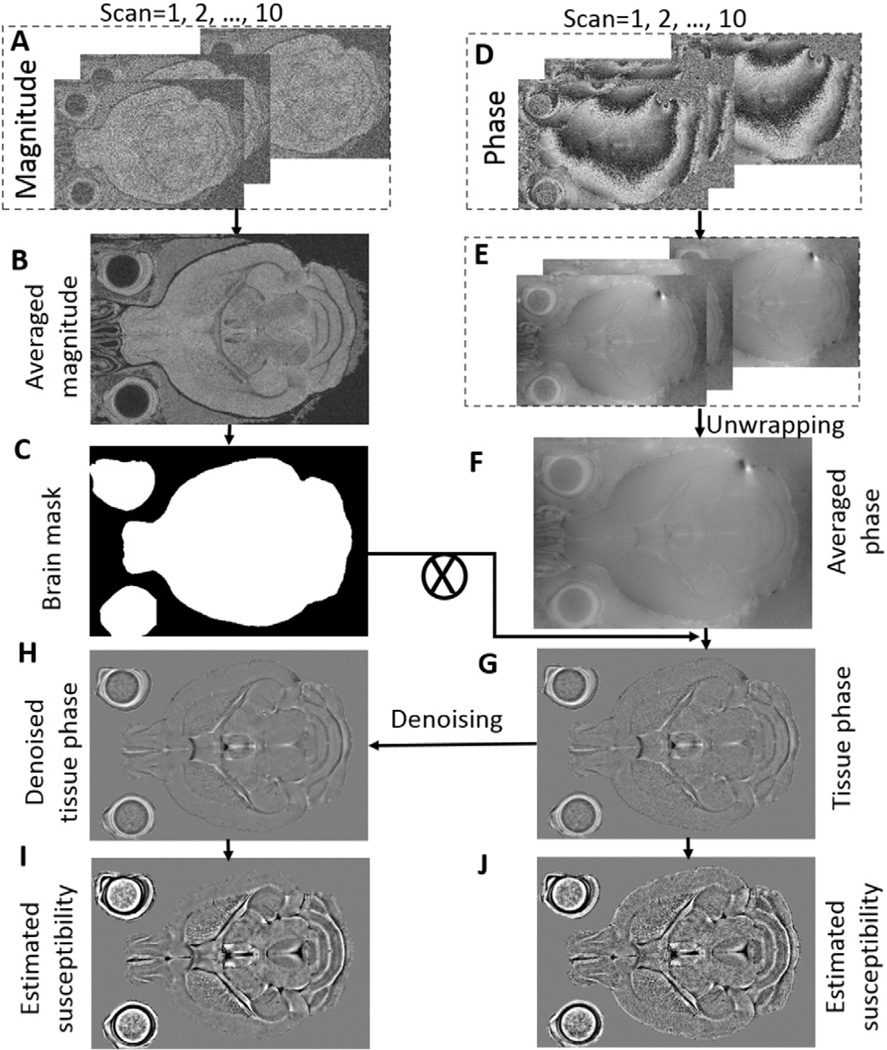
The images were reconstructed with 3D Fast Fourier transform using the complex k-space data and then separated into magnitude and phase. The magnitude images from individual scans (Fig. 1A) were averaged to achieve a higher SNR. The averaged magnitude image was used for the extraction of the brain tissue mask. Meanwhile, the raw phase from each scan was unwrapped separately using the Laplacian-based phase unwrapping (Li et al., 2011), the phase images at two echoes from a single scan were averaged. The phase images from all these individual scans (Fig. 1E) were then averaged prior to QSM (Fig. 1F), and the local tissue phase (Fig. 1G) is obtained by removing the background phase via spherical mean value filtering (SMV) with a variable diameter towards the brain boundary (Wu et al., 2012). The variable radius of the SMV filter increased from 1 pixel at the brain boundary to 25 towards the center of the brain. The filtered phase image was further denoised by a block matching grouping approach based on a sparse representation in transformed domain (Maggioni et al., 2013). Briefly, the sparsity is achieved by grouping similar 3D image cubes into the 4D “group”. Four one-dimensional linear transform operators were separately applied to each dimension of the group. The obtained four-dimensional group spectrum is then coefficient shrunk by a thresholding operator. The estimate of the group with reduced noise is finally produced by applying the inverse four-dimensional transform to the shrunk spectrum. We set the size of the cubes to 5 × 5 × 5 for grouping. The separable four-dimensional transform is a composition of a 3-D Haar transform in the cube dimensions and a 1-D Haar wavelet in the grouping dimension as the default setting. More details about the algorithm procedure can be found in the Supplementary material and in the reference (Maggioni et al., 2013). Lastly, the denoised tissue phase map (Fig. 1H) is processed using the STAR-QSM algorithm (Wei et al., 2015) to obtain the susceptibility maps (Fig. 1I).
Fig. 1.
Schematic view of the data processing and QSM reconstruction. A: Magnitude images from multiple scans. B: Averaged magnitude image. C: Brain mask. D: Raw phase images from multiple scans. E: Unwrapped phase images. F: Averaged phase. G: Tissue phase obtained after removing background phase. H: Denoised tissue phase. I: QSM reconstructed using STARQSM. J: QSM reconstructed without phase denoising (G).
Image analysis and visualization
A 3D Hough transform was used to segment the glomeruli from the olfactory bulbs. The technique for this study was based on a 2D circular Hough transform implemented by Peng et al. (2007) which was extended into 3D to search for spheres in volume data (Xie et al., 2012). Glomeruli were assumed to be spherical at the current resolution. The algorithm was performed in MATLAB (MathWorks Inc., Natick, MA) and is made available on MATLAB Central File Exchange (www.mathworks.com/matlabcentral/fileexchange/48219).
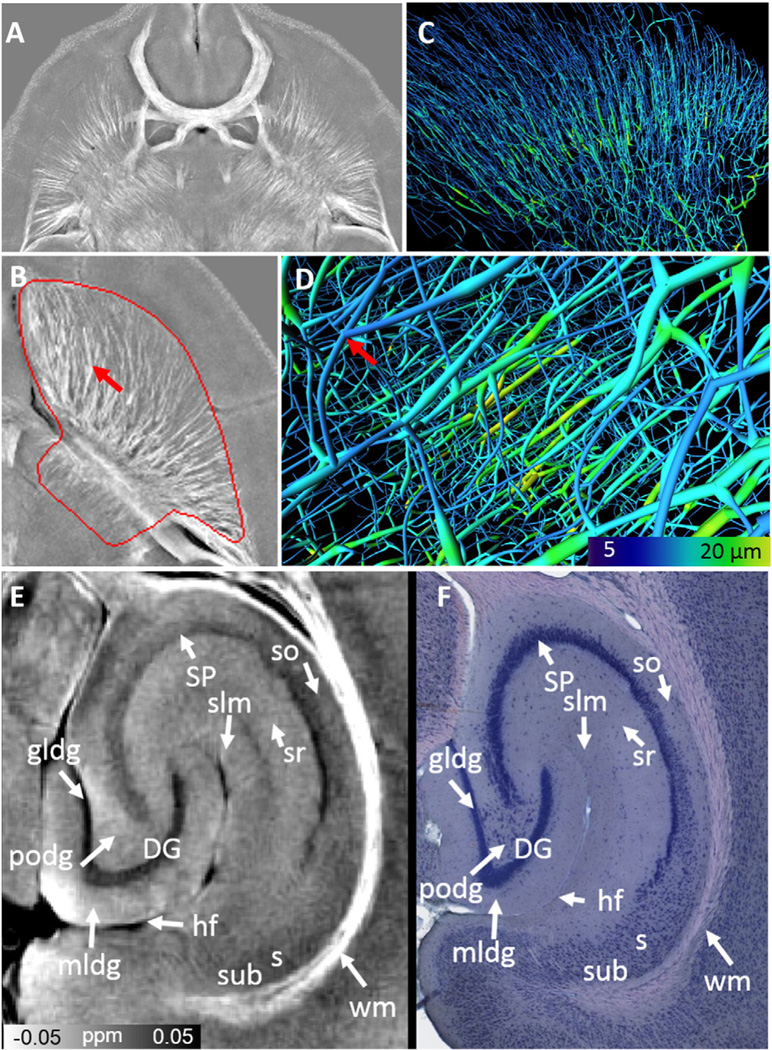
Visualization and volume rendering were accomplished using a combination of ImageJ (http://rsbweb.nih.gov/ij/), Avizo (Visualization Sciences Group, Burlington, MA), and Vitrea (Vital Images, Inc., Minnetonka, MN). Specifically, the barrel cortex (neuron somata) was visualized using Vitrea. Here, a curved surface was manually selected in the vibrissal cortex and then flattened to visualize the barrels. Volume rendering of the olfactory glomeruli and optic nerves was performed using Avizo. The striatum area was first manually segmented as outlined in red in Fig. 5B. Then striatal tracts were followed using a seeded region growing on the QSM images. Skeletonization and surface renders were then performed and visualized using Avizo.
Fig. 5.
White matter and striatal tracts using QSM maps. A & B: Maximum intensity projection of QSM maps in the axial directions over 200 µm. C & D: Example of 3 dimensional reconstructed striatal tracts from magnetic susceptibility. E & F: Susceptibility map of hippocampus compared to a Giemsa stain at 0.46 µm/pixel resolution. SP: stratum pyramidale; DG: dentate gyrus; gldg: granule cell layer; hf: hippocampal fimbria; mldg: molecular layer; podg: polymorphic layer; s: subiculum; so: stratum oriens; sr: stratum radiatum; slm: stratum lacunosum-moleculare; subiculum (sub); wm: white matter. Giemsa staining figure was reproduced with permission (http://brainmaps.org/index.php?action=viewslides&datid=115).
Results
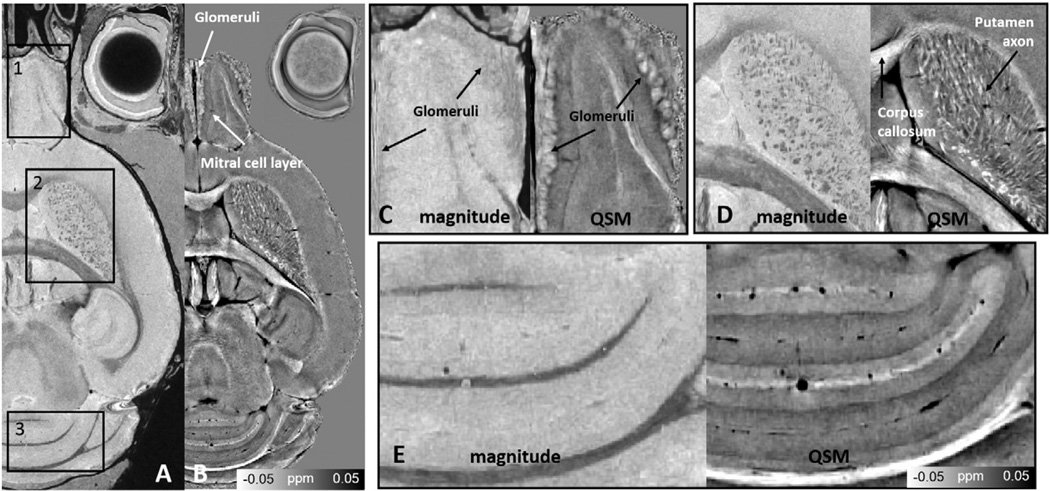
High contrast in the brain tissue can be observed in both magnitude and susceptibility images (Fig. 2A & B). Note that susceptibility values are inverted and the bright glomeruli are diamagnetic. Higher structural contrast can be observed in susceptibility images (Fig. 2B). For instance, the glomeruli in the olfactory bulb, the mitral cell layer, and the hippocampal cell layers can be seen in much higher detail in QSM compared to magnitude. Furthermore, the olfactory bulb, putamen, and cerebellum layers can be clearly distinguished in QSM compared to magnitude images (Fig. 2C, D & E).
Fig. 2.
Comparison between magnitude and QSM. A: Magnitude. B: QSM. QSM reveals additional anatomical detail in the olfactory bulb, corpus callosum, putamen, and cerebellum. Magnification of the areas outlined in black on the GRE magnitude and QSM are illustrated corresponding to (C) olfactory bulb, (D) striatum and (E) cerebellum.
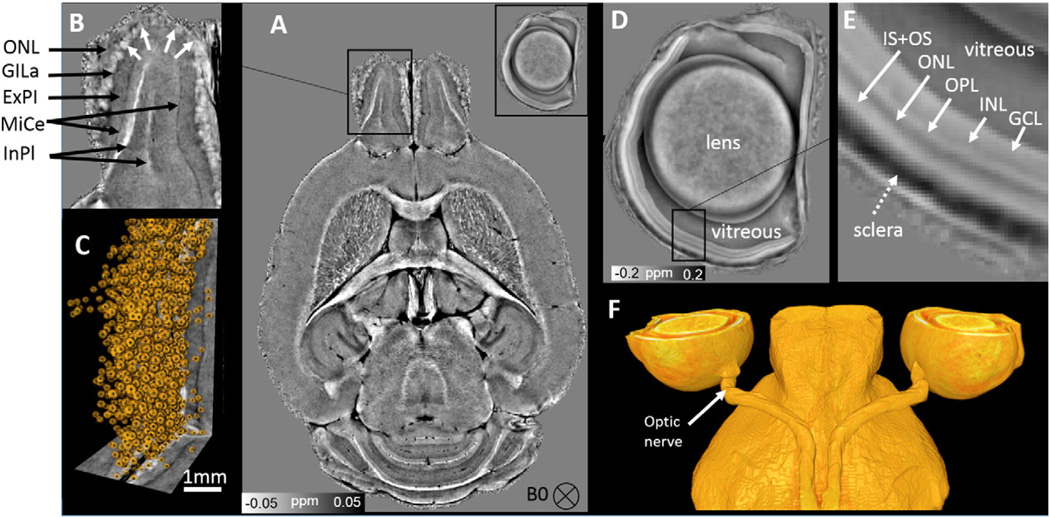
Individual olfactory glomeruli are revealed with QSM. The axons of the olfactory sensory neurons cover the outermost layer of the bulb, which forms the olfactory nerve layer (ONL in Fig. 3B). The glomerular layer (GlLa) consists of individual bright glomeruli in the olfactory (indicated by white arrows in Fig. 3B). Additional layers revealed by QSM include the mitral cell layer (MiCe), the external plexiform (ExPl), and the internal plexiform (InPl). Here, the mitral cell layer appears to be more paramagnetic, while the internal plexiform is more diamagnetic. The segmentation results of the glomeruli are shown in Fig. 3C. The diameters of the segmented spheres were 171 ± 13 µm. We detected an average number of 1690 glomeruli measured in two mouse brains. This is comparable to ~1800 glomeruli previously reported in the entire olfactory bulb of the adult mouse brain (Royet et al., 1988).
Fig. 3.
A: Susceptibility map shows olfactory bulb layers and retina layers. B: Magnification of the olfactory bulb in (A). GlLa: glomerular layer; ExPl: external plexiform layer; MiCe: mitral cell layer; InPl: internal plexiform layer. C: The glomeruli structure in the olfactory bulb represented by spherical volume. D: Susceptibility of the eye ball. E: Multiple distinct retinal layers (solid arrows) of alternating between bright and dark bands. GCL: ganglion cell layer; INL: inner nuclear layers; OPL: outer plexiform layer; ONL: outer nuclear layer; IS + OS: inner and outer photoreceptor segment. F: 3D volume rendering of the eye ball. It shows the optic nerve connecting the eye ball and the brain.
Eye ball structure with distinctive retina layers is clearly visible with QSM (Fig. 3D–F). The retina reveals multiple distinct “layers” as indicated by alternating bright and dark bands (Fig. 3E). Different layers exhibit relative different magnetic susceptibility values. Outer nuclear layer (ONL) yields a relative more paramagnetic susceptibility than other layers and vitreous. While the inner nuclear layers (INL) yields a relative less paramagnetic susceptibility than ONL. The 3D rendering structure shows that the optic nerve connects the eye ball to the brain (Fig. 3F).
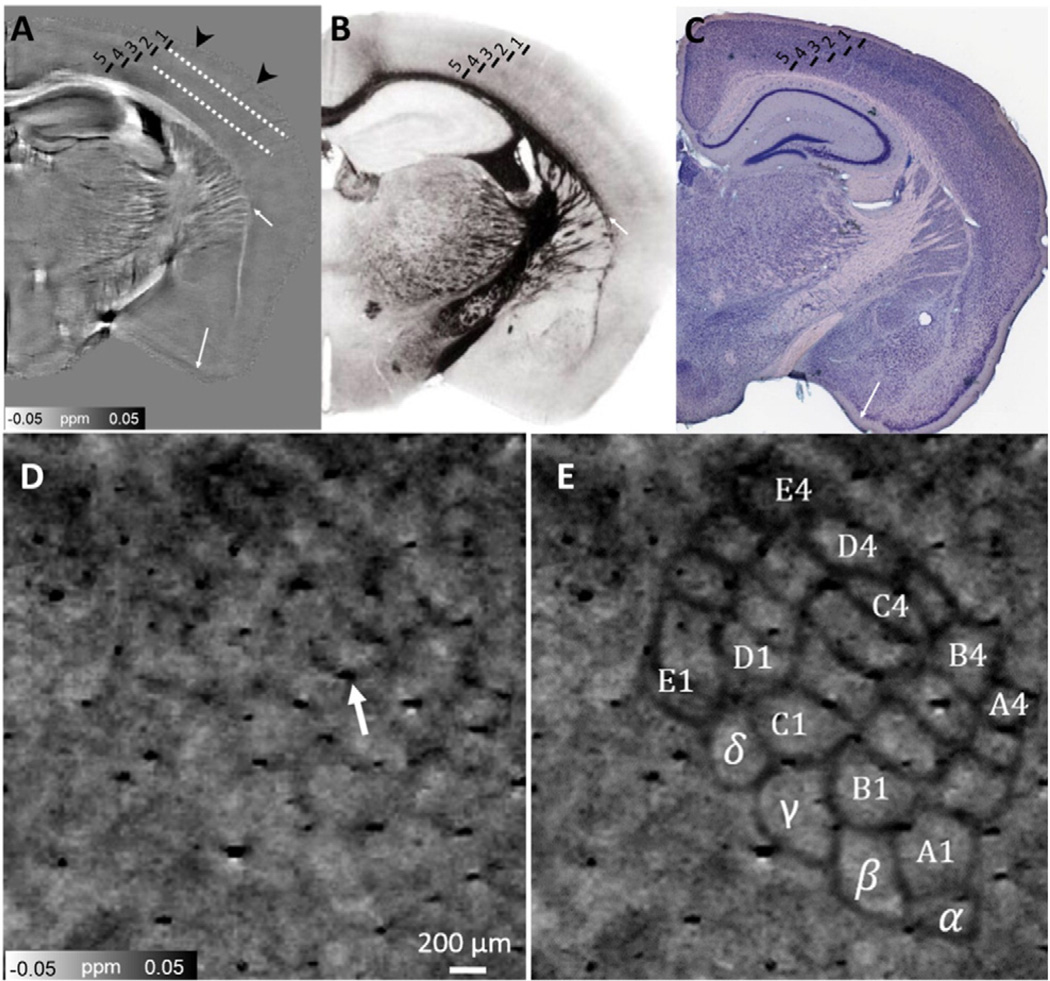
Up to five layers in the visual cortical area were distinguishable by their different magnetic susceptibility values (Fig. 4A). QSM studies of human brain cortex have indicated that this varying susceptibility values are results of varying concentrations of iron and myelin (Bagnato et al., 2011; Duyn et al., 2007). Histologically defined layers based on myelin staining (the Loyez method) (Cook, 1974) show a similar pattern as QSM (Fig. 4B). For example, layer 2 is more diamagnetic than layer 1 since it has more myelin resulting from more densely packed cortical fibers. QSM reveals highly similar structural information to myelin staining (Fig. 4B) and Giemsa stain (Fig. 4C) as indicated by white arrows. In addition, the barrel cortex, an important substructure in only a part of the cortex, is demonstrated by QSM. By tangentially cutting brain section to the cortical surface from the pia to the white matter (dash line in Fig. 4A), the distinct barrel structure arrangement is clearly revealed with QSM (Fig. 4D & E). A larger cortical field of view showing the barrel cortex field is illustrated in Fig. S3 in the Supplementary material. Overall, the barrel walls exhibit a paramagnetic susceptibility while barrel hollows show a relative diamagnetic susceptibility (Fig. 4D & E). This barrel arrangement is consistent with histologic studies (Petersen, 2007) and diffusion MRI studies (Kurniawan et al., 2014) of the mouse brain. We calculated the mean susceptibility of barrel hollows within 24 barrel columns (α–δ, A1–A4) and the septa/wall between them with the average susceptibility of −0.04 ± 0.02 ppm and 0.03 ± 0.02 ppm for the barrel hollows and septa, respectively. The barrels are then manually segmented and the Euclidean distance of the barrel cortex between C1–D1, C1–E1, C1–C2, and D1–D2 are 320 µm, 600 µm, 270 µm and 220 µm, respectively. Similar results were obtained from the track density imaging of the mice with the values of 346±29 µm, 590 ± 34 µm, 244 ± 9 µm, 243 ± 18, respectively (Kurniawan et al., 2014).
Fig. 4.
Susceptibility map (A) of cortical layers and in comparison to myelin stained areas with different neuronal density (B) and a Giemsa stain containing different level of iron storage in the neuronal cell body (C). Fig. 4B has the author's permission to include myelin image 286 from Sidman, R.L., Kosaras, B., Misra, B.M. and Senft, S.L.: High Resolution Mouse Brain Atlas. 1999 (http://www.hms.harvard.edu/research/brain). Fig. 4C was reproduced with permission (http://brainmaps.org/ajax-viewer.php?datid=116&sname=3d2). Tangential view of the neuron somata in the vibrissal cortex revealed by magnetic susceptibility. D: QSM image revealed the distinct barrel structure arrangement. Individual barrels can be seen as diamagnetic areas while the boundaries (septa/wall) can be seen as paramagnetic areas. E: Manually drawn black lines indicate the individual barreloids within 24 barrel columns (α–δ, A1–A4). Arrow in Fig. 4D indicates the blood vessel in cortex.
Both major and small white matter tracts are reconstructed from the susceptibility maps as shown in Fig. 5A. Certain gray matter regions that possess unique susceptibility contrast patterns could also be resolved, e.g. the striatum (Fig. 5B). An example of 3D susceptibility-reconstructed striatal tracts is shown in Fig. 5C & D. The structures of MSN are complex with frequent branches as indicated by red arrows in Fig. 5B & D. The radii of the skeleton tract is color coded from 5 µm (dark blue) to 20 µm (red), which is consistent with the previous studies on the size of striatal MSN (Matamales et al., 2009).
The distinctive hippocampus structure is identified by QSM (Fig. 5E & F). The stratum pyramidale (SP) and the V-shaped dentate gyrus (DG) regions exhibit a paramagnetic susceptibility with respect to surrounding tissues. The molecular layer (mldg), granule cell layer (gldg), and polymorphic cell layer (podg) of the DG can be clearly differentiated. Granule cell layer (gldg) appears more paramagnetic than the molecular layer (mldg) and polymorphic cell layer (podg). The stratum oriens (so), stratum radiatum (sr), and stratum lacunosum-moleculare (slm) can be distinguished from each other with QSM. The observed QSM contrast is highly consistent with the Giemsa stain result at 0.46 µm/pixel resolution (Fig. 5F). Giemsa stain is used to visualize chromosomes. It is specific for the phosphate groups of DNA and it attaches to locations of DNA where there are high amounts of adenine–thymine bonding. In eukaryotic cells, chromosomes are found in the cell nucleus; therefore Giemsa stain is also an indication of cell density. Since neuronal and glia cell body contains high levels of iron storage proteins, stronger Giemsa stain kind of indicates more paramagnetic susceptibility. For example, the susceptibility exhibits a gradually increased value from so to s due to the increase cell density.
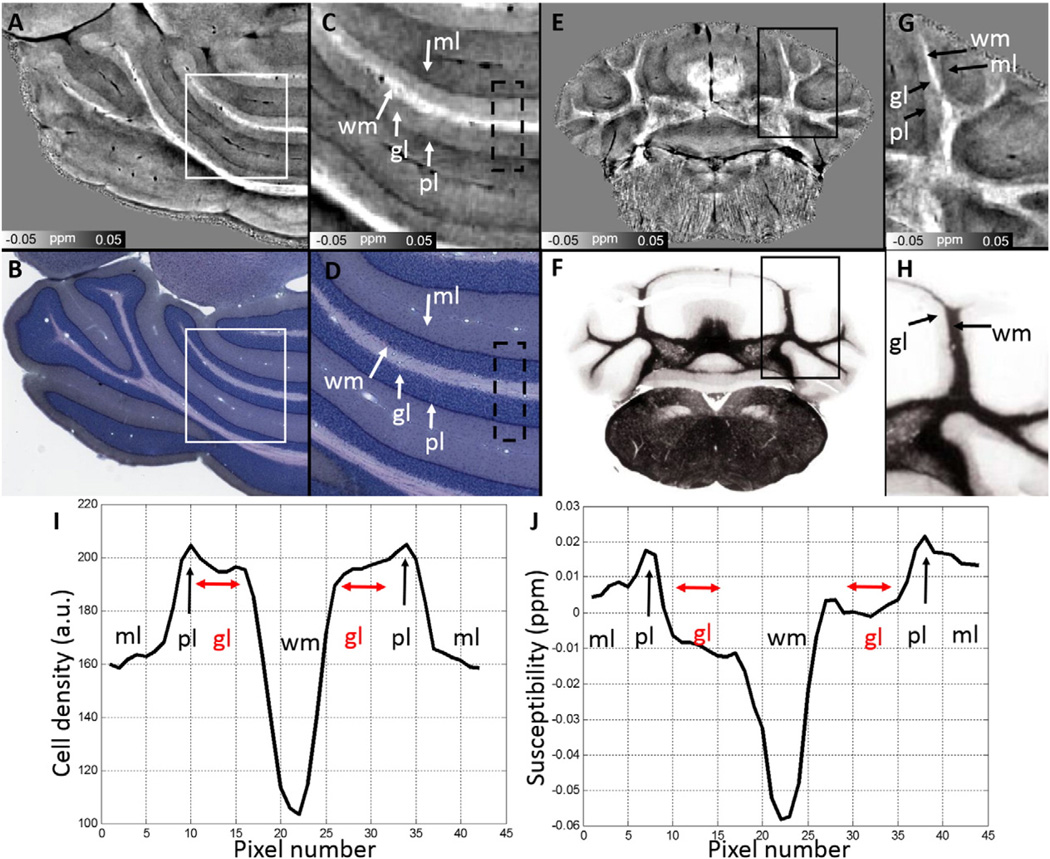
The dramatic cerebellar cortical layers are visible with QSM in Fig. 6. Next to white matter, the innermost granular layer (gl, diamagnetic) is followed by the thin Purkinje layer (pl) and molecular layer (ml). QSM demonstrates the delineation of the dark Purkinje layer (pl, more paramagnetic) and the slightly brighter granular layer (gl, more diamagnetic). Nevertheless, the identified cerebellar cortical structure is supported by Giemsa stain (Fig. 6B & D) and myelin stain (Fig. 6F). On Giemsa stain (Fig. 6B & D), the granular layer is more heavily stained compared to the molecular layer indicating a denser neuronal cell body, thus more iron, in the granular layer. However, the susceptibility of granular layer appears somewhat more diamagnetic (gl, marked by red color in Fig. 6J) than the molecular layer, contradictory to the indication by Giemsa stain (Fig. 6I). This discrepancy is due to the higher myelination in the granular layer compared to the molecular layer, as indicated by arrows in Fig.6H.
Fig. 6.
Susceptibility map of cerebellum (A, C, E & G) and comparison to a corresponding Giemsa stain (B & D) at 0.46 µm/pixel resolution and myelin stain (F & H). C and D are the zoomed images from the corresponding white boxes in A and B, respectively. Note that brighter white matter in C are diamagnetic and darker color in Giemsa stain in C & D indicates a denser cell body. G and H are the zoomed images from the corresponding black boxes in E and F, respectively. I and J are the averaged intensity values plotted along the vertical position within the dash line boxes in C and D, respectively. The profile in I is plotted from downsampled Giemsa stain by a factor of 20 to obtain the similar cell positions as those in susceptibility maps. gl: granular layer; ml: molecular layer; pl: Purkinje cell layer; wm: white matter. Fig. 6B & D was reproduced with permission (http://brainmaps.org/index.php?action=viewslides&datid=115). Fig. 6F was reproduced with author's permission from image 496 of Sidman, R.L., Kosaras, B., Misra, B.M. and Senft, S.L.: High Resolution Mouse Brain Atlas. 1999 (http://www.hms.harvard.edu/research/brain).
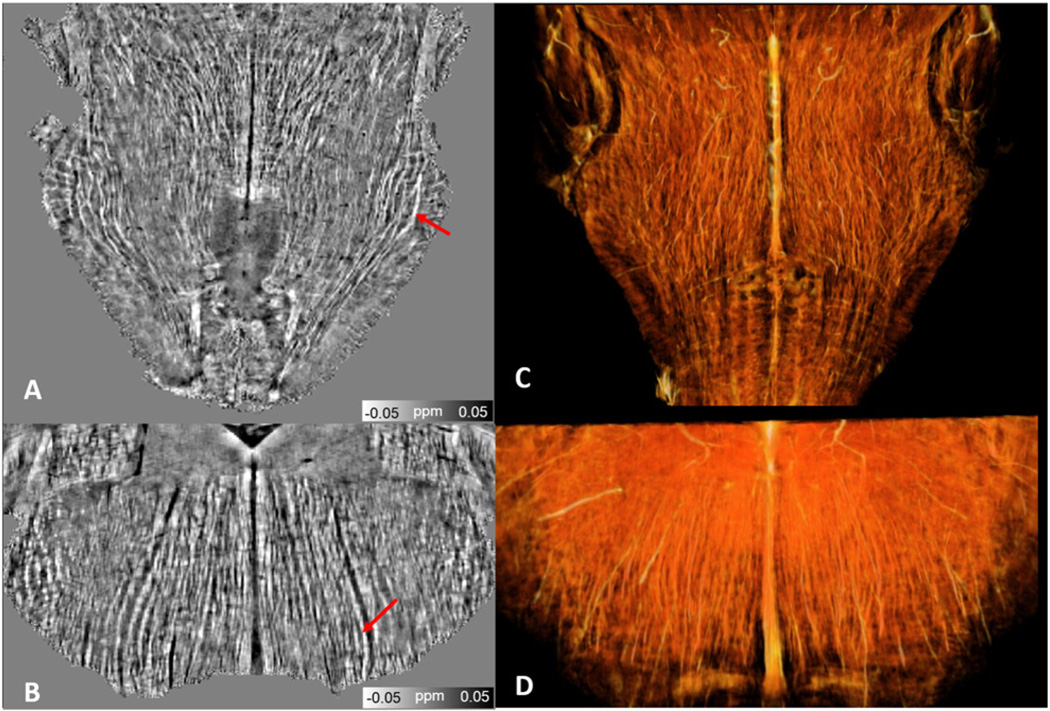
Fig. 7 shows the 3D reconstruction of the nerve fiber tracts in the brainstem. The displayed QSM maps show that neuronal fibers exhibit diamagnetic susceptibility as indicated by red arrows both in the axial and coronal slice views (Fig. 7A & B). The 3D neurons fiber tracts provide us the opportunity to analyze the network integrity of nerves.
Fig. 7.
Brainstem nerve tracts revealed by susceptibility maps (A & B) and 3D volume rendering (C & D).
Discussion
In this study, we demonstrate the utility of QSM in visualizing the cytoarchitecture of the mouse brain based on MRI phase images acquired at a 10-µm nominal resolution. At this scale, we are approaching the classical MRI diffusion-limited resolution and are beginning to reach the scale of average cell diameters in the mouse brain. Moreover, such high resolution helps reduce the volume averaging that leads to ambiguity in fiber tracts. Indeed, anatomical maps are needed at different spatial resolutions to provide different kinds of information. Many aspects of structural delineation in gray and white matter regions can be done at 10 µm spatial resolution. For example, QSM at the resolution achieved here allows delineation of the olfactory bulb layers, retina layers, hippocampus, and cerebellum cell layers with whole brain coverage. The major contributors to magnetic susceptibility contrast in these tissues are related to the high iron concentration in the cell bodies, storage proteins and myelin (Duyn, 2013; Liu et al., 2015;Wang and Liu, 2015), as illustrated by the histological studies in Figs. 5 and 6. However, cell classification and axon projections appear to be best accomplished at a few microns (Gong et al., 2013) and synaptic organization in glomeruli in cerebellum are resolvable only by electron microscopy at sub-micron (Hajós, 2013). Fully resolving these cellular structures is beyond the capabilities of current MRI at the whole brain level. We demonstrate that complex structure information at the mesoscopic scale (~10 µm) can be extracted using dedicated MRI techniques such as high resolution QSM with higher contrast than conventional MRI.
QSM was able to delineate many more structures compared to traditional MRI techniques. For instance, QSM was able to resolve the putamen axon, barrel cortex arrangement, and the dorsal striatum. The dorsal striatumis of particular importance because it plays a pivotal role in modulating motor activity and higher cognitive function in cognition, decision-making, and reward perception (Rosen and Williams, 2001). Approximately 90% of all neurons in the striatum belong to an unusual type of inhibitory projection cell referred to as MSNs. The structures of MSN are known as complex with frequent branches. Current tools such as DTI, are not able to accurately track these structures because of such intrinsic complex structure. With the high structural resolution and contrast, QSM is able to easily resolve and delineate the spiny neurons in this region as shown in Fig. 5C & D. These structures can then be segmented using simple skeletonization and tree growing algorithms. Ultimately, the QSM map can be used to improve DTI fiber tracking at varying length scales. It provides the opportunity to analyze the small network of MSN in 3D.
The ability to map 3D brain cytoarchitecture more rapidly than conventional histological methods such as optical microscopy enables us to study changes in cytoarchitecture during development, aging or due to disease processes and genetic mutations. Such studies using previous methods would require acquiring and analyzing images collected at multiple time points and over more than one group of populations, which is prohibitive for conventional optical microscopy. In addition, high resolution QSM provides non-destructive, 3D isotropic image data that can be resliced and resampled, which can be particularly challenging with traditional electron microscopy.
The contrast and resolution provided by QSM-based cytoarchitecture also demands new innovation in image analysis. Existing atlas or region of interest (ROI) based analysis, while still applicable here, does not take full advantage of structural details revealed in our dataset. New techniques of analysis will be required to not only compare gross anatomical differences but also quantify medium-size cell localization such as striatum neurons.
The fine detailed magnetic susceptibility maps were achieved by an improved algorithm for solving an ill-posed inverse problem, providing the high quality susceptibility maps with negligible streaking artifacts. The superiority of the improved reconstruction method over LSQR (Li et al., 2011) and iLSQR (Li et al., 2015) methods is demonstrated in Fig. S4 in the Supplementary material. The contaminated cortical layers in the susceptibility map computed by LSQR and iLSQR were clearly visible in that of STAR-QSM. Magnetic susceptibility reflects subtle variations in tissue composition that were found to be consistent with histology as demonstrated with selected areas (Figs. 4–6). At 9.4 T, we have to average the acquisitions multiple times to achieve sufficient SNR. This noise level with a standard deviation of 0.47 was reduced by the averaging procedure and 0.11was reduced by denoising (as demonstrated by Fig. S4 in the Supplementary material). The number of averaging used in this study, 10, was an approximate number and a good compromise to the quality of susceptibility maps. Reconstruction using a reduced number of measurements is possible as illustrated (Fig. S6 in the Supplementary material). The scan time can be further reduced with the availability of even higher field strengths currently up to 21 T and with the use of superconducting RF coils (Black et al., 1993). At this resolution, noise in the signal is dominated by the electronic noise in the receiver which can be suppressed significantly by using high-temperature superconducting coils. Given the robustness of the GRE sequence (robust against eddy current and B1 inhomogeneity), we thus further anticipate that imaging magnetic susceptibility may provide a powerful tool for studying animal models of structure at cytoarchitecture resolution.
The exact resolution of the reconstructed susceptibility maps is difficult to quantify for two main reasons. First, susceptibility mapping involves regularized deconvolution process which renders the resolution calculation non-trivial. Second, denoising the phase images further complicates the quantification of spatial resolution, even though the cortical layer structures are apparently not impacted by the denoising procedure. Specifically, we have applied a denoising procedure on the 3D filtered tissue phase via the cube matching method (Maggioni et al., 2013). The cube size influences the result and should be adapted to σ (σ2 is denoted as the noise variation). For low values of σ, a smaller cube size should to be well adapted to the details. For large values of σ, a larger window size is better. This is because most of the details of the image are lost in noise. However, a large window size will increase high computational complexity since most of the computational cost is spent on the cube matching procedure. Considering the noise level and computation time, a cube size of 5 is adapted as optimized in Maggioni et al. (2013) for denoising the magnetic resonance data. The Haar wavelet was used for decomposition in the grouping dimension as the default setting. Other transforms also can be used since the choice of transformdoes not have a significant impact on the denoising performance, as illustrated in Table II in ref. by Dabov et al. (2007). This transform-domain denoising method assumes that the true signal can be well approximated by a linear combination of few basis elements. Hence, by preserving the few high-magnitude transform coefficients that convey mostly true-signal energy and discarding the rest which are mainly due to noise, the true signal can be effectively estimated. By attenuating the noise, this filtering reveals fine details and preserves the essential unique features compared to those without filtering. The original magnitude, susceptibility map, and the corresponding denoised estimations are shown in Fig. S2 in the Supplementary material. All the detailed structures with sharp edges are well-preserved in the estimates, e.g. the eye ball layers, hippocampus, and cerebellum cell layers.
White matter structures in the brain exhibit susceptibility anisotropy. Axon fiber bundles that are oriented perpendicular to the applied magnetic field appear more diamagnetic than when the bundles are oriented parallel to the field (Liu, 2010; Liu et al., 2015). In this study, the specimen was scanned with the long axis (rostral–caudal axis) of the mouse brain oriented perpendicular to the main magnetic field direction. Such setup was used to increase the number of these axon fiber bundles that are perpendicular or nearly perpendicular to the applied field (Jiang and Johnson, 2010). This maximizes the contrast between white and gray matter structures. This orientation is routinely used in ex vivo QSM of the mouse brain (Argyridis et al., 2014; Dibb et al., 2014). In addition, the specimens were perfused with Gd contrast agents, such as ProHance, in order to improve the SNR of susceptibility maps and increase susceptibility contrast between white and gray matter (Dibb et al., 2014). Dibb et al. show that this effect is relatively linear as a function of Gd concentration, and provide a model explaining that the contrast increase may be due to the compartmentalization of Gd into the extracellular space in the white matter. This is because Gd cannot pass through the myelin sheath. This increases contrast by making the white matter appear relatively more diamagnetic (Dibb et al.). Furthermore, Gd is useful for shortening scan times by reducing T1 relaxation time which allows a much shorter TR (Johnson et al., 2002). This strategy is important for achieving high resolution in a relatively shorter acquisition time.
Conclusions
In this study, we demonstrate the utility of QSM in visualizing the microstructure of the intact mouse brain at a 10-µm resolution. QSM at near cellular resolution provides an exquisite delineation of brain microstructure, which overcomes limitations of current imaging methodologies. QSM offers a tool to assess the brain cytoarchitecture and the dataset achieved can serve as a reference for quantitative analysis of mouse brain microstructure.
Supplementary Material
Acknowledgments
This study was supported in part by the National Institutes of Health through grants NIBIB P41EB015897, NIBIB T32EB001040, NIMH R01MH096979, NINDS R01-NS079653, NIMH R24MH106096 and NHLBI R21HL122759, and by the National Multiple Sclerosis Society through grant RG4723.
Footnotes
Appendix A. Supplementary data
Supplementary data to this article can be found online at http://dx.doi.org/10.1016/j.neuroimage.2016.05.033.
References
- Abduljalil AM, Schmalbrock P, Novak V, Chakeres DW. Enhanced gray and white matter contrast of phase susceptibility-weighted images in ultra-high-field magnetic resonance imaging. J. Magn. Reson. Imaging. 2003;18:284–290. doi: 10.1002/jmri.10362. [DOI] [PubMed] [Google Scholar]
- Argyridis I, Li W, Johnson GA, Liu C. Quantitative magnetic susceptibility of the developing mouse brain reveals microstructural changes in the white matter. Neuroimage. 2014;88:134–142. doi: 10.1016/j.neuroimage.2013.11.026. [DOI] [PMC free article] [PubMed] [Google Scholar]
- Bagnato F, Hametner S, Yao B, van Gelderen P, Merkle H, Cantor FK, Lassmann H, Duyn JH. Tracking iron in multiple sclerosis: a combined imaging and histopathological study at 7 Tesla. Brain. 2011;134:3602–3615. doi: 10.1093/brain/awr278. [DOI] [PMC free article] [PubMed] [Google Scholar]
- Benner EJ, Luciano D, Jo R, Abdi K, Paez-Gonzalez P, Sheng H, Warner DS, Liu C, Eroglu C, Kuo CT. Protective astrogenesis from the SVZ niche after injury is controlled by Notch modulator Thbs4. Nature. 2013;497:369–373. doi: 10.1038/nature12069. [DOI] [PMC free article] [PubMed] [Google Scholar]
- Bilgic B, Pfefferbaum A, Rohlfing T, Sullivan EV, Adalsteinsson E. MRI estimates of brain iron concentration in normal aging using quantitative susceptibility mapping. Neuroimage. 2012;59:2625–2635. doi: 10.1016/j.neuroimage.2011.08.077. [DOI] [PMC free article] [PubMed] [Google Scholar]
- Black R, Early T, Roemer P, Mueller O, Mogro-Campero A, Turner L, Johnson GA. A high-temperature superconducting receiver for nuclear magnetic resonance microscopy. Science. 1993;259:793–795. doi: 10.1126/science.8430331. [DOI] [PubMed] [Google Scholar]
- Carpenter KL, Li W, Wei H, Wu B, Xiao X, Liu C, Worley G, Egger HL. Magnetic susceptibility of brain iron is associated with childhood spatial IQ. Neuroimage. 2016;132:167–174. doi: 10.1016/j.neuroimage.2016.02.028. [DOI] [PMC free article] [PubMed] [Google Scholar]
- Cook HC. Manual of Histological Demonstration Techniques. Butterworth–Heinemann; 1974. [Google Scholar]
- Dabov K, Foi A, Katkovnik V, Egiazarian K. Image denoising by sparse 3-D transform-domain collaborative filtering. IEEE Trans. Image Process. 2007;16:2080–2095. doi: 10.1109/tip.2007.901238. [DOI] [PubMed] [Google Scholar]
- Dibb R, Li W, Cofer G, Liu C. Microstructural origins of gadolinium-enhanced susceptibility contrast and anisotropy. Magn. Reson. Med. 2014;72:1702–1711. doi: 10.1002/mrm.25082. [DOI] [PMC free article] [PubMed] [Google Scholar]
- Dodt H-U, Leischner U, Schierloh A, Jährling N, Mauch CP, Deininger K, Deussing JM, Eder M, Zieglgänsberger W, Becker K. Ultramicroscopy: three-dimensional visualization of neuronal networks in the whole mouse brain. Nat. Methods. 2007;4:331–336. doi: 10.1038/nmeth1036. [DOI] [PubMed] [Google Scholar]
- Duyn J. MR susceptibility imaging. J. Magn. Reson. 2013;229:198–207. doi: 10.1016/j.jmr.2012.11.013. [DOI] [PMC free article] [PubMed] [Google Scholar]
- Duyn JH, van Gelderen P, Li T-Q, de Zwart JA, Koretsky AP, Fukunaga M. High-field MRI of brain cortical substructure based on signal phase. Proc. Natl. Acad. Sci. 2007;104:11796–11801. doi: 10.1073/pnas.0610821104. [DOI] [PMC free article] [PubMed] [Google Scholar]
- Fields RD, Woo DH, Basser PJ. Glial regulation of the neuronal connectome through local and long-distant communication. Neuron. 2015;86:374–386. doi: 10.1016/j.neuron.2015.01.014. [DOI] [PMC free article] [PubMed] [Google Scholar]
- Geisert EE, Williams RW, Geisert GR, Fan L, Asbury AM, Maecker HT, Deng J, Levy S. Increased brain size and glial cell number in CD81-null mice. J. Comp. Neurol. 2002;453:22–32. doi: 10.1002/cne.10364. [DOI] [PubMed] [Google Scholar]
- Gong H, Zeng S, Yan C, Lv X, Yang Z, Xu T, Feng Z, Ding W, Qi X, Li A. Continuously tracing brain-wide long-distance axonal projections in mice at a one-micron voxel resolution. Neuroimage. 2013;74:87–98. doi: 10.1016/j.neuroimage.2013.02.005. [DOI] [PubMed] [Google Scholar]
- Hajós F. Electron Microscopy: A Guide and Safeguard. Metabolic Compartmentation and Neurotransmission: Relation to Brain Structure and Function. 2013;6:403. [Google Scholar]
- Halliday GM, Watson C, Koutcherov Y, Wang H. Atlas of the Developing Mouse Brain at E17.5, P0 and P6. Elsevier Science & Technology; 2007. [Google Scholar]
- He X, Yablonskiy DA. Biophysical mechanisms of phase contrast in gradient echo MRI. Proc. Natl. Acad. Sci. 2009;106:13558–13563. doi: 10.1073/pnas.0904899106. [DOI] [PMC free article] [PubMed] [Google Scholar]
- Jaermann T, Pruessmann K, Valavanis A, Kollias S, Boesiger P. Influence of SENSE on image properties in high-resolution single-shot echo-planar DTI. Magn. Reson. Med. 2006;55:335–342. doi: 10.1002/mrm.20769. [DOI] [PubMed] [Google Scholar]
- Jiang Y, Johnson GA. Microscopic diffusion tensor imaging of the mouse brain. Neuroimage. 2010;50:465–471. doi: 10.1016/j.neuroimage.2009.12.057. [DOI] [PMC free article] [PubMed] [Google Scholar]
- Johnson GA, Cofer GP, Gewalt SL, Hedlund LW. Morphologic phenotyping with MR microscopy: the visible mouse 1. Radiology. 2002;222:789–793. doi: 10.1148/radiol.2223010531. [DOI] [PubMed] [Google Scholar]
- Kurniawan ND, Richards KL, Yang Z, She D, Ullmann JF, Moldrich RX, Liu S, Yaksic JU, Leanage G, Kharatishvili I. Visualization of mouse barrel cortex using ex-vivo track density imaging. Neuroimage. 2014;87:465–475. doi: 10.1016/j.neuroimage.2013.09.030. [DOI] [PubMed] [Google Scholar]
- Lee J, Shmueli K, Kang B-T, Yao B, Fukunaga M, van Gelderen P, Palumbo S, Bosetti F, Silva AC, Duyn JH. The contribution of myelin to magnetic susceptibility-weighted contrasts in high-field MRI of the brain. Neuroimage. 2012;59:3967–3975. doi: 10.1016/j.neuroimage.2011.10.076. [DOI] [PMC free article] [PubMed] [Google Scholar]
- Lein ES, Hawrylycz MJ, Ao N, Ayres M, Bensinger A, Bernard A, Boe AF, Boguski MS, Brockway KS, Byrnes EJ. Genome-wide atlas of gene expression in the adult mouse brain. Nature. 2007;445:168–176. doi: 10.1038/nature05453. [DOI] [PubMed] [Google Scholar]
- Li X, van Zijl P. Mean magnetic susceptibility regularized susceptibility tensor imaging (MMSR-STI) for estimating orientations of white matter fibers in human brain. Magn. Reson. Med. 2014;72:610–619. doi: 10.1002/mrm.25322. [DOI] [PMC free article] [PubMed] [Google Scholar]
- Li W, Wu B, Liu C. Quantitative susceptibility mapping of human brain reflects spatial variation in tissue composition. Neuroimage. 2011;55:1645–1656. doi: 10.1016/j.neuroimage.2010.11.088. [DOI] [PMC free article] [PubMed] [Google Scholar]
- Li W, Wang N, Yu F, Han H, Cao W, Romero R, Tantiwongkosi B, Duong TQ, Liu C. A method for estimating and removing streaking artifacts in quantitative susceptibility mapping. Neuroimage. 2015;108:111–122. doi: 10.1016/j.neuroimage.2014.12.043. [DOI] [PMC free article] [PubMed] [Google Scholar]
- Liu C. Susceptibility tensor imaging. Magn. Reson. Med. 2010;63:1471–1477. doi: 10.1002/mrm.22482. [DOI] [PMC free article] [PubMed] [Google Scholar]
- Liu C, Li W, Wu B, Jiang Y, Johnson GA. 3D fiber tractography with susceptibility tensor imaging. Neuroimage. 2012;59:1290–1298. doi: 10.1016/j.neuroimage.2011.07.096. [DOI] [PMC free article] [PubMed] [Google Scholar]
- Liu T, Wisnieff C, Lou M, Chen W, Spincemaille P, Wang Y. Nonlinear formulation of the magnetic field to source relationship for robust quantitative susceptibility mapping. Magn. Reson. Med. 2013;69:467–476. doi: 10.1002/mrm.24272. [DOI] [PubMed] [Google Scholar]
- Liu C, Li W, Tong KA, Yeom KW, Kuzminski S. Susceptibility-weighted imaging and quantitative susceptibility mapping in the brain. J. Magn. Reson. Imaging. 2014;42:23–41. doi: 10.1002/jmri.24768. [DOI] [PMC free article] [PubMed] [Google Scholar]
- Liu C, Wei H, Gong N-J, Cronin M, Dibb R, Decker K. Quantitative susceptibility mapping: contrast mechanisms and clinical applications. Tomography. 2015;1:3–17. doi: 10.18383/j.tom.2015.00136. [DOI] [PMC free article] [PubMed] [Google Scholar]
- Magavi SS, Leavitt BR, Macklis JD. Induction of neurogenesis in the neocortex of adult mice. Nature. 2000;405:951–955. doi: 10.1038/35016083. [DOI] [PubMed] [Google Scholar]
- Maggioni M, Katkovnik V, Egiazarian K, Foi A. Nonlocal transform-domain filter for volumetric data denoising and reconstruction. IEEE Trans. Image Process. 2013;22:119–133. doi: 10.1109/TIP.2012.2210725. [DOI] [PubMed] [Google Scholar]
- Marques JP, Maddage R, Mlynarik V, Gruetter R. On the origin of the MR image phase contrast: an in vivo MR microscopy study of the rat brain at 14.1 T. Neuroimage. 2009;46:345–352. doi: 10.1016/j.neuroimage.2009.02.023. [DOI] [PubMed] [Google Scholar]
- Matamales M, Bertran-Gonzalez J, Salomon L, Degos B, Deniau J-M, Valjent E, Hervé D, Girault J-A. Striatal medium-sized spiny neurons: identification by nuclear staining and study of neuronal subpopulations in BAC transgenic mice. PLoS One. 2009;4:e4770. doi: 10.1371/journal.pone.0004770. [DOI] [PMC free article] [PubMed] [Google Scholar]
- Peng T, Balijepalli A, Gupta SK, LeBrun T. Algorithms for on-line monitoring of micro spheres in an optical tweezers-based assembly cell. J. Comput. Inf. Sci. Eng. 2007;7:330–338. [Google Scholar]
- Petersen CC. The functional organization of the barrel cortex. Neuron. 2007;56:339–355. doi: 10.1016/j.neuron.2007.09.017. [DOI] [PubMed] [Google Scholar]
- Rauscher A, Sedlacik J, Barth M, Mentzel H-J, Reichenbach JR. Magnetic susceptibility-weighted MR phase imaging of the human brain. Am. J. Neuroradiol. 2005;26:736–742. [PMC free article] [PubMed] [Google Scholar]
- Rosen GD, Williams RW. Complex trait analysis of the mouse striatum: independent QTLs modulate volume and neuron number. BMC Neurosci. 2001;2:5. doi: 10.1186/1471-2202-2-5. [DOI] [PMC free article] [PubMed] [Google Scholar]
- Royet J, Souchier C, Jourdan F, Ploye H. Morphometric study of the glomerular population in the mouse olfactory bulb: numerical density and size distribution along the rostrocaudal axis. J. Comp. Neurol. 1988;270:559–568. doi: 10.1002/cne.902700409. [DOI] [PubMed] [Google Scholar]
- Schweser F, Deistung A, Lehr BW, Reichenbach JR. Differentiation between diamagnetic and paramagnetic cerebral lesions based on magnetic susceptibility mapping. Med. Phys. 2010;37:5165–5178. doi: 10.1118/1.3481505. [DOI] [PubMed] [Google Scholar]
- Spruston N. Pyramidal neurons: dendritic structure and synaptic integration. Nat. Rev. Neurosci. 2008;9:206–221. doi: 10.1038/nrn2286. [DOI] [PubMed] [Google Scholar]
- Steinbusch HWM. Distribution of serotonin-immunoreactivity in the central nervous system of the rat—cell bodies and terminals. Neuroscience. 1981;6:557–618. doi: 10.1016/0306-4522(81)90146-9. [DOI] [PubMed] [Google Scholar]
- Wang Y, Liu T. Quantitative susceptibility mapping (QSM): decoding MRI data for a tissue magnetic biomarker. Magn. Reson. Med. 2015;73:82–101. doi: 10.1002/mrm.25358. [DOI] [PMC free article] [PubMed] [Google Scholar]
- Wei H, Dibb R, Zhou Y, Sun Y, Xu J, Wang N, Liu C. Streaking artifact reduction for quantitative susceptibility mapping of sources with large dynamic range. NMR Biomed. 2015;28:1294–1303. doi: 10.1002/nbm.3383. [DOI] [PMC free article] [PubMed] [Google Scholar]
- Wei H, Zhang Y, Gibbs E, Chen NK, Wang N, Liu C. Joint 2D and 3D phase processing for quantitative susceptibility mapping: application to 2D echo-planar imaging. NMR Biomed. 2016 doi: 10.1002/nbm.3501. [DOI] [PubMed] [Google Scholar]
- Wu B, Li W, Guidon A, Liu C. Whole brain susceptibility mapping using compressed sensing. Magn. Reson. Med. 2012;67:137–147. doi: 10.1002/mrm.23000. [DOI] [PMC free article] [PubMed] [Google Scholar]
- Wu D, Xu J, McMahon MT, van Zijl PC, Mori S, Northington FJ, Zhang J. In vivo high-resolution diffusion tensor imaging of the mouse brain. Neuroimage. 2013;83:18–26. doi: 10.1016/j.neuroimage.2013.06.012. [DOI] [PMC free article] [PubMed] [Google Scholar]
- Xie L, Cianciolo RE, Hulette B, Lee HW, Qi Y, Cofer G, Johnson GA. Magnetic resonance histology of age-related nephropathy in the Sprague Dawley rat. Toxicol. Pathol. 2012;40:764–778. doi: 10.1177/0192623312441408. [DOI] [PMC free article] [PubMed] [Google Scholar]
- Xie L, Dibb R, Cofer GP, Li W, Nicholls PJ, Johnson GA, Liu C. Susceptibility tensor imaging of the kidney and its microstructural underpinnings. Magn. Reson. Med. 2015;73:1270–1281. doi: 10.1002/mrm.25219. [DOI] [PMC free article] [PubMed] [Google Scholar]
Associated Data
This section collects any data citations, data availability statements, or supplementary materials included in this article.


