

Abstract
Human γδ T-cells possess regulatory and cytotoxic capabilities, and could potentially influence the efficacy of immunotherapies. We analyzed the frequencies of peripheral γδ T-cells, including their most prominent subsets (Vδ1+ and Vδ2+ cells) and differentiation-states in 109 melanoma patients and 109 healthy controls. We additionally analyzed the impact of γδ T-cells on overall survival (OS) calculated from the first dose of ipilimumab in melanoma patients. Higher median frequencies of Vδ1+ cells and lower median frequencies of Vδ2+ cells were identified in patients compared to healthy subjects (Vδ1+: 30% vs. 15%, Vδ2+: 39% vs. 64%; both p<0.001). Patients with higher frequencies of Vδ1+ cells (≥30%) had poorer OS (p=0.043) and a Vδ1+ differentiation-signature dominated by late-differentiated phenotypes. In contrast, higher frequencies of Vδ2+ cells (≥39%) were associated with longer survival (p=0.031) independent of the M category or lactate dehydrogenase (LDH) level. Patients with decreasing frequencies of Vδ2+ cells under ipilimumab treatment had worse OS and a lower rate of clinical benefit than patients without such decreases. Therefore, we suggest frequencies of both Vδ1+ and Vδ2+ cells as candidate biomarkers for outcome in melanoma patients following ipilimumab. Further studies are needed to validate these results and to clarify whether they represent prognostic associations or whether γδ T-cells are specifically and/or functionally linked to the mode of action of ipilimumab.
Keywords: γδ T-cells, melanoma, ipilimumab, biomarker, survival, immunotherapy
Introduction
Immunotherapy with checkpoint inhibitors set a milestone in the treatment of melanoma. Ipilimumab, an inhibitory anti-Cytotoxic T-Lymphocyte Antigen-4 (CTLA-4) antibody, was the first agent proven to prolong overall survival (OS) of melanoma patients in a randomized controlled trial setting (1, 2). However, response rates of only approximately 10–20% and a risk of severe side effects (3) require careful evaluation of which patients might benefit from treatment with ipilimumab.
The identification of prognostic, or preferably predictive, biomarkers to support treatment decisions is highly desirable at the present time. Serum lactate dehydrogenase levels (LDH) (4–7), frequencies of circulating myeloid-derived suppressor cells (MDSC) (7, 8) and/or the abundance of tumor antigen-reactive T-cells (9, 10) have strong prognostic relevance in melanoma. Immunosurveillance of tumor cells is likely to involve both subsets of αβ T-cells, for example CD4+ T helper cell induction of cellular senescence via IFN-γ secretion (11), and CD8+ T-cell mediated killing of tumor cells (12).
Less attention has been paid thus far to the numerically minor compartment of T-cells expressing the γδ isoform of the T-cell receptor (TCR). These non-MHC-restricted T-cells comprising 1–10% of peripheral T-cells possess features of both innate and adaptive immunity (13, 14). The majority of circulating γδ T-cells carries the δ2 chain, with usually only a minority expressing the δ1 chain (15). Cells expressing other δ chains are rare (16). Vδ1+ cells are prominently associated with viral infections, especially with Cytomegalovirus (17, 18) but their role in tumor-immunity is controversial (19).
Vδ2+ cells are notably involved in immunity against bacterial infections and tumors (20). Thus, Vδ2+ cells have been utilized in the past decade in anticancer immunotherapy (21). These cells may be naturally stimulated by the release of phospholipids such as isopentenylpyrophosphate (IPP) from malignant cells (22, 23) or hydroxymethylbutenylpyrophosphate (HMB-PP) by bacteria (20). Clinical responses and increased frequencies of Vδ2+ cells were observed after application of synthetic bisphosphonates and low doses of IL-2 in non-Hodgkin lymphoma/multiple myeloma (24) and prostate cancer (25). An alternative approach is the adoptive transfer of in vitro-activated Vδ2+ cells as demonstrated in a small cohort of renal cell carcinoma patients (26).
The role of γδ T-cells in melanoma is poorly understood thus far. These cells do infiltrate primary melanomas, suggesting that they may be exerting anti-tumor activity (27). Only a few studies have reported alterations in frequencies and functional impairment of peripheral γδ T-cells in melanoma patients compared to healthy controls but there is as yet no consensus on this (28–30). In a pilot study, we recently identified the frequency of circulating Vδ1+ γδ T-cells as a negative prognostic marker candidate for advanced melanoma patients (31). In contrast, tumor-infiltrating Vδ1+ cells were reported to have a positive impact on survival of melanoma patients (32). Vδ2+ cells were decreased in the peripheral blood and had impaired functionality in melanoma compared to healthy controls in a study by Petrini et al. (29).
The aim of the present study was to investigate the role of γδ T-cells in melanoma patients treated with ipilimumab. Frequencies of γδ T-cells in the peripheral blood at baseline and changes after starting treatment were analyzed for their potential association with OS. Healthy individuals served as controls to investigate melanoma-associated alterations of γδ T-cells.
Materials & Methods
Melanoma patients
Cryopreserved peripheral blood mononuclear cells (PBMC) from blood draws within 4 weeks prior to initiation of ipilimumab treatment, and the relevant clinical data, were provided by six centers (Table 1). Additional PBMC samples from later time points during and after treatment were provided from 33 patients. Uveal or mucosal melanomas were excluded. Clinical responses were categorized as complete response (CR), partial response (PR), stable disease (SD) or progressive disease (PD) according to the immune-related response criteria (irRC) (33). Clinical benefit was defined for patients experiencing CR, PR or SD as the best achieved response from the start of ipilimumab treatment to the date of progressive disease or start of a new systemic treatment. All tumor assessments within this time period were considered.
Table 1.
Patient characteristics
| Variable | Category | Patients (n=109) |
|
|---|---|---|---|
| n | % | ||
| Center | Amsterdam | 36 | 33 |
| Essen | 11 | 10 | |
| Lausanne | 9 | 8 | |
| Nantes | 3 | 3 | |
| Naples | 16 | 15 | |
| New York | 34 | 31 | |
| Gender | Male | 67 | 61 |
| Female | 42 | 39 | |
| Age | 28 – 40 years | 14 | 13 |
| 41 – 60 years | 45 | 41 | |
| 61 – 70 years | 25 | 23 | |
| 71 – 89 years | 25 | 23 | |
| Median age | 58 years | ||
| Number of doses | 1 | 4 | 4 |
| 2 | 6 | 6 | |
| 3 | 13 | 12 | |
| 4 | 86 | 79 | |
| LDH | Elevated | 45 | 41.3 |
| Normal | 62 | 56.9 | |
| Unknown | 2 | 1.8 | |
| Visceral involvement | Soft tissue | 15 | 13.8 |
| Lung | 25 | 22.9 | |
| Other organs | 69 | 63.3 | |
| M category (AJCC) | M1a | 11 | 10.3 |
| M1b | 19 | 17.8 | |
| M1c | 77 | 72.0 | |
| Unknown | 2 | ||
| Treatment background | CA-184-169 (3 or 10 mg/kg) | 3 | 2.8 |
| Early access program (3 mg/kg) | 50 | 45.9 | |
| Regular prescription (3 mg/kg) | 56 | 51.4 | |
| Clinical response (irRC) | Complete response | 4 | 3.9 |
| Partial response | 23 | 22.5 | |
| Stable disease | 13 | 12.7 | |
| Progressive disease | 62 | 60.8 | |
| Unknown | 7 | ||
The prognostic impact of frequencies at baseline and follow up of other immune cell subsets was reported by us in partially overlapping cohorts (7, 34). All patients gave their written and informed consent for biobanking, and use of biomaterials and clinical data for scientific purposes. This study was approved by the Ethics Committee, University Medical Center Tübingen (approval 524/201B01).
Healthy controls
Cryopreserved PBMC samples (n=109) from participants of the Berlin Aging Study II (BASE-II) (35) were randomly selected and used as a healthy control cohort after exclusion of individuals with a history of cancer. Subjects participated in the BASE-II study with written informed consent and the approval of the Ethics Committee of the Charité-Universitätsmedizin Berlin (approval EA2/029/09).
Flow Cytometry
Cryopreserved PBMC samples were immediately stained with monoclonal antibodies after thawing for the markers of interest, as described in our OMIP-20 panel publication (36). Briefly, a pan-γδ TCR antibody identified γδ T-cells within CD3+ T-cells. The γδ T-cell compartment was further subdivided via antibodies against the δ1 and the δ2 isoform of their TCR followed by the identification of differentiation-phenotypes within these subsets. Data were acquired on an LSR-II flow cytometer (Becton Dickinson). Compensation was automatically performed with single color controls by FACS-DIVA software 6.1.3 (Becton Dickinson). A biological control from the same frozen batch of local control PBMC was included in each analytical run to ensure comparability between results from different runs. We found that cryopreservation did not significantly alter the frequencies of Vδ1+ and Vδ2+ cells relative to their values in freshly-isolated non-cryopreserved samples (Figure A1). Analysis of the resulting data was performed with FlowJo 10.0.7 (Tree Star). A threshold of minimum 100 events was set for subset analysis of a population. The gating strategy is displayed in Figure A2. All patient and control samples were centrally processed and analyzed in Tübingen.
Statistics
Disease-specific survival probabilities were estimated using the Kaplan-Meier method and compared by log rank testing. Only deaths due to melanoma were considered, whereas deaths due to other reasons were censored. The analysis initially included the frequency of total γδ T-cells among all CD3+ T-cells, as well as the proportion of the 3 subsets Vδ1+, Vδ2+, Vδ1−Vδ2− among total γδ T-cells. Patients were dichotomized according to their median frequencies of the cell subsets for analysis of associations of baseline values with patients’ OS. The composition of the differentiation-signatures of Vδ1+ and Vδ2+ subsets were compared between two groups of patients stratified by median survival (≥9 months OS vs. <9 months OS) using the Mann-Whitney U-test in a second step. Associations of the proportions of Vδ1+ to Vδ2+ cells and correlations with clinical benefit were analyzed by Χ2 and Fisher’s exact tests (two-sided). Nonparametric Spearman correlations were used to test for correlations between the identified phenotypes. The Mann Whitney U-test was used to compare the frequencies of the populations of interest in patients vs. controls. Cox regression modeling and Wald tests were used to test the relative impact of biomarker candidates when analyzed together with other factors. Results were reported as hazard ratios (HRs). Wilcoxon-matched pairs tests were used to analyze changes in abundance of cell populations by comparing baseline to later time-points during and after treatment. Throughout the study, p-values <0.05 were considered statistically significant. Statistical testing was performed with SPSS 22 (IBM) and Prism 6.d (Graph Pad).
Results
Participants
γδ T-cells were investigated in 109 stage IV melanoma patients from six different clinical centers prior to the first administration of ipilimumab. Patient characteristics are presented in Table 1. The M category according to the American Joint Committee on Cancer (AJCC) classification (37) was M1c for the majority of patients (n=77). Thirty patients were staged as M1a or M1b, while no definite classification was possible for the remaining two. Median age was 58 years, 61% were male. The best clinical response after ipilimumab was available for 102 patients. Additional samples from blood draws during or after treatment were available for 33 of the 109 patients for investigation of treatment-associated alterations in cell distribution. Healthy controls (n=109) were used to investigate whether or not the abundance of γδ T-cell populations differs compared to melanoma patients. Among healthy controls, median age was 65 years and 38% were male.
Associations of γδ T-cell frequencies at baseline with overall survival
The median OS was 9 months after initiation of ipilimumab treatment. The percentage of total γδ T-cells among all CD3+ T-cells was found not to be associated with OS (Table 2). However, baseline frequencies of both Vδ1+ and Vδ2+ γδ T-cell subsets (CD3+γδTCR+Vδ1+; CD3+γδTCR+Vδ2+, respectively) within the total γδ T-cell compartment were correlated with patients’ OS applying dichotomization based on the median frequency (Figure 1; p=0.043, and p=0.031, respectively). Patients with <30% of circulating Vδ1+ cells had a median survival of 13 months, and a 1-year survival rate of 53.3%. Patients in the reciprocal group (≥30% of Vδ1+ cells) had a shorter median survival of only 8 months with a 1-year survival rate of 37.9% (p=0.043).
Table 2.
Univariate association of γδ T-cell phenotype frequencies with patients’ overall survival
| Total n | Categories | n | % | % dead | Survival analysis | ||||||
|---|---|---|---|---|---|---|---|---|---|---|---|
| Median survival (months) | 1-year survival rate (95% CI) | 2-year survival rate (95% CI) | p-value | ||||||||
| γδ T-cells/CD3+ T-cells | 109 | < 3 % | 53 | 48.6 | 71.7 | 8 | 43.0% | (29.5%; 56.5%) | 22.6% | (9.9%; 35.3%) | 0.517 |
| ≥ 3% | 56 | 51.4 | 75.0 | 10 | 47.9% | (34.8%; 61.0%) | 28.3% | (16.2%; 40.5%) | |||
| Vδ1+ cells/γδ T-cells | 109 | < 30 % | 54 | 49.5 | 64.8 | 13 | 53.3 % | (40.0%; 66.3%) | 32.6% | (19.1%; 46.1%) | 0.043 |
| ≥ 30% | 55 | 50.5 | 24.8 | 8 | 37.9% | (25.0%; 50.8%) | 17.8% | (7.0%; 28.6%) | |||
| Vδ2+ cells/γδ T-cells | 109 | < 39 % | 54 | 49.5 | 81.5 | 7 | 36.8% | (23.9%; 49.7%) | 18.4% | (7.2%; 29.6%) | 0.031 |
| ≥ 39% | 55 | 50.5 | 65.5 | 14 | 54.2% | (40.9%; 67.5%) | 31.7% | (18.4%; 45.0%) | |||
| Vδ1–Vδ2-cells/γδ T-cells | 109 | < 21% | 50 | 45.8 | 70.0 | 14 | 51.7% | (37.8%; 65.6%) | 33.2% | (19.5%; 46.9%) | 0.156 |
| ≥ 21% | 59 | 54.1 | 76.3 | 8 | 40.4% | (27.9%; 52.9%) | 18.1% | (7.1%; 29.1%) | |||
Figure 1. Significant associations with overall survival according to frequencies of major γδ T-cell subsets.
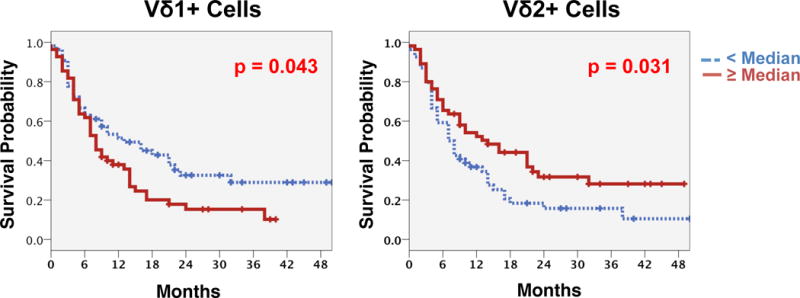
Frequencies of Vδ1+ cells (left) and Vδ2+ cells (right) within the total γδ T-cell compartment before start of ipilimumab were significantly correlated with patients’ OS. Kaplan Meier analysis with log rank estimation was used for statistical analysis. Vertical lines indicate censored events.
In contrast to the negative survival association of Vδ1+ cells, the peripheral blood frequencies of the Vδ2+ subset were positively associated with patients’ OS. Those patients with a Vδ2+ compartment ≥ the median frequency (≥39%) had a median OS of 14 months with a 1-year survival rate of 54.2%, whereas those with <39% of Vδ2+ cells had a shorter median survival of only 7 months and a 1-year survival rate of 36.8% (p=0.031). No correlations with survival were found for the proportion of Vδ1–Vδ2− cells (see overview in Table 2).
There was a strong inverse correlation between the proportions of Vδ1+ and Vδ2+ cells (Figure 2A: p<0.001, r=0.846), but no correlations were observed for the Vδ1–Vδ2− cells. Figure 2B displays the distribution of γδ T-cell subsets at baseline. Not only the abundance of Vδ1+ and Vδ2+ cells, but also the balance between both subsets at baseline was associated with prognosis. A predominance of Vδ2+ over Vδ1+ cells was observed in 61.4% of patients with better OS (survival of at least 9 months), whereas this was 41.2% among patients who died earlier (Figure 2B: p=0.053).
Figure 2. Correlations within the γδ T-cell subsets.
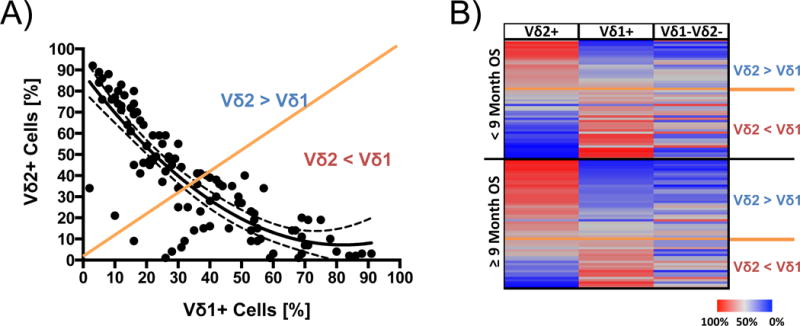
A) Frequencies of Vδ1+ cells correlate negatively with those of the Vδ2+ cell subset (r=0.846, p<0.0001). Correlation is indicated by a fitting curve (line) with the 95% confidence interval (dotted lines) B) Signature of the total γδ T-cell compartment (rows) in 108 patients (lines). One patient was censored because follow-up was less than 9 months. Patients were grouped according to median survival (≥9 months and <9 months OS) and graded in both groups after declining values for the Vδ1:Vδ2 proportions. Orange lines indicate an equilibrium of Vδ1+ and Vδ2+cells.
Next, we characterized the relative impact of Vδ1+ and Vδ2+ cells on OS in comparison to other factors. Due to the strong inverse correlation, Vδ2+ and Vδ1+ cells were not independently associated with OS in multivariate analysis if both phenotypes were considered in combination (HR=1.22, p=0.569 for Vδ1+ ≥median; HR=0.73, p=0.368 for Vδ2+ ≥median). Thus, we elaborated separate models for Vδ1+ and Vδ2+ subsets (Table 3).
Table 3.
Multivariate analysis of the Vδ1+ and Vδ2+ compartments
| Categories | Vδ2+ compartment | Vδ1+ compartment | |||||||
|---|---|---|---|---|---|---|---|---|---|
| Model 1 | Model 2 | Model 3 | Model 4 | ||||||
| HR | p | HR | p | HR | p | HR | p | ||
| Age | < 58 years | Not considered | 0.69 | 0.160 | Not considered | 0.73 | 0.225 | ||
| ≥ 58 years | |||||||||
| Gender | Male | Not considered | 1.35 | 0.26 | Not considered | 1.33 | 0.291 | ||
| Female | |||||||||
| LDH | Elevated | Not considered | 1.76 | 0.025 | Not considered | 1.83 | 0.015 | ||
| Normal | |||||||||
| Visceral involvement | Soft tissue | Not considered | 1.00 | 0.226 | Not considered | 1.00 | 0.335 | ||
| Lung | 1.45 | 0.417 | 1.40 | 0.458 | |||||
| Other organs | 1.90 | 0.115 | 1.77 | 0.168 | |||||
| M category (AJCC) | M1a/b | 1.68 | 0.048 | Not considered | 1.65 | 0.058 | Not considered | ||
| M1c | |||||||||
| Vδ1+ cells/γδ T-cells | < 30% | Not considered | Not considered | 1.54 | 0.057 | 1.48 | 0.104 | ||
| ≥ 30% | |||||||||
| Vδ2+ cells/γδ T-cells | < 39% | 0.62 | 0.034 | 0.61 | 0.043 | Not considered | Not considered | ||
| ≥ 39% | |||||||||
Vδ2+ cells and the M category were found to be independent prognostic factors. HRs were 0.62 for patients with high frequencies of Vδ2+ cells (p=0.034) and 1.68 for patients with M1c as compared to M1a/b (p=0.048) (Model 1). Model 2 identified the Vδ2+ cells and increased LDH levels as independent prognostic factors (HRs=0.61, p=0.043 for patients with high frequencies of Vδ2+ cells; HR=1.76, p=0.025 for patients with high LDH-levels), when accounting for various additional covariates. A strong trend towards an independent prognostic impact was also observed (Model 2) for higher frequencies of Vδ1+ cells (HR=1.54, p=0.057) in conjunction with the M category M1c (HR=1.65, p=0.058). Analysis of the Vδ1+ cells in model 4, which accounted for several additional covariates, showed that the LDH-level but not the Vδ1+ cell frequency was an independent predictor for OS (Table 3).
Next, we investigated whether subsequent treatments may confound OS associations in our study. No differences were observed according to subsequent therapy with BRAF/MEK inhibitors, or chemotherapy but OS was significantly longer in patients who received anti-PD-1/PD-L1 antibodies (Figure A3). Thus, confounding of our results by subsequent treatment with anti-PD-1/PD-L1 antibodies could not be excluded. However, despite the smaller sample size, we still observed a trend for the same associations between frequencies of Vδ1+ and Vδ2+ cells and OS when the analysis was limited to patients without subsequent anti-PD-1/PD-L1 therapy (Figure A4: p=0.096, Vδ1+; p=0.065 Vδ2+ cells).
There was no correlation between either the Vδ1+ or the Vδ2+ compartment and clinical benefit (p=0.312; p=0.317, respectively).
Differentiation phenotypes of the Vδ1+ and Vδ2+ T-cell subsets
The OS-associated Vδ1+ and Vδ2+ subsets were further characterized regarding their differentiation-stage through expression profiles of CD27, CD28, and CD45RA. Early- or late-differentiated subpopulations were defined by the CD27+CD28+CD45RA+, or the CD27−CD28−CD45RA+ phenotype, respectively. Intermediate-differentiated phenotypes were defined as CD27+CD28+CD45RA−, CD27−CD28+, CD27+CD28− and CD27−CD28−CD45RA−. The differentiation phenotype was analyzed separately for patients with high and low proportions of Vδ1+ or Vδ2+ cells (Vδ1+ ≥30% vs. <30%; Vδ2+ ≥39% vs. <39%) because of the observed differences in OS between these respective groups (Figure A5).
Only minor differences in the differentiation phenotype of Vδ2+ cells were observed comparing prognostically favorable patients with high and prognostically unfavorable patients with low abundance of total Vδ2+ cells (Figure A5 B). In contrast, there were strong variations in the proportions of differentiation phenotypes between the two prognostically distinguishable groups of patients for Vδ1+ cells (Figure A5 C). Patients with a Vδ1+ subset ≥ median had a significantly higher proportion of a late-differentiated phenotype (CD27−CD28−CD45RA+), whereas lower proportions of early-differentiated (CD27+CD28+CD45RA+) or intermediate-differentiated (CD27+CD28+CD45RA−, CD27+CD28−) phenotypes were observed compared to the patients with a low abundance of Vδ1+ cells (Figure A5 C: all p≤0.001). No CD27−CD28+ subpopulation was detectable in the Vδ1+ subset.
γδ T-cell frequencies in melanoma and healthy controls
Next, the frequencies of γδ T-cells were compared between patients and healthy individuals. No difference was found for the total γδ T-cell compartment (p=0.205). However, higher frequencies of Vδ1+ cells and lower frequencies of Vδ2+ cells were observed in patients compared to healthy subjects (median frequencies Vδ1+: 30% vs. 15% and Vδ2+: 39% vs. 64%; p<0.001 for both). For a comprehensive analysis, melanoma patients were divided into two prognostically different groups. Because the median survival according to Kaplan-Meier was 9 months for the entire cohort, the prognostically favorable groups comprised patients who survived at least 9 months after starting ipilimumab (n=57) while patients in the prognostically unfavorable group died earlier (n=51). One patient was censored within 9 months and was not considered here.
No differences were found comparing proportions of the total γδ T-cell compartment in healthy controls with the two groups of patients (Figure 3A). The median abundance of the Vδ1+ subset was 15% of all γδ T-cells in healthy donors as compared to 26% in the group of patients with ≥9 months OS and 36% in the group of patients with <9 months OS (Figure 3B: p=0.002; p<0.001 respectively). Among melanoma patients, those with a median OS ≥9 months had significantly lower frequencies of Vδ1+ cells compared to patients with a median OS of <9 months (p=0.029).
Figure 3. Comparison of γδ T-cell subset frequencies between healthy individuals and patients at baseline.
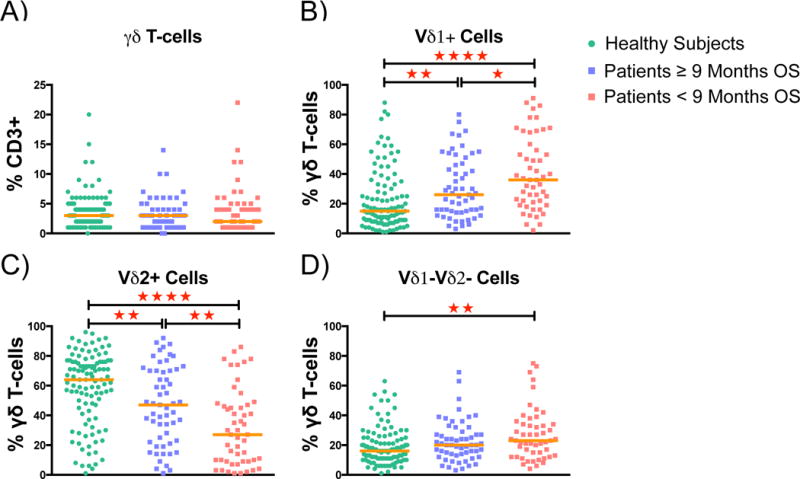
Patients were stratified into two balanced prognostic groups based on the median OS after starting ipilimumab (9 months). A) Frequencies of total γδ T-cells among all T-cells B) Proportions of Vδ1+, C) of Vδ2+ and D) of Vδ1–Vδ2− cells among the total γδ T-cells. Statistical evaluation was performed with Mann Whitney U test. Median is indicated for each group. Annotation: * p≤0.05 ; ** p≤0.005 ; *** p≤0.05 ; **** p≤0.0001
The median proportion of the Vδ2+ subset was 64% in healthy subjects compared to 47% in the group of patients with ≥9 months OS and 27% in the group of patients with <9 months OS (Figure 3C: p=0.005; p<0.001). Patients with a median OS ≥9 months had significantly higher frequencies of Vδ2+ cells than patients with a median OS of <9 months (p=0.004). Only minor differences between healthy controls and melanoma patients were observed for Vδ1−Vδ2-cells (Figure 3D).
Alterations of γδ T-cell frequencies during and after ipilimumab treatment
Next, changes of Vδ1+ and Vδ2+ frequencies at three time points during and after treatment with ipilimumab were analyzed relative to baseline in 33 patients with available follow-up samples. Early, intermediate, and later alterations were analyzed considering frequencies measured ≤21 days, 22–42 days or >42 days after initiation of ipilimumab, respectively.
Alterations during and after treatment in the Vδ1+ subset were found not to be associated neither with patients’ OS (Figure 4A) nor with clinical benefit (Figure A6). In contrast, a decrease of the Vδ2+ subset at an intermediate and/or later time-point was associated with poorer outcome (Figure 4B: p=0.039, p=0.007 and Table A1). Moreover, significant correlations with clinical benefit were identified for both time points for patients in the prognostically favorable group (Figure A6: p=0.006, intermediate; p=0.019, late). Patients with a median OS <9 months had a significant intermediate and later decline of the Vδ2+ subset (Figure A7: p=0.005, p=0.012 respectively) and a trend towards an increase of Vδ1+ cells (Figure A7: p=0.094). In contrast, no significant changes were observed in patients who survived at least 9 months or longer, neither in the Vδ1+ nor Vδ2+ subsets.
Figure 4. Prognostic impact of alterations in Vδ1+ and Vδ2+ cell frequencies after starting ipilimumab.
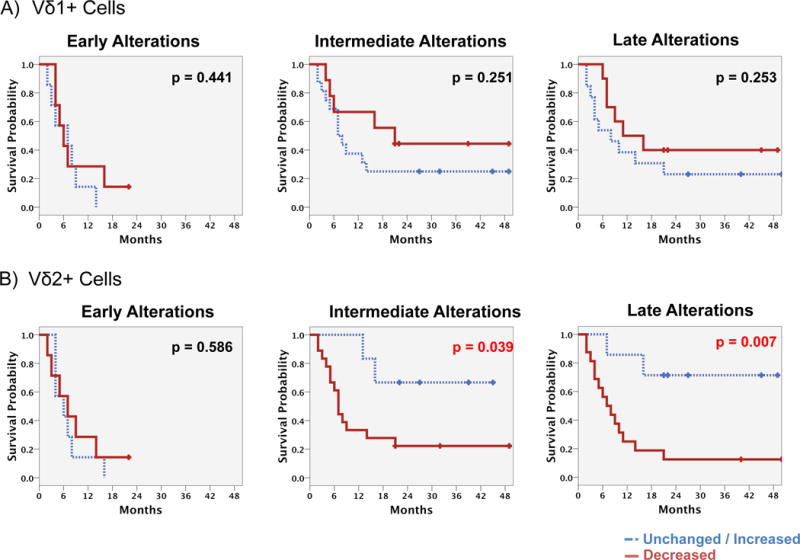
OS of patients with unchanged/decreased vs. increased frequencies of the Vδ2+ A) or the Vδ1+ B) cells was compared. Frequencies as analyzed after starting ipilimumab but before day 21 (early alterations – left), between days 22 and 42 (intermediate alterations) and after day 42 (late alterations) were compared to baseline findings. Kaplan Meier analysis with log rank estimation was used for statistical analysis. Vertical lines indicate censored events.
Discussion
In this study, we performed a detailed analysis of the peripheral γδ T-cell compartment in melanoma patients receiving ipilimumab. No impact on OS was observed according to the frequency of total γδ T-cells in the peripheral blood of melanoma patients, and their frequencies were similar to those of healthy controls. This latter finding is in accordance with previous studies by ourselves and others (29, 31), but both lower (28) and higher (30) abundance of total γδ T-cells in melanoma patients has also been reported. In contrast, the prognostic relevance of γδ T-cells as well as differences compared to healthy subjects became more evident when analyzing the abundance of the different γδ T-cell subsets separately (Vδ1+, Vδ2+ and Vδ1–Vδ2−).
The median frequency of Vδ1+ cells was lowest in the group of healthy subjects, higher in patients with an OS of at least 9 months and highest for patients with OS <9 months. Patients with higher frequencies of Vδ1+ cells had poorer survival as similarly shown in our pilot study (31). The Vδ1+ differentiation-signature in this group of patients was dominated by late-differentiated phenotypes. The latter finding is consistent with earlier work describing higher abundance of similarly defined late-differentiated γδ T-cells in melanoma (29, 30).
In contrast to Vδ1+ cells, the median frequency of Vδ2+ cells was highest for healthy controls, lower for patients with favorable survival and lowest for those who died within 9 months. Additionally, we identified a strong positive correlation of circulating Vδ2+ cells with patients’ OS in Kaplan Meier analysis. Similar to our prior study findings on CD4+ and CD8+ T-cells (34), unchanged or increasing frequencies of Vδ2+ cells at an intermediate and later time point after initiation of ipilimumab were associated with superior OS and a higher proportion of patients with clinical benefit. Reduced abundance of circulating Vδ2+ cells in melanoma patients has been reported before (28, 31). Baseline frequencies of Vδ2+ cells represent a promising predictive biomarker candidate, particularly due to their independent impact on OS in addition to established prognostic factors like the M category or LDH.
Functional investigations of γδ T-cells suggest an involvement of these cells in immune surveillance of cancer, including melanoma, in line with the clinical associations observed here. These unconventional T-cells can generally act as antigen-presenting cells, and directly prime adaptive immunity (38, 39). In melanoma, in vitro analysis of γδ T-cells revealed impaired functionality (28, 29) and poor proliferative capacity (28) after stimulation with bisphosphonates which target the Vδ2+, but not the Vδ1+ subset. Vδ2+ cells were reported to have immunoregulatory activity (40, 41). Moreover, these cells can produce large amounts of IFN-γ and/or TNF-α, reflecting their killing and immunomodulatory function in collaboration with other components of the immune system (42, 43).
The role of Vδ1+ cells in cancer immunology is poorly understood. Separating these heterogeneous cells into a cytotoxic and a regulatory sub-compartment might help to clarify the situation (19, 21, 44). Subsets of γδ T-cells with prominent innate-like IL-17-producing characteristics have been identified (γδ-Th17) and were reported to associate with tumor escape in breast cancer (45).
Intra-tumoral γδ-Th17 cells express the δ1 TCR isoform and were suggested to associate with expansion of MDSCs in colorectal cancer and to exert negative immunomodulatory effects (46). Taken together, several studies indicate that γδ T-cells can induce and facilitate both pro- and anti-tumor immune responses (47). Studies focusing on a tentative functional link between γδ T-cells and the mode of action of ipilimumab are urgently required.
Based on the results of our study and limited functional studies it is not clear whether the associations of the frequencies of circulating Vδ1+ or Vδ2+ cells with OS is prognostic for melanoma patients in general or predictive for outcome after treatment with ipilimumab.
Further prospective validation of our findings is needed to confirm and to more comprehensively characterize the impact, benefits and limitations of γδ T-cell analysis compared to other biomarkers in patients treated with ipilimumab and in other clinical situations, e.g. for prognosis of patients with distant metastasis. Potential confounding by prior treatments was not analyzed here and needs to be addressed in future studies. Because γδ T-cells can express PD-1 under certain conditions (48), the association between the frequency of these cells and outcome in patients treated with anti-PD1 antibodies also warrants further investigation.
Finally, mechanistic studies are needed to characterize the functional involvement of Vδ1+ and Vδ2+ cells in immune surveillance of melanoma and in the mode of action of ipilimumab. This is of particular interest as increasing and/or activating Vδ2+ cells in vivo is possible, for example by treatment with bisphosphonates such as zoledronate (19, 21, 49). The observed associations of Vδ2+ cells with OS provide a rationale to examine therapeutic interventions directed to the Vδ2+ cell subset in the preclinical setting.
We conclude that high frequencies of Vδ2+ cells and low frequencies of Vδ1+ cells are associated with favorable OS of melanoma patients receiving ipilimumab. Frequencies of Vδ1+ cells are higher in melanoma patients compared to healthy controls and no significant alterations were observed during ipilimumab treatment. In contrast, frequencies of Vδ2+ cells are lower in melanoma patients compared to healthy controls and decreased markedly during ipilimumab treatment in those patients who had a worse outcome. Vδ1+ and Vδ2+ cells represent novel biomarker candidates which need to be validated, and which also warrant further clinical investigation.
Supplementary Material
Highlights.
Frequencies of γδ T-cells are different in melanoma patients and controls
Higher Vδ2+ and lower Vδ1+ T-cell levels in blood are prognostic for survival
Decreasing Vδ2 cells during ipilimumab treatment is associated with poorer survival
Acknowledgments
D. Schadendorf reports receiving honoraria from GSK, Roche, BMS, Amgen, Novartis, MSD, speakers bureau honoraria from GSK, Roche, BMS, Amgen, Novartis, MSD, reports receiving a commercial research grant from MSD, travel/accommodations/expenses from GSK, Roche, BMS, Amgen, Novartis, MSD and is a consultant/advisory board member for GSK, Roche, BMS, Amgen, Novartis, MSD. C. Blank reports receiving honoraria from BMS, MSD, GSK, Roche, Novartis, and a commercial research grant from Novartis. J. D. Wolchok is a consultant/advisory board member for BMS, Merck and Genentech and reports receiving a commercial research grant from BMS, MSD and Genentech. M. A. Postow reports BMS advisory board participation, honoraria and a commercial research grant from BMS. J. Yuan reports receiving a commercial research grant from BMS. B. Schilling reports receiving a commercial research grant from BMS and travel/honoraria/accommodations/expenses from BMS. C. Garbe reports receiving honoraria from BMS, MSD, Amgen, Novartis, Roche, GSK, reports receiving a commercial research grant from MSD, BMS, Roche, GSK. B. Weide reports receiving a commercial research grant from BMS, reports receiving travel/accommodations/expenses from BMS, MSD, Roche, Philogen, Curevac and is a consultant/advisory board member for BMS, Philogen, Curevac. P. A. Ascierto reports commercial research grant from BMS, Roche, Ventana, and is a consultant/advisory board member for BMS, Roche, MSD, Ventana, Novartis, Amgen, Array. A. Khammari reports receiving travel/accommodations/expenses from BMS and Roche. G. Pawelec reports receiving honoraria from Pfizer, Cellgene, Clasada and Astellas. E. Steinhagen-Thiessen reports receiving honoraria from Amgen, Fresenius Medical Care, MSD and Sanofi and reports receiving honoraria from Amgen, Chiesi, MSD and Sanofi as a member of advisory boards. I. Demuth reports receiving honoraria as a consultant for uniQure biopharma B.V. B. Dreno reports receiving honoraria from BMS, Amgen, Roche, GSK and research grants from BMS and Roche.
Parts of this study were funded by Bristol-Myers-Squibb (Munich, Germany).
Parts of this study were funded by the EU Seventh Framework Program “PRIAT” (Profiling Responders In Antibody Therapies), grant agreement no 305309 and DFG PA 361-22/1 (to GP).
Parts of this study were funded by the German Federal Ministry of Education and Research (Bundesministerium für Bildung und Forschung, BMBF) under grant number 16SV5536K.
Footnotes
Publisher's Disclaimer: This is a PDF file of an unedited manuscript that has been accepted for publication. As a service to our customers we are providing this early version of the manuscript. The manuscript will undergo copyediting, typesetting, and review of the resulting proof before it is published in its final citable form. Please note that during the production process errors may be discovered which could affect the content, and all legal disclaimers that apply to the journal pertain.
Conflicts of Interest
No potential conflicts of interest were disclosed by the other authors
References
- 1.Robert C, Thomas L, Bondarenko I, O’Day S, Weber J, Garbe C, et al. Ipilimumab plus dacarbazine for previously untreated metastatic melanoma. N Engl J Med. 2011;364(26):2517–26. doi: 10.1056/NEJMoa1104621. [DOI] [PubMed] [Google Scholar]
- 2.Hodi FS, O’Day SJ, McDermott DF, Weber RW, Sosman JA, Haanen JB, et al. Improved survival with ipilimumab in patients with metastatic melanoma. N Engl J Med. 2010;363(8):711–23. doi: 10.1056/NEJMoa1003466. [DOI] [PMC free article] [PubMed] [Google Scholar]
- 3.Schadendorf D, Hodi FS, Robert C, Weber JS, Margolin K, Hamid O, et al. Pooled Analysis of Long-Term Survival Data From Phase II and Phase III Trials of Ipilimumab in Unresectable or Metastatic Melanoma. J Clin Oncol. 2015;33(17):1889–94. doi: 10.1200/JCO.2014.56.2736. [DOI] [PMC free article] [PubMed] [Google Scholar]
- 4.Kelderman S, Heemskerk B, van Tinteren H, van den Brom RR, Hospers GA, van den Eertwegh AJ, et al. Lactate dehydrogenase as a selection criterion for ipilimumab treatment in metastatic melanoma. Cancer Immunol Immunother. 2014;63(5):449–58. doi: 10.1007/s00262-014-1528-9. [DOI] [PMC free article] [PubMed] [Google Scholar]
- 5.Delyon J, Mateus C, Lefeuvre D, Lanoy E, Zitvogel L, Chaput N, et al. Experience in daily practice with ipilimumab for the treatment of patients with metastatic melanoma: an early increase in lymphocyte and eosinophil counts is associated with improved survival. Ann Oncol. 2013;24(6):1697–703. doi: 10.1093/annonc/mdt027. [DOI] [PubMed] [Google Scholar]
- 6.Di Giacomo AM, Danielli R, Calabro L, Bertocci E, Nannicini C, Giannarelli D, et al. Ipilimumab experience in heavily pretreated patients with melanoma in an expanded access program at the University Hospital of Siena (Italy) Cancer Immunol Immunother. 2011;60(4):467–77. doi: 10.1007/s00262-010-0958-2. [DOI] [PMC free article] [PubMed] [Google Scholar]
- 7.Martens A, Wistuba-Hamprecht K, Geukes Foppen MH, Yuan J, Postow MA, Wong P, et al. Baseline peripheral blood biomarkers associated with clinical outcome of advanced melanoma patients treated with ipilimumab. Clin Cancer Res. 2016 doi: 10.1158/1078-0432.CCR-15-2412. [DOI] [PMC free article] [PubMed] [Google Scholar]
- 8.Meyer C, Cagnon L, Costa-Nunes CM, Baumgaertner P, Montandon N, Leyvraz L, et al. Frequencies of circulating MDSC correlate with clinical outcome of melanoma patients treated with ipilimumab. Cancer Immunol Immunother. 2014;63(3):247–57. doi: 10.1007/s00262-013-1508-5. [DOI] [PMC free article] [PubMed] [Google Scholar]
- 9.Weide B, Martens A, Zelba H, Stutz C, Derhovanessian E, Di Giacomo AM, et al. Myeloid-derived suppressor cells predict survival of patients with advanced melanoma: comparison with regulatory T cells and NY-ESO-1- or melan-A-specific T cells. Clin Cancer Res. 2014;20(6):1601–9. doi: 10.1158/1078-0432.CCR-13-2508. [DOI] [PubMed] [Google Scholar]
- 10.Weide B, Zelba H, Derhovanessian E, Pflugfelder A, Eigentler TK, Di Giacomo AM, et al. Functional T cells targeting NY-ESO-1 or Melan-A are predictive for survival of patients with distant melanoma metastasis. J Clin Oncol. 2012;30(15):1835–41. doi: 10.1200/JCO.2011.40.2271. [DOI] [PubMed] [Google Scholar]
- 11.Braumuller H, Wieder T, Brenner E, Assmann S, Hahn M, Alkhaled M, et al. T-helper-1-cell cytokines drive cancer into senescence. Nature. 2013;494(7437):361–5. doi: 10.1038/nature11824. [DOI] [PubMed] [Google Scholar]
- 12.Kvistborg P, Shu CJ, Heemskerk B, Fankhauser M, Thrue CA, Toebes M, et al. TIL therapy broadens the tumor-reactive CD8(+) T cell compartment in melanoma patients. Oncoimmunology. 2012;1(4):409–418. doi: 10.4161/onci.18851. [DOI] [PMC free article] [PubMed] [Google Scholar]
- 13.Holtmeier W, Kabelitz D. gammadelta T cells link innate and adaptive immune responses. Chem Immunol Allergy. 2005;86:151–83. doi: 10.1159/000086659. [DOI] [PubMed] [Google Scholar]
- 14.Vantourout P, Hayday A. Six-of-the-best: unique contributions of gammadelta T cells to immunology. Nat Rev Immunol. 2013;13(2):88–100. doi: 10.1038/nri3384. [DOI] [PMC free article] [PubMed] [Google Scholar]
- 15.Porcelli S, Brenner MB, Band H. Biology of the human gamma delta T-cell receptor. Immunol Rev. 1991;120:137–83. doi: 10.1111/j.1600-065x.1991.tb00591.x. [DOI] [PubMed] [Google Scholar]
- 16.Chien YH, Meyer C, Bonneville M. gammadelta T cells: first line of defense and beyond. Annu Rev Immunol. 2014;32:121–55. doi: 10.1146/annurev-immunol-032713-120216. [DOI] [PubMed] [Google Scholar]
- 17.Wistuba-Hamprecht K, Haehnel K, Janssen N, Demuth I, Pawelec G. Peripheral blood T-cell signatures from high-resolution immune phenotyping of gammadelta and alphabeta T-cells in younger and older subjects in the Berlin Aging Study II. Immun Ageing. 2015;12:25. doi: 10.1186/s12979-015-0052-x. [DOI] [PMC free article] [PubMed] [Google Scholar]
- 18.Dechanet J, Merville P, Berge F, Bone-Mane G, Taupin JL, Michel P, et al. Major expansion of gammadelta T lymphocytes following cytomegalovirus infection in kidney allograft recipients. J Infect Dis. 1999;179(1):1–8. doi: 10.1086/314568. [DOI] [PubMed] [Google Scholar]
- 19.Silva-Santos B, Serre K, Norell H. gammadelta T cells in cancer. Nat Rev Immunol. 2015;15(11):683–91. doi: 10.1038/nri3904. [DOI] [PubMed] [Google Scholar]
- 20.Hayday AC. {gamma}{delta} cells: a right time and a right place for a conserved third way of protection. Annu Rev Immunol. 2000;18:975–1026. doi: 10.1146/annurev.immunol.18.1.975. [DOI] [PubMed] [Google Scholar]
- 21.Kobayashi H, Tanaka Y. gammadelta T Cell Immunotherapy-A Review. Pharmaceuticals (Basel) 2015;8(1):40–61. doi: 10.3390/ph8010040. [DOI] [PMC free article] [PubMed] [Google Scholar]
- 22.Gober HJ, Kistowska M, Angman L, Jeno P, Mori L, De Libero G. Human T cell receptor gammadelta cells recognize endogenous mevalonate metabolites in tumor cells. J Exp Med. 2003;197(2):163–8. doi: 10.1084/jem.20021500. [DOI] [PMC free article] [PubMed] [Google Scholar]
- 23.Kabelitz D, Kalyan S, Oberg HH, Wesch D. Human Vdelta2 versus non-Vdelta2 gammadelta T cells in antitumor immunity. Oncoimmunology. 2013;2(3):e23304. doi: 10.4161/onci.23304. [DOI] [PMC free article] [PubMed] [Google Scholar]
- 24.Wilhelm M, Kunzmann V, Eckstein S, Reimer P, Weissinger F, Ruediger T, et al. Gammadelta T cells for immune therapy of patients with lymphoid malignancies. Blood. 2003;102(1):200–6. doi: 10.1182/blood-2002-12-3665. [DOI] [PubMed] [Google Scholar]
- 25.Dieli F, Vermijlen D, Fulfaro F, Caccamo N, Meraviglia S, Cicero G, et al. Targeting human {gamma]delta} T cells with zoledronate and interleukin-2 for immunotherapy of hormone-refractory prostate cancer. Cancer Res. 2007;67(15):7450–7. doi: 10.1158/0008-5472.CAN-07-0199. [DOI] [PMC free article] [PubMed] [Google Scholar]
- 26.Kobayashi H, Tanaka Y, Yagi J, Osaka Y, Nakazawa H, Uchiyama T, et al. Safety profile and anti-tumor effects of adoptive immunotherapy using gamma-delta T cells against advanced renal cell carcinoma: a pilot study. Cancer Immunol Immunother. 2007;56(4):469–76. doi: 10.1007/s00262-006-0199-6. [DOI] [PMC free article] [PubMed] [Google Scholar]
- 27.Yazdi AS, Morstedt K, Puchta U, Ghoreschi K, Flaig MJ, Rocken M, et al. Heterogeneity of T-cell clones infiltrating primary malignant melanomas. J Invest Dermatol. 2006;126(2):393–8. doi: 10.1038/sj.jid.5700082. [DOI] [PubMed] [Google Scholar]
- 28.Argentati K, Re F, Serresi S, Tucci MG, Bartozzi B, Bernardini G, et al. Reduced number and impaired function of circulating gamma delta T cells in patients with cutaneous primary melanoma. J Invest Dermatol. 2003;120(5):829–34. doi: 10.1046/j.1523-1747.2003.12141.x. [DOI] [PubMed] [Google Scholar]
- 29.Petrini I, Pacini S, Galimberti S, Taddei MR, Romanini A, Petrini M. Impaired function of gamma-delta lymphocytes in melanoma patients. Eur J Clin Invest. 2011;41(11):1186–94. doi: 10.1111/j.1365-2362.2011.02524.x. [DOI] [PubMed] [Google Scholar]
- 30.Campillo JA, Martinez-Escribano JA, Minguela A, Lopez-Alvarez R, Marin LA, Garcia-Alonso AM, et al. Increased number of cytotoxic CD3+ CD28− gammadelta T cells in peripheral blood of patients with cutaneous malignant melanoma. Dermatology. 2007;214(4):283–8. doi: 10.1159/000100878. [DOI] [PubMed] [Google Scholar]
- 31.Wistuba-Hamprecht K, Di Benedetto S, Schilling B, Sucker A, Schadendorf D, Garbe C, et al. Phenotypic characterization and prognostic impact of circulating gammadelta and alphabeta T-cells in metastatic malignant melanoma. Int J Cancer. 2016;138(3):698–704. doi: 10.1002/ijc.29818. [DOI] [PubMed] [Google Scholar]
- 32.Bialasiewicz AA, Ma JX, Richard G. Alpha/beta- and gamma/delta TCR(+) lymphocyte infiltration in necrotising choroidal melanomas. Br J Ophthalmol. 1999;83(9):1069–73. doi: 10.1136/bjo.83.9.1069. [DOI] [PMC free article] [PubMed] [Google Scholar]
- 33.Wolchok JD, Hoos A, O’Day S, Weber JS, Hamid O, Lebbe C, et al. Guidelines for the evaluation of immune therapy activity in solid tumors: immune-related response criteria. Clin Cancer Res. 2009;15(23):7412–20. doi: 10.1158/1078-0432.CCR-09-1624. [DOI] [PubMed] [Google Scholar]
- 34.Martens A, Wistuba-Hamprecht K, Yuan J, Postow MA, Wong P, Capone M, et al. Increases in absolute lymphocytes and circulating CD4+ and CD8+ T cells are associated with positive clinical outcome of melanoma patients treated with ipilimumab. Clin Cancer Res. 2016 doi: 10.1158/1078-0432.CCR-16-0249. [DOI] [PMC free article] [PubMed] [Google Scholar]
- 35.Bertram L, Bockenhoff A, Demuth I, Duzel S, Eckardt R, Li SC, et al. Cohort profile: The Berlin Aging Study II (BASE-II) Int J Epidemiol. 2014;43(3):703–12. doi: 10.1093/ije/dyt018. [DOI] [PubMed] [Google Scholar]
- 36.Wistuba-Hamprecht K, Pawelec G, Derhovanessian E. OMIP-020: phenotypic characterization of human gammadelta T-cells by multicolor flow cytometry. Cytometry A. 2014;85(6):522–4. doi: 10.1002/cyto.a.22470. [DOI] [PubMed] [Google Scholar]
- 37.Balch CM, Gershenwald JE, Soong SJ, Thompson JF, Atkins MB, Byrd DR, et al. Final version of 2009 AJCC melanoma staging and classification. J Clin Oncol. 2009;27(36):6199–206. doi: 10.1200/JCO.2009.23.4799. [DOI] [PMC free article] [PubMed] [Google Scholar]
- 38.Himoudi N, Morgenstern DA, Yan M, Vernay B, Saraiva L, Wu Y, et al. Human gammadelta T lymphocytes are licensed for professional antigen presentation by interaction with opsonized target cells. J Immunol. 2012;188(4):1708–16. doi: 10.4049/jimmunol.1102654. [DOI] [PubMed] [Google Scholar]
- 39.Muto M, Baghdadi M, Maekawa R, Wada H, Seino K. Myeloid molecular characteristics of human gammadelta T cells support their acquisition of tumor antigen-presenting capacity. Cancer Immunol Immunother. 2015;64(8):941–9. doi: 10.1007/s00262-015-1700-x. [DOI] [PMC free article] [PubMed] [Google Scholar]
- 40.Wesch D, Peters C, Siegers GM. Human gamma delta T regulatory cells in cancer: fact or fiction? Front Immunol. 2014;5:598. doi: 10.3389/fimmu.2014.00598. [DOI] [PMC free article] [PubMed] [Google Scholar]
- 41.Peters C, Oberg HH, Kabelitz D, Wesch D. Phenotype and regulation of immunosuppressive Vdelta2-expressing gammadelta T cells. Cell Mol Life Sci. 2014;71(10):1943–60. doi: 10.1007/s00018-013-1467-1. [DOI] [PMC free article] [PubMed] [Google Scholar]
- 42.Thedrez A, Sabourin C, Gertner J, Devilder MC, Allain-Maillet S, Fournie JJ, et al. Self/non-self discrimination by human gammadelta T cells: simple solutions for a complex issue? Immunol Rev. 2007;215:123–35. doi: 10.1111/j.1600-065X.2006.00468.x. [DOI] [PubMed] [Google Scholar]
- 43.Tan C, Wistuba-Hamprecht K, Xu W, Nyunt MS, Vasudev A, Lee B, et al. Vδ2+ and α/β T cells show divergent trajectories during human aging. Oncotarget. 2016 doi: 10.18632/oncotarget.10096. IN PRESS -> WILL BE UPDATED IN THE PROOFS. [DOI] [PMC free article] [PubMed] [Google Scholar]
- 44.Kabelitz D, Dechanet-Merville J. Editorial: “Recent Advances in Gamma/Delta T Cell Biology: New Ligands, New Functions, and New Translational Perspectives”. Front Immunol. 2015;6:371. doi: 10.3389/fimmu.2015.00371. [DOI] [PMC free article] [PubMed] [Google Scholar]
- 45.Coffelt SB, Kersten K, Doornebal CW, Weiden J, Vrijland K, Hau CS, et al. IL-17-producing gammadelta T cells and neutrophils conspire to promote breast cancer metastasis. Nature. 2015;522(7556):345–8. doi: 10.1038/nature14282. [DOI] [PMC free article] [PubMed] [Google Scholar]
- 46.Wu P, Wu D, Ni C, Ye J, Chen W, Hu G, et al. gammadeltaT17 cells promote the accumulation and expansion of myeloid-derived suppressor cells in human colorectal cancer. Immunity. 2014;40(5):785–800. doi: 10.1016/j.immuni.2014.03.013. [DOI] [PMC free article] [PubMed] [Google Scholar]
- 47.Lafont V, Sanchez F, Laprevotte E, Michaud HA, Gros L, Eliaou JF, et al. Plasticity of gammadelta T Cells: Impact on the Anti-Tumor Response. Front Immunol. 2014;5:622. doi: 10.3389/fimmu.2014.00622. [DOI] [PMC free article] [PubMed] [Google Scholar]
- 48.Iwasaki M, Tanaka Y, Kobayashi H, Murata-Hirai K, Miyabe H, Sugie T, et al. Expression and function of PD-1 in human gammadelta T cells that recognize phosphoantigens. Eur J Immunol. 2011;41(2):345–55. doi: 10.1002/eji.201040959. [DOI] [PubMed] [Google Scholar]
- 49.Kunzmann V, Smetak M, Kimmel B, Weigang-Koehler K, Goebeler M, Birkmann J, et al. Tumor-promoting versus tumor-antagonizing roles of gammadelta T cells in cancer immunotherapy: results from a prospective phase I/II trial. J Immunother. 2012;35(2):205–13. doi: 10.1097/CJI.0b013e318245bb1e. [DOI] [PubMed] [Google Scholar]
Associated Data
This section collects any data citations, data availability statements, or supplementary materials included in this article.