Abstract
To measure protein isoforms in individual mammalian cells we report single-cell resolution isoelectric focusing (scIEF) and high-selectivity immunoprobing. Microfluidic design and photoactivatable materials establish the tunable pH gradients required by IEF and precisely control transport and handling of each 17 pL cell lysate during analysis. scIEF resolves protein isoforms with resolution down to single-charge unit differences, including both endogenous cytoplasmic and nuclear proteins from individual mammalian cells.
Keywords: Electrophoresis, Proteomics, Immunoassays, Gels
Graphical abstract
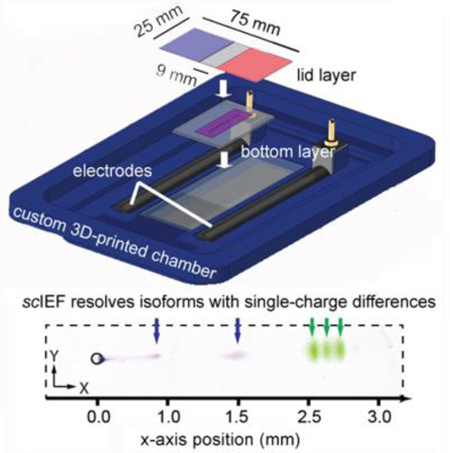
Electrophoretic cytometry: A multilayer, patterned hydrogel device supports isoelectric focusing to separate protein isoforms with single-cell resolution (scIEF). All preparative and analytical steps are performed on the device without using pumps or valves, including: cell isolation, cell lysis, protein separation via IEF, UV-actuated blotting, and in-gel immunoprobing. Protein isoforms with single-charge differences are resolved, blotted, and then detected via immunoprobing.
Questions linger regarding how genome and transcriptome variations manifest as functional proteomes, especially among populations of individual cells.[1–2] Functional proteomes are dictated by dynamic protein expression, as well as chemical modifications and spice variants of expressed proteins. These chemical modifications yield protein variants (proteoforms) with unique functions.[3] Nucleic acid measurements (e.g., RNA-seq) fundamentally cannot measure specific protein isoforms (i.e., post-translational modifications, alternative splicing). Yet, direct measurement of proteins in single cells – predominantly by immunoassay[4–6] – is limited by both the availability and selectivity of immunoreagents (e.g., antibodies).[7] Taken together, challenges in the generation of proteoform-specific antibodies adversely impact our understanding of the roles proteoforms play. Surmounting this cytometry bottleneck requires introduction of new tools optimized for proteoform analysis.[8]
Mass spectrometry is currently the workhorse technology for proteomic analysis. Bottom-up mass spectrometry digests proteins into peptides and identifies proteins and post-translational modifications from the mass spectra of the peptides.[9] However, due to the fragmentation of proteins into peptides, it is challenging to determine how the modified peptides relate back to the intact proteins (e.g. one proteoform with many modifications or multiple proteoforms with fewer modifications).[10] Top-down mass spectrometry can identify and measure specific proteoforms by leveraging separations to reduce the sample complexity and avoid fragmentation of the proteins of interest.[11] While mass spectrometry is able to identify and quantify specific proteoforms, it lacks the sensitivity for most proteoform cytometry, including single-cell analysis.[11–12]
As a complimentary approach to mass spectrometry, microfluidic separations facilitate selective profiling of proteoforms with single-cell resolution. In recent work, polyacrylamide gel electrophoresis (PAGE) was concatenated with a subsequent immunoassay for single-cell western blotting.[13] Although western blotting is a high selectivity protein assay, post-translational modifications and alternative splicing do not always yield resolvable molecular mass differences. Fortunately, even proteoforms of similar mass often exhibit isoelectric point (pI, charge) differences that are readily detectable with another electrophoretic assay (i.e., isoelectric focusing, IEF).[14] In fact, capillary IEF followed by immunoblotting resolved protein post-translational modifications in lysates pooled from as few as 25 cells.[15]
To separate proteins by pI, IEF employs protein electromigration along a stable pH gradient.[16] Proteins electromigrate until each species enters a region of the pH gradient where the local pH is equal to the pI of that species; at that location, the proteoform has no net mobility. Electromigration thus halts and the protein is “focused”. IEF has immense resolving power and selectivity; even single-charge differences among proteoforms are detectable.[17]
To extend the power of IEF from pooled lysates to individual cells, we designed a 3D microfluidic device that integrates all preparatory and analytical stages for single-cell resolution IEF with in gel immunoprobing (cell isolation, lysis, IEF, UV-actuated blotting, probing). Microfluidic integration is essential to overcoming diffusion-based dilution of lysate from a single cell; a loss mechanism exacerbated by handling in multi-stage assays, including immunoblotting. Although proteins can have appreciable intracellular concentrations (i.e., ~20 nM in a 30 µm diameter cell),[18–19] just 5 s of diffusion can reduce the maximum protein concentration by 90% (see SI). Microfluidic integration minimizes the time allowed for diffusion-driven dilution, thus making isoform detection by electrophoretic analysis of single-cell lysates possible.
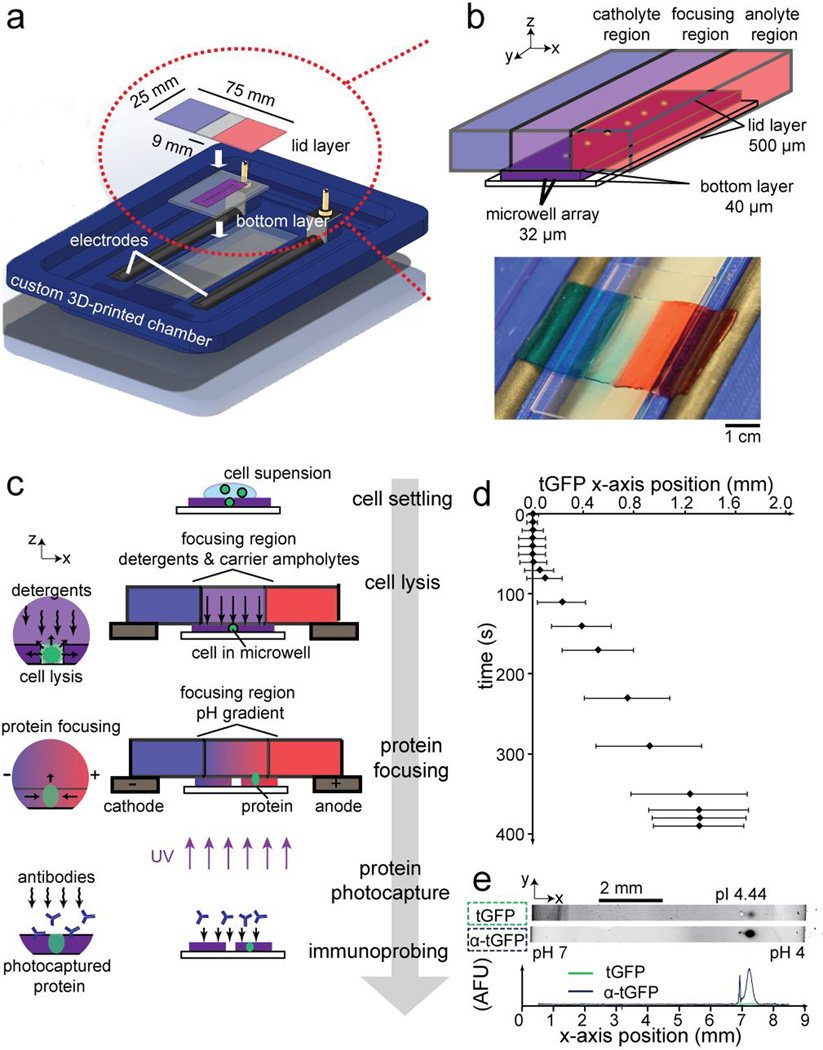
To control scIEF, we designed a multilayered polyacrylamide gel device capable of integrating all required chemistries with no pumping or valving (Figure 1a). The device comprises a glass slide coated with a “bottom” gel layer for isolating single cells in microwells via gravity sedimentation and is topped with a “lid” gel layer patterned with chemistries to control cell lysis and (after electric field application) the formation of pH gradients for scIEF (Figure 1b). The chemically patterned lid layer consists of three different regions, with (i) a central focusing region containing both the non-ionic detergent cell lysis buffer and the mobile buffer species (carrier ampholytes) that form the pH gradient and (ii) two flanking anolyte and catholyte regions created by copolymerizing weak acrylamido acids and bases at different stoichiometries into the polyacrylamide gel (i.e., Immobilines; Figure S1, Table S1).[20]
Figure 1. Direct measurement of proteins using scIEF.
(a) Exploded view rendering of scIEF assay setup. (b) Isometric schematic of the multilayer scIEF microdevice and top view photograph of lid layer with catholyte and anolyte regions with blue and red dye, respectively. (c) scIEF workflow. (d) Time-course of tGFP fluorescence signal position during single-cell lysis and scIEF. Error bars indicate band width (4σ). pH range 4–9, microwell position 4.5 mm from catholyte-side edge of the bottom gel. (e) Inverted grayscale fluorescence micrographs report blotting and subsequent immunoprobing (α-tGFP) from a single cell. pH range 4–7, microwell position 6.75 mm from catholyte-side edge of the bottom gel. Traces in arbitrary fluorescence units (AFU).
Fluidic contact between the 500-µm thick lid layer and the 10× thinner bottom layer diffusively imprints the chemical environment of the lid layer onto the bottom layer (Figure 1c). The free-standing lid layer is compliant (Figure 1b) and, as both the bottom layer and lid layer are fully hydrated when mated, a wetted layer at the interface ensures fluidic and electrical contact. Upon this first contact, cell lysis in each microwell is initiated by diffusion-driven release of the mobile non-ionic lysis reagents from the lid layer into the bottom layer. To minimize evaporation during the assay, an additional glass slide is placed on top of the lid layer. At this stage, no electric potential is applied. We monitored human glioblastoma cells expressing TurboGFP (U373-tGFP) and observed initial release of tGFP within 10 s of lid application, with fluorescence signal filling the 32 pL microwell volume within 20 s (Figure 1d; Figure S2). Electrodes mated to the flanking anolyte and catholyte regions initiate and sustain IEF, with fluorescing tGFP peaks from each cell (signal-to-noise ratio, SNR >8) reaching a focused position ~310 s later (Figure 1d; Figure S2). We characterized the repeatability of the lid placement relative to the microwells and determined the coefficient of variance of the lid position to be CV = 14.87% (Figure S3). Nevertheless, precise positioning of the lid will not affect the relative positions of the focused bands because the proteins will migrate to their pI regardless of the starting position of the microwell relative to the anolyte and catholyte boundaries.
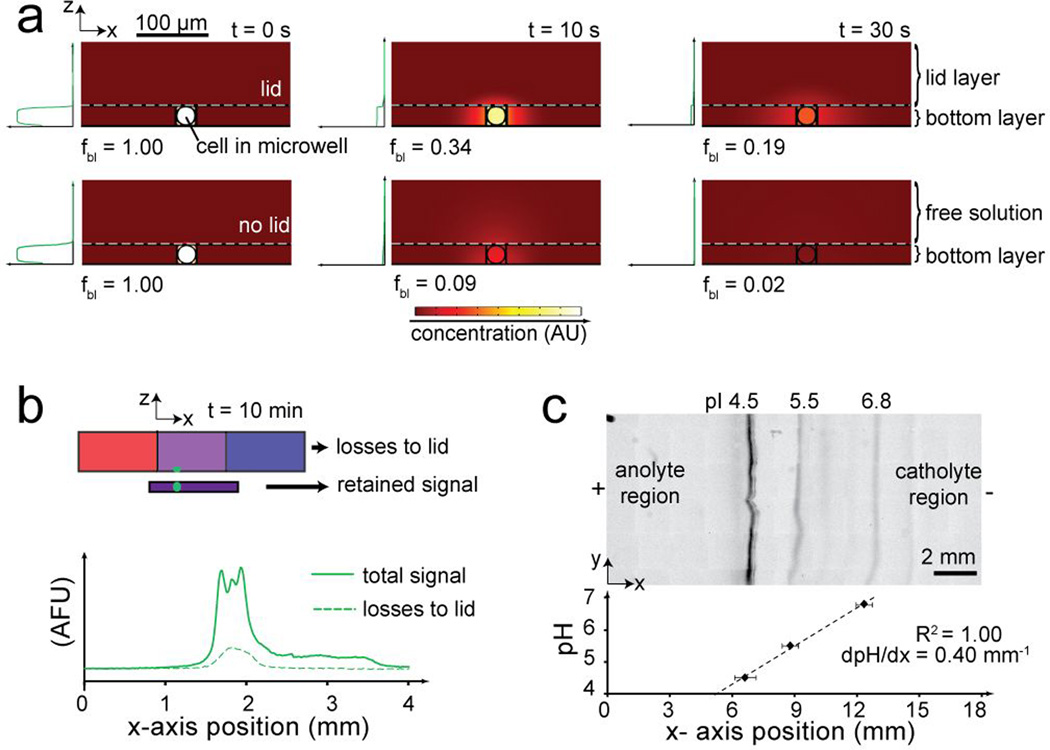
Two additional design considerations constrain diffusive losses, making the long duration (relative to fast-acting diffusion) separation possible. Firstly, diffusive losses are limited to two spatial dimensions due to the IEF occurring along the x-axis (Figure S4). Secondly, diffusive losses in the out-of-plane dimension are notably reduced by the presence of the dense hydrogel lid layer. During both lysis and focusing, simulations show that analyte diffusivity is considerably lower into the dense gel lid, compared to free solution (Figure 2a, Figure S4). Empirical results corroborate the reduced out-of-plane diffusive losses as just ~15% of the total protein signal after a remarkable 600 s of voltage application time (Figure 2b; Figure S5) Note that the position of the microwells in the bottom layer can be optimized to reduce diffusive losses of specific proteins by reducing electromigration time from microwell to protein pI.
Figure 2. Control of diffusive and electrokinetic transport to establish robust, non-uniform chemistries for scIEF.
(a) Concentration heat maps from simulation show protein diffusion out of the bottom layer is mitigated in hindered (with lid) vs unhindered (no lid, free solution) conditions. Plots indicate maximum concentration along z-axis. Fraction of total protein in bottom layer is fbl (b) Fluorescence traces show tGFP transfer from bottom layer to lid layer after 10 min of scIEF (c) Inverted grayscale fluorescence micrograph shows focused pH markers in pH 4–7 gradient. Dashed line is linear fit; error bars, peak widths (4σ).
To detect endogenous isoforms, we designed the hydrogel device to support blotting of the scIEF separation and subsequent diffussive in-gel immunoprobing (Figure 1e; Figure S6). By performing an immunoassay after a separation, a single antibody probe (e.g., pan-specific) can detect and discern multiple, spatially-separated isoforms. Our design uses a photo-active monomer (benzophenone methacrylamide) cross-linked into the bottom layer to covalently immobilize protein peaks after brief UV exposure.[13, 21] The characteristic timescale of the immobilization reaction is 5.5 s.[22] Photocapture was performed with the applied electric field set to electrically floating conditions, as peak drift during photocapture confounds the pI location and reduces separation resolution.[22] We estimate that diffusion-induced peak defocusing during the 5.5 s immobilization reaction does not confound pI location and reduces the separation resolution by ~20%, as is consistent with our previous studies (see SI).[22] A longer 45 s UV exposure period was used to maximize immobilization efficiency. We experimentally measured the capture efficiency of our proteins in our system as 17.7±1.5% (Figure S7), which leads to an estimated lower limit of detection of ~42,000 molecules needed in the bottom layer before photocapture for detection via immunoprobing (see SI). Immunoprobing using primary and fluorescently-labeled secondary antibodies reported a major tGFP band with an SNR of 51.87±39.10 (n=9, Figure 1e; Figure S6a). Importantly, covalent immobilization of resolved proteins to the gel decouples time-dependent dilution considerations from all subsequent assay stages, archival storage, and multiple reprobing rounds.[13]
We next sought to optimize scIEF resolving power to enhance the selectivity of isoform detection (Figure 2c). Adjusting the design of the chemically patterned lid layer imprints pH gradients of different length and steepness on the bottom layer, determining the focusing time and separation resolution. Fluorescence flow cytometry and mass cytometry measures up to ~12 and ~34 targets in a single cell respectively,[23] but both techniques are unable to distinguish isoforms that lack highly selective antibodies. In contrast, in-gel immunoprobing assays with separations multiplex the product of the resolvable proteins (peak capacity[24], ~17 for scIEF, see SI) with ~4 spectrally distinct fluorescent dyes (labeled secondary antibodies) and 2–20 stripping/re-probing cycles (depending on physicochemical properties of target).[13, 21, 25–26]
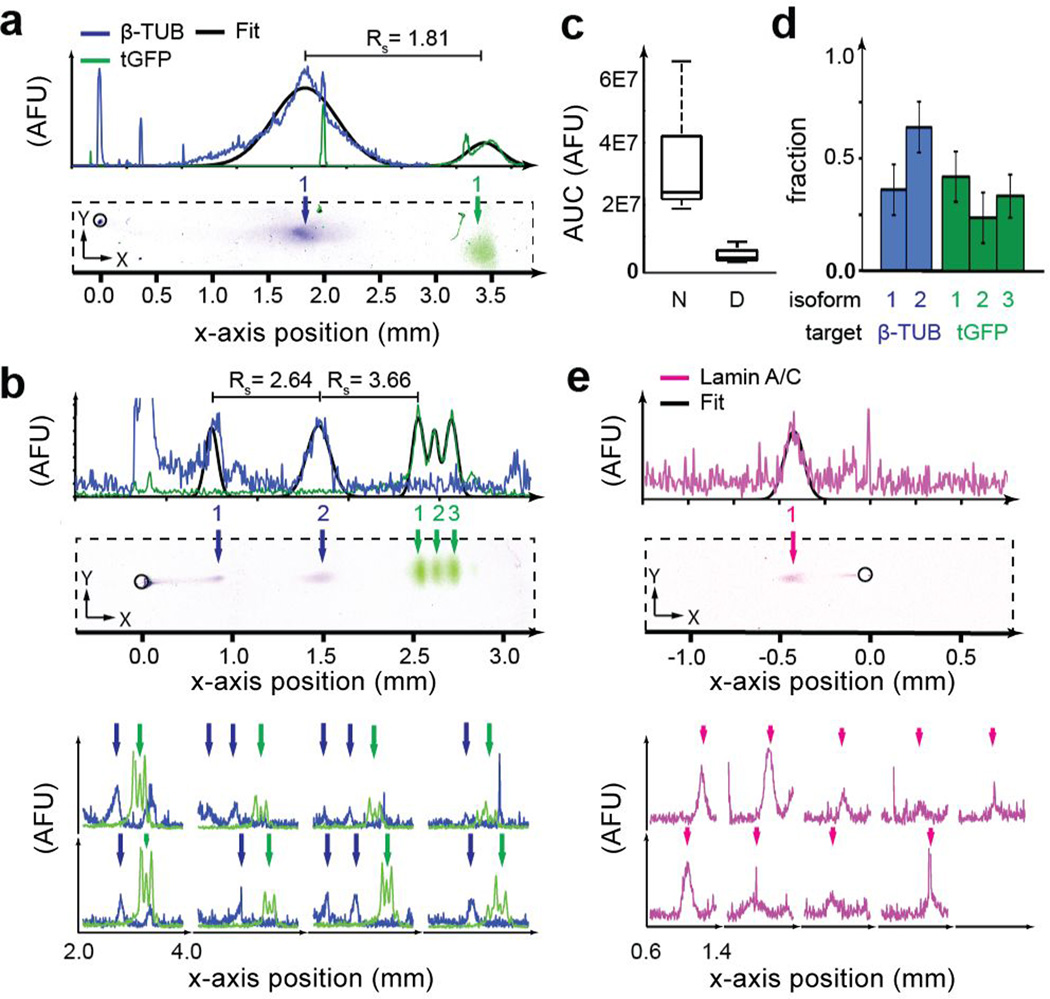
We next sought to scrutinize the capability of scIEF to concurrently measure endogenous cytoskeletal and nuclear targets, here for proteins with known isoforms. We assayed tGFP (~pI 4.5), β-tubulin (β-TUB, ~pI 5.5), and lamin A/C in individual glioblastoma cells (Figure 3). In this study, we used secondary antibodies each labeled with a different fluorophore (AlexaFluor 555 and 647) to discriminate between the signal from mouse (lamin A/C) and rabbit (tGFP and β-TUB) primary antibodies, demonstrating the utility of spectral multiplexing (Figure 3). Using a four-color laser scanner, multiplexing can be further increased using commercially available dyes (e.g., AlexaFluor). Both native and denaturing scIEF were studied, as isoform state is sensitive to sample preparation conditions. Under native scIEF, tGFP and β-TUB were well-resolved with separation resolution of 1.91±0.36 (nN=9 cells), yielded a conservative peak capacity of 9.0±3.1 (based on width of widest peak, β-TUB), and reported no isoforms. Expression of tGFP and β-TUB were not well-correlated (Pearson correlation, ρ=0.22, p=0.60, Figure 3a; Figure S6b).
Figure 3. scIEF with immunoprobing resolves proteoforms in individual mammalian cells.
(a) False-color fluorescence micrographs and traces show scIEF detection via immunoprobing of β-TUB and tGFP from individual cells. Microwells are outlined with black circle, located at 0 mm. Arrows indicate protein peaks; plotted black outlines, Gaussian fits for identified peaks. (b) False-color fluorescence micrographs and traces show detection of denatured β-TUB isoforms in 3/8 cells. (c) Median total tGFP probing fluorescence (Area under the curve, AUC) under native “N” and denaturing “D” conditions (nD=8, nN=9, p<0.01) (d) Relative isoform fractions (nβ-TUB=3, ntGFP=8). (e) False-color fluorescence micrographs and traces show detection of lamin A/C from individual cells under denaturing conditions (nD=9). pH range 4–7, microwell position 6.75 mm from catholyte-side edge of the bottom gel in all separations.
Under denaturing scIEF (7 M urea and 2 M thiourea added to the lysis buffer), three tGFP isoforms (RS>0.88) and two β-TUB isoforms (RS=2.54±0.46; nD=3) were detected (Figure 3b; Figure S6c). The tGFP isoforms arise from differential C-terminal cleavage by non-specific proteases[17] and differ by just a single charge unit. Interestingly, the native conditions yielded 86% higher total tGFP probing signal than denaturing conditions, attributed to the sensitivity of photocapture efficiency on protein state or, possibly, to incomplete electromigration out of the microwell, as is under study (Figure 3c). Denaturing conditions resulted in well-resolved major β-TUB and tGFP peaks (RS=1.77±0.59) and a ~3× higher peak capacity than native conditions (28.08±6.68; nD=8, Figure 3d). Using the pI of the tGFP isoforms (Figure S8), we estimated the pI of the β-TUB isoforms to be 5.11 and 5.76. The acidic isoform of β-TUB had a total expression approximately 5× higher than that of the basic isoform (p<0.01, Figure 3d). β-TUB isoforms have been implicated in resistance to tubulin-binding cancer therapeutics (i.e., Taxol).[27]
To assess relevance to nuclear proteins (classically difficult to assay via single-cell cytometry-based techniques without fractionation[28]) we assayed U373-tGFP cells for lamin A/C (Figure 3e; Figure S6d). As expected, we detected lamin A/C in all glioblastoma cells. Because of its basic 6.8–7.3 pI,[29] lamin A/C bands migrated toward the cathode side and focused to the left of the microwell. The fluorescent readout signals observed on this set of validation proteins were sufficient (SNR>3) for study of endogenous isoforms from single mammalian cells. The successful immunoprobing of lamin A/C (nuclear protein), tGFP (cytosolic protein), and β-TUB (cytoskeletal protein) demonstrate that the denaturing scIEF lysis buffer solubilizes proteins from the major cellular compartments. Future work will characterize and optimize the lysis buffers for more stringent applications such as histones and other high-affinity complexes.
The number of parallel scIEF separations in the same chip is dictated by microwell spacing (Figure S2) and device size (which determine the number of microwells), as well as by the cell settling efficiency of passive sedimentation. In this work, ~10 cells were analyzed per chip. The number of cells analyzed per device can be increased by fabricating larger devices or using active settling methods.[30] Future work will aim to increase the throughput of the scIEF device for more robust detection of rare events. Owing to the rapid separations, the overall throughput of the assay can be increased by running multiple separations in series and then immunoprobing several devices in parallel.
Direct detection of proteoforms in single cells is a crucial capability, as protein copy number (especially isoforms) from single mammalian cells is only sparsely reported and RNA may not always well-correlate with protein expression (or form).[31] The demonstrated capability of the scIEF assay to resolve isoforms of endogenous proteins from single cells provides a much-needed capability to elucidate the role of specific proteoforms in cancer progression, cardiovascular disease, and neurodegenerative disorders.[1, 32] scIEF opens a separations-based avenue for measuring proteoforms, an important aspect of protein signaling that is difficult to observe with conventional cytometry tools.
Supplementary Material
Acknowledgments
The authors acknowledge members and alumni of the Herr Lab for helpful discussion. Partial infrastructure support was provided by the QB3 Biomolecular Nanofabrication Center. This research was performed under a UC Cancer Research Coordinating Committee Predoctoral Fellowship (A.M.T.), a University of California, Berkeley Siebel Scholarship (A.M.T.), a National Science Foundation Graduate Research Fellowship (K.A.Y), a National Science Foundation CAREER award (CBET-1056035 to A. E. H.) and a National Institutes of Health R01 (1R01CA203018 to A.E.H.).
Footnotes
Author Contributions
A.M.T. and K.A.Y. performed the experiments, simulations, and data analysis. A.M.T., K.A.Y., and A.E.H conceived and designed the scIEF assay, designed the experiments, and wrote the manuscript.
The authors declare financial interests. A.M.T., K.A.Y., and A.E.H. are co-inventors on patents related to single-cell analysis and A.E.H. has financial interest in a company commercializing a single-cell analysis tool.
REFERENCES
- 1.Alfaro JA, Sinha A, Kislinger T, Boutros PC. Nat. Methods. 2014;11:1107–1113. doi: 10.1038/nmeth.3138. [DOI] [PubMed] [Google Scholar]
- 2.Myhre S, Lingjærde O-C, Hennessy BT, Aure MR, Carey MS, Alsner J, Tramm T, Overgaard J, Mills GB, Børresen-Dale A-L, Sørlie T. Mol. oncol. 2013;7:704–718. doi: 10.1016/j.molonc.2013.02.018. [DOI] [PMC free article] [PubMed] [Google Scholar]
- 3.Smith LM, Kelleher NL. Nat. Methods. 2013;10:186–187. doi: 10.1038/nmeth.2369. [DOI] [PMC free article] [PubMed] [Google Scholar]
- 4.Zunder ER, Lujan E, Goltsev Y, Wernig M, Nolan GP. Cell Stem Cell. 2015;16:323–337. doi: 10.1016/j.stem.2015.01.015. [DOI] [PMC free article] [PubMed] [Google Scholar]
- 5.Bendall SC, Nolan GP, Roederer M, Chattopadhyay PK. Trends Immunol. 2012;33:323–332. doi: 10.1016/j.it.2012.02.010. [DOI] [PMC free article] [PubMed] [Google Scholar]
- 6.Wei W, Shin YS, Ma C, Wang J, Elitas M, Fan R, Heath JR. Genome Med. 2013;5:75. doi: 10.1186/gm479. [DOI] [PMC free article] [PubMed] [Google Scholar]
- 7.Stadler C, Rexhepaj E, Singan VR, Murphy RF, Pepperkok R, Uhlén M, Simpson JC, Lundberg E. Nat. Methods. 2013;10:315–323. doi: 10.1038/nmeth.2377. [DOI] [PubMed] [Google Scholar]
- 8.Hattori T, Taft JM, Swist KM, Luo H, Witt H, Slattery M, Koide A, Ruthenburg AJ, Krajewski K, Strahl BD, White KP, Farnham PJ, Zhao Y, Koide S. Nat. Methods. 2013;10:992–995. doi: 10.1038/nmeth.2605. [DOI] [PMC free article] [PubMed] [Google Scholar]
- 9.Pandey A, Mann M. Nature. 2000;405:837–846. doi: 10.1038/35015709. [DOI] [PubMed] [Google Scholar]
- 10.Kelleher NL, Thomas PM, Ntai I, Compton PD, LeDuc RD. Expert Rev. Proteomics. 2014;11:649–651. doi: 10.1586/14789450.2014.976559. [DOI] [PMC free article] [PubMed] [Google Scholar]
- 11.Toby TK, Fornelli L, Kelleher NL. Annu. Rev. Anal. Chem. 2016;9:499. doi: 10.1146/annurev-anchem-071015-041550. [DOI] [PMC free article] [PubMed] [Google Scholar]
- 12.Lesur A, Domon B. Proteomics. 2015;15:880–890. doi: 10.1002/pmic.201400450. [DOI] [PubMed] [Google Scholar]
- 13.Hughes AJ, Spelke DP, Xu Z, Kang C-C, Schaffer DV, Herr AE. Nat. Methods. 2014;11:749–755. doi: 10.1038/nmeth.2992. [DOI] [PMC free article] [PubMed] [Google Scholar]
- 14.Tran JC, Zamdborg L, Ahlf DR, Lee JE, Catherman AD, Durbin KR, Tipton JD, Vellaichamy A, Kellie JF, Li M, Wu C, Sweet SMM, Early BP, Siuti N, LeDuc RD, Compton PD, Thomas PM, Kelleher NL. Nature. 2011;480:254–258. doi: 10.1038/nature10575. [DOI] [PMC free article] [PubMed] [Google Scholar]
- 15.O'Neill RA, Bhamidipati A, Bi X, Deb-Basu D, Cahill L, Ferrante J, Gentalen E, Glazer M, Gossett J, Hacker K. Proc. Natl. Acad. Sci. USA. 2006;103:16153–16158. doi: 10.1073/pnas.0607973103. [DOI] [PMC free article] [PubMed] [Google Scholar]
- 16.Righetti PG. Isoelectric Focusing: Theory, Methodology and Application: Theory, Methodology and Application. 2000 Access Online via Elsevier. [Google Scholar]
- 17.Hughes AJ, Tentori AM, Herr AE. J. Am. Chem. Soc. 2012;134:17582–17591. doi: 10.1021/ja3064292. [DOI] [PMC free article] [PubMed] [Google Scholar]
- 18.Li JJ, Bickel PJ, Biggin MD. PeerJ. 2014;2:e270. doi: 10.7717/peerj.270. [DOI] [PMC free article] [PubMed] [Google Scholar]
- 19.Schwanhäusser B, Busse D, Li N, Dittmar G, Schuchhardt J, Wolf J, Chen W, Selbach M. Nature. 2011;473:337–342. doi: 10.1038/nature10098. [DOI] [PubMed] [Google Scholar]
- 20.Tentori AM, Hughes AJ, Herr AE. Anal. Chem. 2013;85:4538–4545. doi: 10.1021/ac4001767. [DOI] [PMC free article] [PubMed] [Google Scholar]
- 21.Kang C-C, Lin J-MG, Xu Z, Kumar S, Herr AE. Anal. Chem. 2014;86:10429–10436. doi: 10.1021/ac502932t. [DOI] [PMC free article] [PubMed] [Google Scholar]
- 22.Hughes AJ, Lin RK, Peehl DM, Herr AE. Proc. Natl. Acad. Sci. U. S. A. 2012;109:5972–5977. doi: 10.1073/pnas.1108617109. [DOI] [PMC free article] [PubMed] [Google Scholar]
- 23.Bodenmiller B, Zunder ER, Finck R, Chen TJ, Savig ES, Bruggner RV, Simonds EF, Bendall SC, Sachs K, Krutzik PO, Nolan GP. Nat. Biotechnol. 2012;30:858–867. doi: 10.1038/nbt.2317. [DOI] [PMC free article] [PubMed] [Google Scholar]
- 24.Horvath CG, Lipsky SR. Anal. Chem. 1967;39:1893–1893. doi: 10.1021/ac60256a003. [DOI] [PubMed] [Google Scholar]
- 25.Duncombe TA, Kang CC, Maity S, Ward TM, Pegram MD, Murthy N, Herr AE. Adv. Mater. 2016;28:327–334. doi: 10.1002/adma.201503939. [DOI] [PMC free article] [PubMed] [Google Scholar]
- 26.Kang C-C, Yamauchi KA, Vlassakis J, Sinkala E, Duncombe TA, Herr AE. Nat. Protoc. 2016;11:1508–1530. doi: 10.1038/nprot.2016.089. [DOI] [PMC free article] [PubMed] [Google Scholar]
- 27.Verdier-Pinard P, Wang F, Martello L, Burd B, Orr GA, Horwitz SB. Biochemistry. 2003;42:5349–5357. doi: 10.1021/bi027293o. [DOI] [PubMed] [Google Scholar]
- 28.Forment JV, Jackson SP. Nat. Protoc. 2015;10:1297–1307. doi: 10.1038/nprot.2015.066. [DOI] [PMC free article] [PubMed] [Google Scholar]
- 29.Lebel S, Lampron C, Royal A, Raymond Y. J. Cell. Biol. 1987;105:1099–1104. doi: 10.1083/jcb.105.3.1099. [DOI] [PMC free article] [PubMed] [Google Scholar]
- 30.Nilsson J, Evander M, Hammarström B, Laurell T. Anal. Chim. Acta. 2009;649:141–157. doi: 10.1016/j.aca.2009.07.017. [DOI] [PubMed] [Google Scholar]
- 31.Vogel C, Marcotte EM. Nat. Rev. Genet. 2012;13:227–232. doi: 10.1038/nrg3185. [DOI] [PMC free article] [PubMed] [Google Scholar]
- 32.Gregorich ZR, Ge Y. Proteomics. 2014;14:1195–1210. doi: 10.1002/pmic.201300432. [DOI] [PMC free article] [PubMed] [Google Scholar]
Associated Data
This section collects any data citations, data availability statements, or supplementary materials included in this article.


