. 2016 Dec 30;5:e20556. doi: 10.7554/eLife.20556

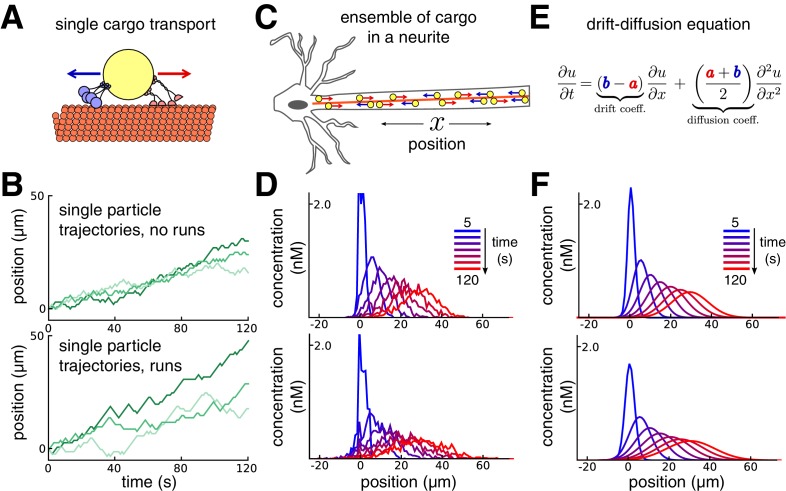
Figure 1. Constructing a coarse-grained model of intracellular transport.

(A) Cartoon of a single cargo particle on a microtubule attached to opposing motor proteins. (B) Three example biased random walks, representing the stochastic movements of individual cargoes. (Top panel) A simple random walk with each step independent of previous steps. (Bottom panel) Adding history-dependence to the biased random walk results in sustained unidirectional runs and stalls in movement. (C) Cartoon of a population of cargo particles being transported along the length of a neurite. (D) Concentration profile of a population of cargoes, simulated as 1000 independent random walks along a cable/neurite. (Top panel) simulations without runs. (Bottom panel) Simulations with runs. (E) In the limit of many individual cargo particles, the concentration of particles u is described by a drift diffusion model whose parameters, a and b, map onto the mass action model (Equation 1). (F) The mass-action model provides a good fit to the simulations of bulk cargo movement in (D). (Top panel) Fitted trafficking rates for the model with no runs were a ≈ 0.42 s−1, b ≈ 0.17 s−1. (Bottom panel) Fitting the model with runs gives a ≈ 0.79 s−1, b ≈ 0.54 s−1.

DOI: http://dx.doi.org/10.7554/eLife.20556.003

Figure 1.

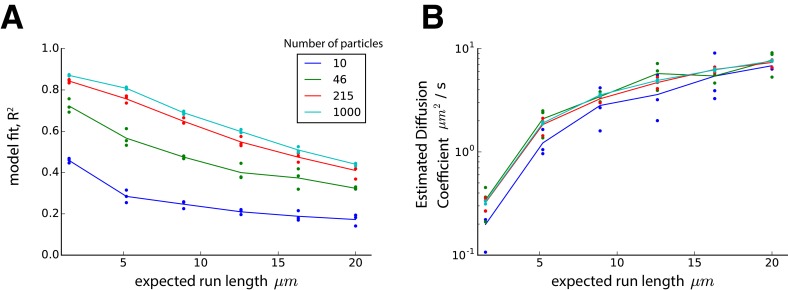
Figure 1—figure supplement 1. The effect of cargo run length on mass-action model fit and diffusion coefficient.

Figure 1—figure supplement 1.

The model of stochastic particle movement (Equation 7, Materials and methods) was simulated with equal transition probabilities (p-=p0=p+=1/3) for various values of k and particle numbers in an infinite cable with 1 µm compartments and 1 s time steps. The expected run length is given by the mean of a negative binomial distribution. For each simulation, a mass-action approximation was fit by matching the first two moments of the cargo distribution, as described in the Materials and methods. In both panels, dots represent simulated triplicates, and lines denote the average outcome with colors denoting the simulated ensemble size (see legend). (A) The mass-action model (Equation 1, Results) provides a reasonably accurate fit after 100 s of simulation with moderately long run lengths and low particle numbers. The fit improves for longer simulations and larger particle numbers, since the cargo distribution is better approximated by a normal distribution under these conditions due to the central limit theorem. The coefficient of determination, R2, reflects the proportion of explained variance by the mass-action model (equivalent to a Gaussian fit to the concentration profile). (B) The estimated diffusion coefficient of the mass-action model (i.e. the variance of the Gaussian fit in panel A) increases as expected run length increases.