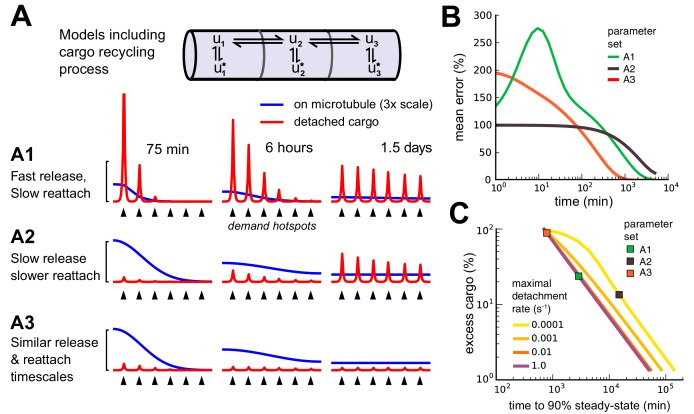
Figure 7. Adding a mechanism for cargo reattachment produces a further tradeoff between rate of delivery and excess cargo.
(A) Simulations of three models (A1, A2, A3) with cargo recycling. As in Figure 6, cargo is distributed to six demand hotspots (black arrows). The distributions of cargo on the microtubules (, blue) and detached cargo (, red) are shown at three times points for each model. (B) Mean percent error in the distribution of detached cargo as a function of time for the three models in panel A. (C) Tradeoff curves between excess cargo and time to convergence to steady-state (within 10% mean error across compartments) for fixed cargo detachment timescales (line color). For all detachment timescales, varying the reattachment timescale produced a tradeoff between excess cargo (fast reattachment) and slow convergence (slow reattachment). Colored squares denote the position of the three models in panel A.

