Abstract
A novel inductively coupled coil pair was used to obtain magnetic resonance phantom images. Rationale for using such a structure is described in R. R. Mett et al. [Rev. Sci. Instrum. 87, 084703 (2016)]. The original rationale was to increase the Q-value of a small diameter surface coil in order to achieve dominant loading by the sample. A significant improvement in the vector reception field (VRF) is also seen. The coil assembly consists of a 3-turn 10 mm tall meta-metallic self-resonant spiral (SRS) of inner diameter 10.4 mm and outer diameter 15.1 mm and a single-loop equalization coil of 25 mm diameter and 2 mm tall. The low-frequency parallel mode was used in which the rf currents on each coil produce magnetic fields that add constructively. The SRS coil assembly was fabricated and data were collected using a tissue-equivalent 30% polyacrylamide phantom. The large inductive coupling of the coils produces phase-coherency of the rf currents and magnetic fields. Finite-element simulations indicate that the VRF of the coil pair is about 4.4 times larger than for a single-loop coil of 15 mm diameter. The mutual coupling between coils influences the current ratio between the coils, which in turn influences the VRF and the signal-to-noise ratio (SNR). Data on a tissue-equivalent phantom at 9.4 T show a total SNR increase of 8.8 over the 15 mm loop averaged over a 25 mm depth and diameter. The experimental results are shown to be consistent with the magnetic resonance theory of the emf induced by spins in a coil, the theory of inductively coupled resonant circuits, and the superposition principle. The methods are general for magnetic resonance and other types of signal detection and can be used over a wide range of operating frequencies.
I. INTRODUCTION
Previous work introduced methods to obtain high Q-value resonators of various geometries using meta-metallic thin foils.1,2 In that work, a high Q-value geometry appropriate for a surface coil in MRI was found to consist of a self-resonant spiral (SRS) made of metallic foil of thickness on the order of a skin depth surrounded by an outer resonant “equalization” coil. Although the original purpose of the outer coil was to improve Q-value by reducing rf currents on the foil edges, we find that the vector reception field (VRF) of the dual coil assembly is altered significantly compared to a simple loop surface coil. The extent of the VRF is the main of several advantages of the SRS coil assembly. We report results of MRI measurements, simulations, and theory to characterize the coil assembly compared to a simple loop.
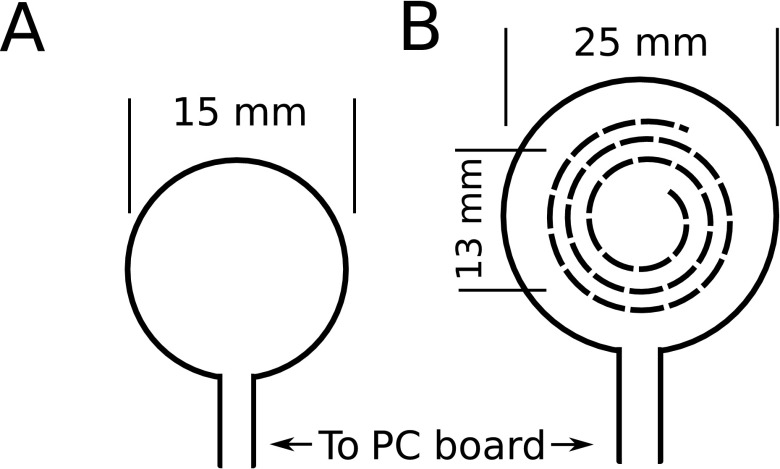
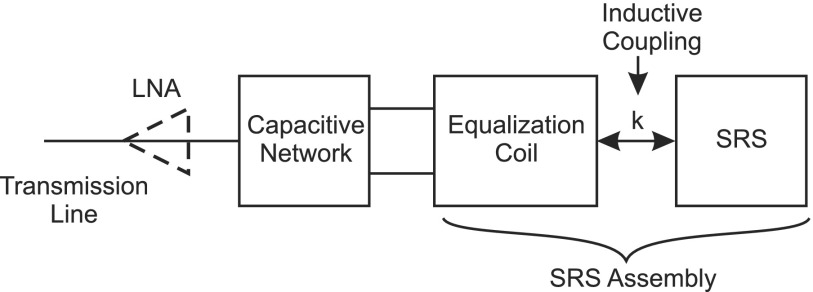
A receive-only surface coil assembly consisting of an SRS and outer equalization coil designed for small animal MRI at 9.4 T (400 MHz) is characterized, fabricated, and compared to a 15 mm simple-loop surface coil, Fig 1. The SRS is made of three turns of copper foil of average diameter 13 mm and 1 cm height sandwiched between layers of polytetrafluoroethylene (PTFE) and is inductively coupled to the 25 mm outer coil. The 15 mm and 25 mm single-turn coils are machined from copper. The SRS coil assembly also uses the outer coil to couple to the transmission line and preamplifier. A block diagram of the SRS assembly showing connection to the transmission line is shown in Fig. 2.
FIG. 1.
Illustration of (a) the 15 mm diameter surface coil and (b) a 3-turn 10 mm tall SRS coil (dashed) of inner diameter 10.4 mm and outer diameter 15.1 mm (average diameter 13 mm) located co-axially inside a 25 mm diameter and 2 mm tall equalization coil (solid) centered between the top and bottom of the SRS. The equalization coil and 15 mm surface coil are each directly connected to a PC-board match-and-tune circuit. See also Fig. 2.
FIG. 2.
Block diagram of an SRS assembly with connection to a transmission line. The analysis and electronics accommodate an LNA but the imaging results presented in this paper were done without an LNA.
The SRS coil assembly produces two resonant modes: a parallel mode (co-rotating), where the magnetic field profiles of the equalization coil and SRS coil are in phase, and an anti-parallel mode (counter-rotating), where they are 180° out of phase. The resonance frequency of the parallel mode is lower than the frequency of the anti-parallel mode. In both modes, the rf magnetic fields of the equalization coil and SRS coil are phase-coherent. The parallel mode is the subject of this work.
Historically, there have been two strategies for coupling of a surface coil to a transmission line: either an inductive loop or a capacitive network connected across the resonating capacitor of the coil. In the work described here, the more conventional capacitive-network connecting a transmission line has been used. Thus the structure that is considered consists of a capacitive network connecting a transmission line to a first coil which is in turn inductively coupled to a second coil, Fig. 2. The two coils are a resonant system. The mutual inductance between the two coils is high and the resonant frequency of the parallel mode is well separated from that of the anti-parallel mode. We present a fourth-order analytic theory that combines the reciprocity theorem3 with the theory of inductively coupled resonant circuits4 and the superposition principle. Thermal noise is included. Predictions of the theory are consistent with the simulations and observations. The theory shows how the superposition of the emf induced by the spins in each coil normalized to unit current in each coil appears across the equalization coil. This superposition is related to the VRF of the SRS assembly. Noise voltage across the equalization coil is calculated. The inductive coupling of the two coils influences the signal and the noise.
The surface-coil assembly described here was found to have a number of advantages, the most important being higher sensitivity and improved depth sensitivity. The structure is believed to be new.5 We were led to this coil assembly through our earlier work on meta-metallic surface coils.1,2 Although the method of two step coupling—from transmission line to outer loop by a capacitive network followed by inductive coupling to the meta-metallic loop—solves a particular problem, the coil assembly described here stands on its own. It is not limited to meta-metallic surface coils.
Polyacrylamide gel is an accepted tissue-equivalent material for MRI surface coil development. The object of interest in our studies is the rat brain. It is irregular in shape, but a surface coil of 15 mm diameter provides satisfactory coverage for many experiments. In the present work, a somewhat extended polyacrylamide phantom that models tissue loss not only in the rat brain but also in surrounding tissue has been used with particular attention paid to performance of the coil assembly developed here over a region of the phantom that corresponds to the brain. In the absence of an absolute standard, in the present work we compare VRF and signal-to-noise ratio (SNR) theoretically and experimentally to that of the 15 mm coil. We report our results as a benchmark for success. We do not claim to have fully optimized either coil system.
Primarily we are concerned with functional MRI (fMRI). Typically a time series of 128 sets of slices that cover a slab of tissue is acquired. Signal processing results in a time series of images from each slice. From these image series, one can form many series of voxel time courses. In the absence of an fMRI signal, noise in a magnitude time course assigned to a particular voxel can be estimated by the standard deviation about the mean value of the noise. Typically it is assumed that there is no spatial coherence among the various voxel time courses. One can say that the noise is not spatially encoded. It is called Joulean or white noise, such as would be expected from a resistor. On the other hand, physiological noise arising from the live animal is spatially encoded and can be the object of a research study. Cross correlation between voxel time courses is used in such a study. It is straightforward to separate spatially encoded noise from Joulean noise.
Although the original rationale of the SRS coil assembly was to increase the Q-value of a small diameter surface coil in order to achieve dominant loading by the sample, additional significant improvement of the VRF of the system was observed with an increase in SNR. The theory suggests that a major component of the VRF enhancement can be obtained with coils of lower Q-value. Moreover, further improvement in the Q-value and increased body loading are possible using the meta-metallic effect. Previous work using inductive coupling of multiple coils demonstrated improvement of rf field homogeneity with high sensitivity for NMR.6 It has also been shown in an earlier paper from our group that depth sensitivity can be reduced (tailored) using a coil structure for MRI that consisted of two loops coupled by strong mutual inductance in anti-parallel mode.7
Use of inductive coupling in MRI has shown some advantages;8–10 however, the configurations used (single-turn loops, 90° phase between primary and secondary, inductance ratios between primary and secondary less than unity, and the inductive coupling strengths chosen) were different and did not clearly indicate the MR SNR enhancement described in this work. Here, we present an analytical theory for the fourth-order coupled system demonstrating these effects, finite-element modeling simulations confirming the effects, and MRI data showing a significant improvement of MRI SNR.
Spiral surface arrays11 and microcoils12 have been studied and improvement of the VRF is seen. However, these coils are typically planar or only a wire thickness tall (1-2 mm), whereas the SRS spiral is 10 mm tall. Additionally, the spirals in Refs. 11 and 12 were capacitively coupled and the SNR follows the second order system described in Appendix A. The foil of the spirals is oriented parallel to the sample surface, perpendicular to the foils considered in our work. Parallel foil orientation tends to produce lower Q-values for reasons described in Ref. 1. In Ref. 11 an unloaded Q-value of 159 was reported for a 4-turn spiral of 36 mm diameter at 300 MHz. In Ref. 12, no measured Q-value was reported. A theoretical Q-value of 39 was given for a 3-turn spiral of 2.7 mm diameter at 500 MHz. These Q-values are more than a factor of 3 and 12 smaller than the SRS. Furthermore, unlike the present work, the coils in Refs. 11 and 12 are not self-resonant near the operating frequency and the VRF of the spiral is not altered by another coil.
II. ANALYTIC THEORY
The response of an inductively coupled system of coils can be described by considering an emf induced by the spins in each coil, the theory of inductively coupled resonant circuits,4 and the superposition principle to derive the total voltage present across the capacitor of the equalization coil. The results are compared to those from a single-turn loop. The analysis parallels that of the second-order system given in Appendix A.
The emf ξ induced in a coil by the magnetic dipole moments of the spins is given by3,13,14
| (1) |
In Eq. (1), B1 represents the magnetic field at the sample volume dVs produced by the coil per unit current in the coil. The magnetization of the spins is M0. When there are two coils, a coupling coil and an SRS, an emf is induced in both coils.
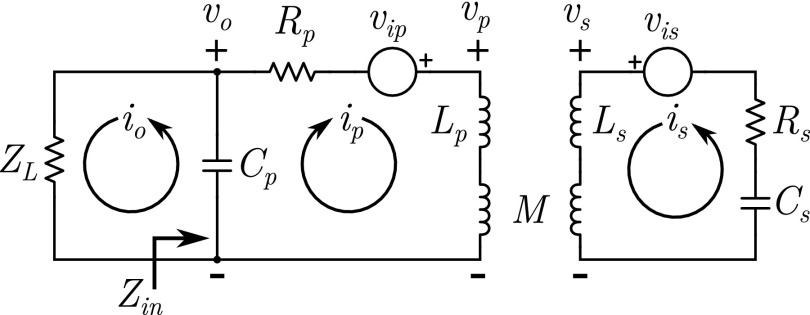
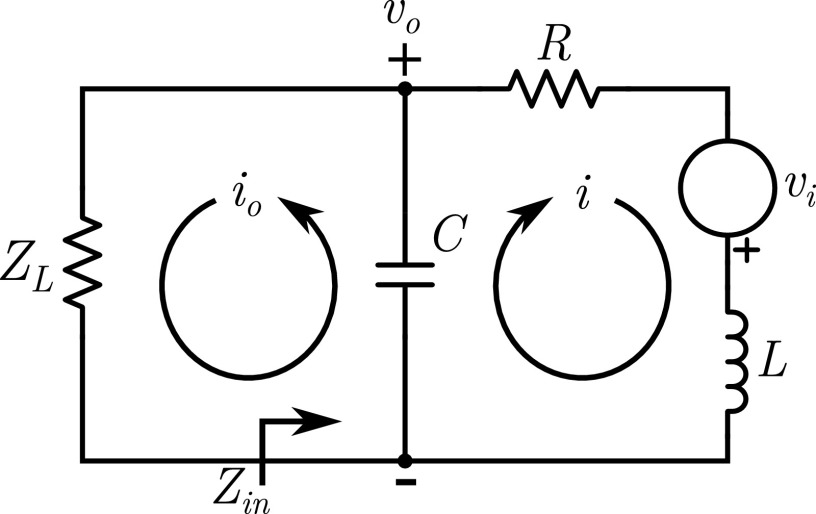
An equivalent circuit of the SRS assembly including the capacitive network and transmission line or low noise amplifier (LNA) is shown in Fig. 3. In this analysis, the output is taken across the equivalent primary capacitor Cp for both the signal voltage and the thermal noise voltage. Different values of Cp and ZL can be used to model the capacitive network and transmission line or LNA shown in Fig. 2. This is further discussed in Sec. III. The location vo in the circuit is a convenient place to analyze the emf from both coils and the total noise voltage. The capacitive network contributes a noise figure near one if tuned for maximum power transfer (critical coupling) at this point.15–17 This is true whether the capacitive network is connected to a transmission line or a low-resistance LNA input. This location in the circuit is also used to analyze the second order system, Appendix A, Fig. 11, and the analysis is consistent with the literature.18
FIG. 3.
Equivalent circuit diagram for an inductively coupled coil system with resonant primary and secondary. The emf induced in each coil is vi. The capacitive network and transmission line or LNA can be modeled by ZL and Cp, Fig. 2.
FIG. 11.
Equivalent circuit diagram for a single coil. The emf induced in the coil is vi. The capacitive network and transmission line or LNA can be modeled by ZL and Cp, Fig. 2.
In Fig. 3, the equalization coil is considered the primary and the SRS the secondary. One effect of the secondary on the primary is that the impedance of the secondary appears as an additional series impedance in the primary according to the relation4
| (2) |
In this equation, Rp + jXp is the impedance of the primary when considered by itself, Zs = Rs + jXs is the impedance of the secondary when considered by itself, and M is the mutual inductance between the two coils. Time harmonic fields varying as ejωt are assumed. Using Eq. (2), the impedance Zin at the primary capacitor can be written as
| (3) |
where the fourth-order denominator
| (4) |
In these equations, , Qp = ωpLp/Rp, , Qs = ωsLs/Rs, and the coupling coefficient . The complex eigenfrequencies can be found from the solutions of 𝒦 = 0. These eigenfrequencies can be expressed algebraically in closed form in terms of the five parameters defined after Eq. (4). The expressions are lengthy. These exact eigenfrequencies were used to verify the analysis presented below.
The real resonance frequencies of the circuit can be found by solving Re(𝒦) = 0. We find
| (5) |
where
| (6) |
There are two modes—a parallel low-frequency mode and a high-frequency anti-parallel mode.19 The real parts of the complex eigenfrequencies are different than these by order Q−2, as for the second-order system.
When the circuit is excited at resonance with a real frequency ω = ω0, which can be either of the resonance frequencies given by Eqs. (5) and (4) can be written as
| (7) |
where
| (8) |
Consequently, the input impedance at resonance can be written as
| (9) |
For any excitation frequency ω, the voltage gain vo/vip for an emf vip generated in the primary coil, Fig. 3, can be obtained from the circuit equations given in Appendix B,
| (10) |
For an emf vis generated in the secondary coil, the voltage gain is
| (11) |
Also, from the circuit equations in Appendix B, the secondary to primary current ratio is20
| (12) |
It can be shown that
| (13) |
What this means is that an emf induced in the secondary coil gives an output voltage at the primary is/ip times the same emf induced in the primary. For the coils used in this experiment, is/ip was about 3.5. This is a mutual inductance effect.
In the no-load limit ZL → ∞, the voltage gain for an emf induced in the primary becomes, at resonance, using Eqs. (7) and (10),
| (14) |
where
| (15) |
When the load impedance ZL is matched to Zin0, Eq. (9), which is within order 1/Q of critical coupling, it can be shown from Eq. (10) that
| (16) |
This result is exact.
The signal at the output of the primary for an emf induced in both coils can now be derived. The results are normalized to the signal at the output of the 15 mm loop used for comparison. The physics of Eq. (1) is that the emf induced by the spins in the coil is for a magnetic field produced by the coil for unit current in the coil. For simplicity, we use the formula for the magnetic field on the axis of a circular loop of radius R,
| (17) |
where μ0 is the magnetic permeability of free space and z is the axial distance from the plane of the coil. We consider a voxel 5 mm below the sample surface. For the 15 mm coil placed on the sample surface, we scale the emf using Eq. (17) with R = 7.5 mm and z = 5 mm,
| (18) |
Since the 25 mm coil is centered on the mid-plane of the 10 mm tall (Sec. III) SRS, the emf is scaled as
| (19) |
and for the SRS we use an average coil radius of 6.5 mm,
| (20) |
In Eq. (20) the factor of three comes from normalizing to unit current in the coil with three turns. Applying these scalings to the output voltages given by Eqs. (A12), (16), and (13), we obtain a signal enhancement factor for output voltage at the primary compared to the 15 mm coil
| (21) |
In Eq. (21), the term in parentheses is the ratio of the VRF of the inductively coupled coil system to the VRF of the 15 mm coil. The Q-ratio is also a natural result consistent with prior art and our original design rationale, see Ref. 1. The derivation shows how the superposition of the emf induced by the spins in each coil normalized to unit current in each coil appears in the primary output voltage. It is seen from Eq. (21) that there are three distinct reasons for signal enhancement: (1) the Q-ratio; (2) the number of turns of the SRS; and (3) the secondary to primary current ratio. The second enhancement factor has been used for surface coil design,11,12 see also Eq. (A13). However, conventional spiral surface coils tend to have low Q-value for reasons discussed in Ref. 1. The third factor (current ratio) seems new and accessible for a coupled coil system but not for a simple coil. The secondary to primary current ratio can be large near self-resonance of the secondary and increases the VRF proportionately. However, it is observed that as the current ratio increases, QPv tends to decrease, and the total signal enhancement ℰ tends to be a weak function of the five parameters. The enhancement factor dies for the low-frequency mode as k → 0 because the modes become separated, ω0+ → ωp, ω0− → ωs, Eq. (5).
By examining the ℰ factor with respect to variations in k and Q-values, it was found, for the low-frequency mode, that the maximum ℰ-value occurs near the square-root of the k-value for maximum power transfer4 between primary and secondary,
| (22) |
The coupling constant is therefore significantly larger than that required for maximum power transfer, typically by more than an order of magnitude. The additional square-root is consistent with maximizing voltage instead of power.
The signal enhancement involves an impedance transformation from the secondary to the primary due to strong coupling and resonance of the secondary. This occurs whether or not the primary is matched to a transmission line. There are two stages. One couples secondary to primary to maximize signal, and the second permits critical coupling of the resonant system to a transmission line. For a simple coil matched to a transmission line, critical coupling maximizes power transfer to or from the transmission line and the signal is presented only in this condition.
The eigenmode Q-value of the coupled system, obtained from the exact complex eigenfrequencies or Eq. (B9), tends to be between Qp and Qs for the parallel mode. The Q-value is closer to the coil that has the highest current. Perhaps surprisingly, this Q-value does not appear explicitly in the theory. However, it has been verified that this eigenmode Q-value corresponds to the (unloaded) Q-value as determined from the −3 dB points of the reflection coefficient (Zin − Zin0)/(Zin + Zin0) at the input to the coupling coil.
Thermal noise voltage fluctuations appear at vo, Fig. 3, and are proportional to the square-root of the real part of the input impedance.3,13,21,22 We assume that the bandwidth of the receiver is smaller than the bandwidth of the circuits, and that the same receiver bandwidth is used for both coil systems. From Eq. (9) it can be shown that
| (23) |
where Re(𝒦) = 0 was used. The ratio of noise between the inductively coupled system of coils and the 15 mm coil at the location vo (see Figs. 3 and 11 and Eq. (A13)) can then be written,23 using Eq. (A6), as
| (24) |
Perhaps surprisingly, the numerator of Eq. (24) can be smaller than the denominator for practical values of the parameters and for the coils tested in this study. This is true even though the inductance Lp is about 1.7 times the value of L (of the 15 mm loop). This can be true because the impedance transformation from secondary to primary reduces the resistance presented across the primary output capacitor, compare Eqs. (23)–(A6). The reduced resistance is caused by the secondary resonance in the fourth-order system and is reflected by the factor Re(QPv) in Eq. (23), see Eq. (15). This effect is not present in the second-order system, Eq. (A6). Therefore, the 4th reason that the coupled coil assembly can give an enhanced SNR is due to reduced noise at the primary output compared to a single coil.
Loading of a coil by the sample can be modeled as an additional series resistance in the coil.24,25 Consequently, the Q-values can be lowered to simulate sample loading.
Although Eqs. (21) and (24) can be combined, the result is not as compact as following Eq. (A13) for the second order system. Reasons include that the fourth order system is described using parameters for the primary and secondary separately and that there is a current ratio between the secondary and primary. (In a simple coil, the current in the coil is a constant making the signal and noise proportional.) However, it is natural to treat the signal and noise separately because signal depends on spatial position whereas noise does not. The calculation of signal is different from noise in theory, in the finite element simulations, and from the MRI data.
III. METHODS
Two receive-only coil systems were fabricated: a 15 mm surface coil and an assembly consisting of an SRS with a 25 mm outer “equalization” coil, illustrated in Figs. 1 and 2. The 15 mm coil is a standard surface coil made of copper with a nominal diameter of 15 mm, a thickness of 0.5 mm, and height of 2 mm. The loop geometry has a gap of 1 mm and two pegs for connecting to a printed-circuit (PC) board described below.
The SRS was fabricated from three turns of copper foil with an outer diameter of 15.1 mm and an inner diameter of 10.4 mm. The structure was cut from a CuFlon (Polyflon Company, Norwalk, CT) panel with 51 μm PTFE thickness and specified with 1/16 oz of copper. The 1/16 oz (per square foot) should have a thickness of 2.2 μm but was measured at a thickness of 5.5 μm by a four-point probe. Further discussion of this measurement with comparisons to other techniques and foils is described in Ref. 1. The CuFlon was cut into an 11.5 cm long by 1 cm wide strip using a rotary cutter and plastic mat. This strip was sandwiched between two 0.51 mm thickness PTFE strips (with no cladding) of length 12.7 cm and the same width, wound, and placed inside an ABS plastic 3D-printed case.26 The spacing between turns is 1.07 mm. Two additional PTFE strips of about 15 mm length were added around the outer diameter to raise the resonance frequency. An outer 25 mm equalization coil was placed co-axially surrounding the SRS coil, illustrated in Fig. 1(b). The 25 mm coil has an inner diameter of 25 mm and a thickness and height of 2 mm. Both the 15 mm and 25 mm coils were fabricated with electric discharge machining (EDM) by Integrity Wire (Sussex, WI).
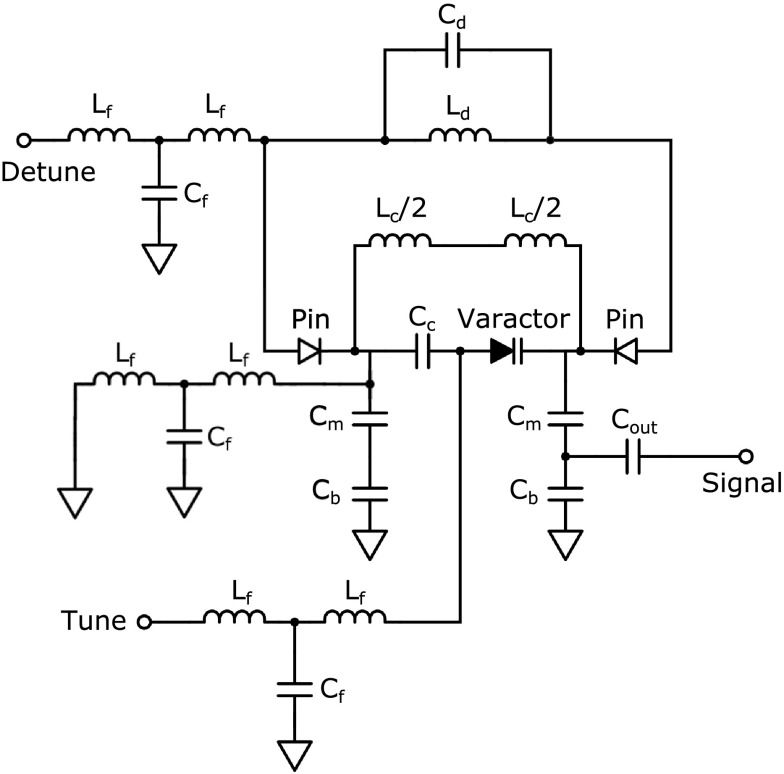
A PC board was fabricated by Streamline Circuits (Santa Clara, CA) with Rogers 5880 low-loss PC board material and 1/2 oz of copper. A balanced remotely tuned coupling circuit, shown in Fig. 4, was designed to be compatible with a Bruker 9.4 T small animal MRI system. The coupling circuit employs varactor-based tuning to change the resonant frequency to compensate for sample loading with an Aeroflex (Cobham, Dorset, UK) MGV125-25 E2NMS varactor. The capacitor Cc is used for initial tuning of the resonant frequency and to provide a bias to the varactor. The circuit is balanced by design, indicated by zero potential between the coil inductance (Lc), and matched by choosing the proper Cm and Cb.27 Initial values are chosen from Ansys (Canonsburg, PA) Designer simulations coupled to Ansys High Frequency Structure Simulator (HFSS) version 15. The signal is acquired through a Coast Wire (AlphaWire, Elizabeth, NJ) RG-316 doubled-shielded coaxial cable after a 100 pF capacitor (Cout), Fig. 4.28
FIG. 4.
Circuit used to couple to the 15 mm coil or alternatively the equalization coil. The varactor and chip capacitor Cc were omitted for coupling to the equalization coil.
A resonant circuit is in parallel with Lc when the Detune circuit activates (detune 3.3 V, receive mode −30 V) two Panasonic (Panasonic Industrial Devices, Newark, NJ) MA2JP02 pin-diodes (Pin). The Detune, Tune, and DC ground are each filtered by a low-pass filter with greater than −45 dB transmission at 400 MHz, determined by the Lf and Cf T-networks. All capacitors are American Technical Ceramics (ATC, Huntington Station, NY) 800R series which provide high self-resonant frequencies and low equivalent series resistance. Inductors are ceramic-core high-Q inductors from Coilcraft, Inc. (Cary, IL). All components are specified to be non-magnetic.
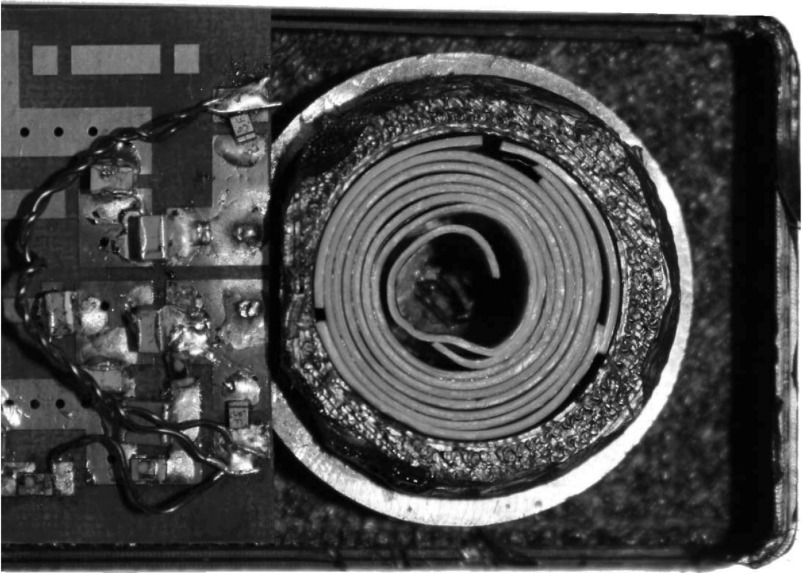
The fabricated SRS coil assembly is shown in Fig. 5. The equalization coil is concentric with the SRS and placed at the midpoint of the axial length of the SRS. In order to couple to the mode of interest, the equalization coil self-resonance frequency was designed at 451 MHz while the self-resonance frequency of the SRS coil was 435 MHz. For the SRS by itself, a Q-value of 480 was measured using a coupling loop and network analyzer described in Ref. 1. From the transmission line connected to the coupling coil, a Q-value of 114 was measured for the SRS coil assembly with a sample. The SRS coil assembly is over-coupled and resonates at 412 MHz without a sample. Phantom placement matches the system to −15 dB with a frequency of 402 MHz with no varactor or Cc present across the equalization coil, Fig. 4. The 15 mm surface coil has an unloaded Q-value of 150 with a sample and can be tuned to 400 MHz by the varactor.
FIG. 5.
Fabricated 3-turn SRS foil structure with an outer diameter of 15.1 mm and inner diameter of 10.4 mm located co-axially inside a 25 mm diameter equalization coil, which is used as a coupling coil. The CuFlon is sandwiched between two thicker and slightly longer strips of PTFE.
A Bruker 9.4 T small animal MRI system was used to obtain images from a 30 × 22 × 50 mm phantom made from 30% polyacrylamide tissue-equivalent substrate29,30 with a 1 mm G10 fiberglass epoxy spacer between the coil and the phantom. Multi-slice multi-echo (MSME) images were acquired with 21 slices, 1 mm slice thickness, 50 mm field-of-view at 128 × 128 voxel resolution, repetition rate of 1 s, echo time of 14 ms, 180° refocus flip angle over a total of 2 min, and 8 s scan time. The SRS coil assembly and 15 mm surface coil were used as receive-only coils with a whole body quadrature volume coil for excitation.
Signal and noise measurements were taken using the MSME data. Two regions of interest were defined for a coronal slice in the center of each surface coil: (i) a 25 mm wide by 25 mm deep region to estimate whole phantom performance and (ii) a 25 mm wide by 5 mm deep region to estimate cerebral cortex performance. The mean of the voxel intensity was taken as signal. In a second scan, the transmit attenuator was set to maximum and noise measurements were recorded as the standard deviation about the mean of the noise within the same region of interest. Noise was assumed to be Rician. Both signal and noise scans used the same MRI parameters. SNR measurements on a line were performed using AFNI by measuring the voxel intensity.
Performance of the 15 mm surface loop is regularly checked using a sealed standard phantom and compared to commercial products. The 15 mm surface coil follows the same design as a 10 mm surface coil previously published.26 Overall, performance of the 15 mm surface coil has been shown to be superior to 10 mm for deep rat brain studies while maintaining good surface signal intensity. Thus, the 15 mm has become our standard coil for fMRI studies.
Finite-element simulations were made using Ansys HFSS. A Dell Precision Tower 7910 with 24 Intel Xeon dual-core processors with Hyper-Threading and 512 GB of RAM was used. Metallic components are copper, and the material between the SRS foil layers is PTFE with a relative dielectric constant of 2.1. The resistivity of the conducting shield and the loss-tangent of the PTFE were set equal to zero. The foils were drawn using forty 0.25 mm wide adjacent duplicate structures on axis. The boundaries between adjacent foils facilitated meshing. An oversize polyacrylamide phantom of dielectric constant 57.1 and loss tangent 0.626 and dimensions 50 × 50 × 30 mm was simulated. A 1 mm thickness layer of G10 of dielectric constant 4.4 and loss tangent 0.02 was placed between the surface of the coils and the phantom, mimicking the experimental setup.
IV. RESULTS
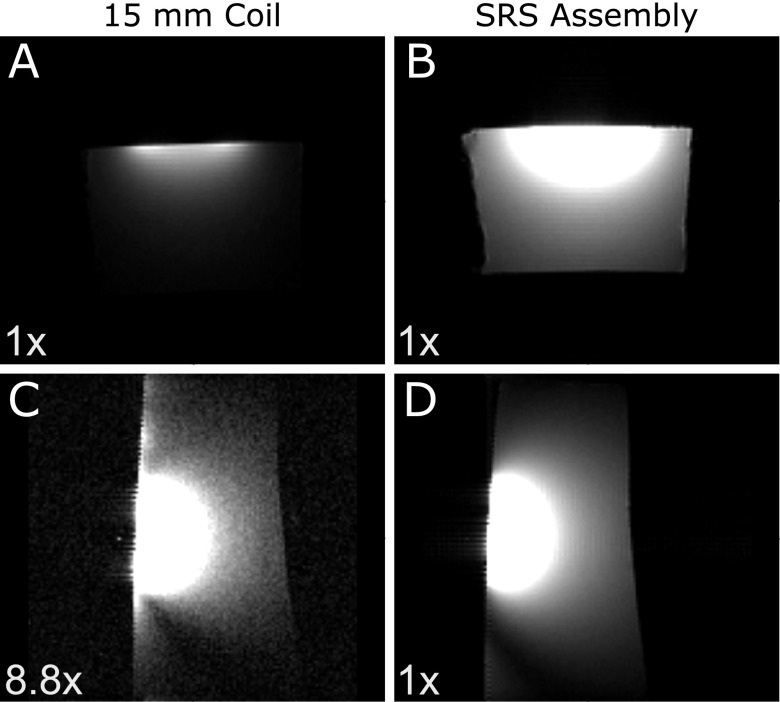
Figure 6(a) shows an MSME MRI axial image from the 15 mm surface coil compared to the SRS coil assembly in Fig. 6(b). Figures 6(a) and 6(b) are at equal dynamic range. SNRs were calculated for a 25 mm width by 25 mm height region-of-interest and a 25 mm width by 5 mm height region-of-interest as described in Sec. III. The SNR was 8.8 times higher for the SRS coil assembly for the 25 × 25 mm region and 7.0 times higher for the 25 × 5 mm region compared to the 15 mm surface coil, Table I.
FIG. 6.
Multi-slice multi-echo MRI data taken on a 30% polyacrylamide phantom with a 1 mm G10 spacer between the phantom and the coil. An axial slice is shown using the (a) standard 15 mm diameter surface coil and (b) SRS coil assembly. A sagittal slice is shown using the (c) standard 15 mm diameter surface coil and (d) SRS coil assembly. Dynamic ranges are indicated.
TABLE I.
Characteristics of measured and Ansys HFSS coil geometries.
| System | Q | Signal25 × 5 (mm) | Signal25 × 25 (mm) | Noise | SNR25 × 5 (mm) | SNR25 × 25 (mm) | |
|---|---|---|---|---|---|---|---|
| Measured | SRS assembly | 114 | 532 | 166 | 0.539 | 638 | 202 |
| 15 mm | 150 | 116 | 30.2 | 0.864 | 90.9 | 22.9 | |
| ratio | 4.59 | 5.50 | 7.02 | 8.81 | |||
| Simulated | SRS assembly | 100 | 30.4 | 17.4 | |||
| 15 mm | 129 | 6.71 | 4.16 | ||||
| ratio | 4.54 | 4.18 | 0.622 | 7.28 | 6.70 |
Figure 6(c) shows an MSME MRI sagittal image from a 15 mm surface coil compared to the SRS coil assembly (Fig. 6(d)). Here, the dynamic range of Figure 6(c) has been reduced by 8.8 times to enhance the profile. Figures 6(a), 6(b), and 6(d) are on the same dynamic range scale.
Simulations were performed to verify the SNR enhancement observed. Using Ansys HFSS driven mode, a lumped port was placed across the capacitor of the 15 mm surface coil or the 25 mm equalization coil and an impedance was chosen to provide critical coupling. Coils were compared by adjusting the input power to normalize the current to 1 A in the 15 mm coil and 25 mm equalization coil. The VRF was calculated in Ansys HFSS from the magnitude of the rotating component of the magnetic field perpendicular to the static field for one amp in the (equalization) coil. Thermal noise levels were calculated in Ansys HFSS by the square-root of the input resistance needed for critical coupling. Results are shown in Table I. The simulated signal is given in A/m.
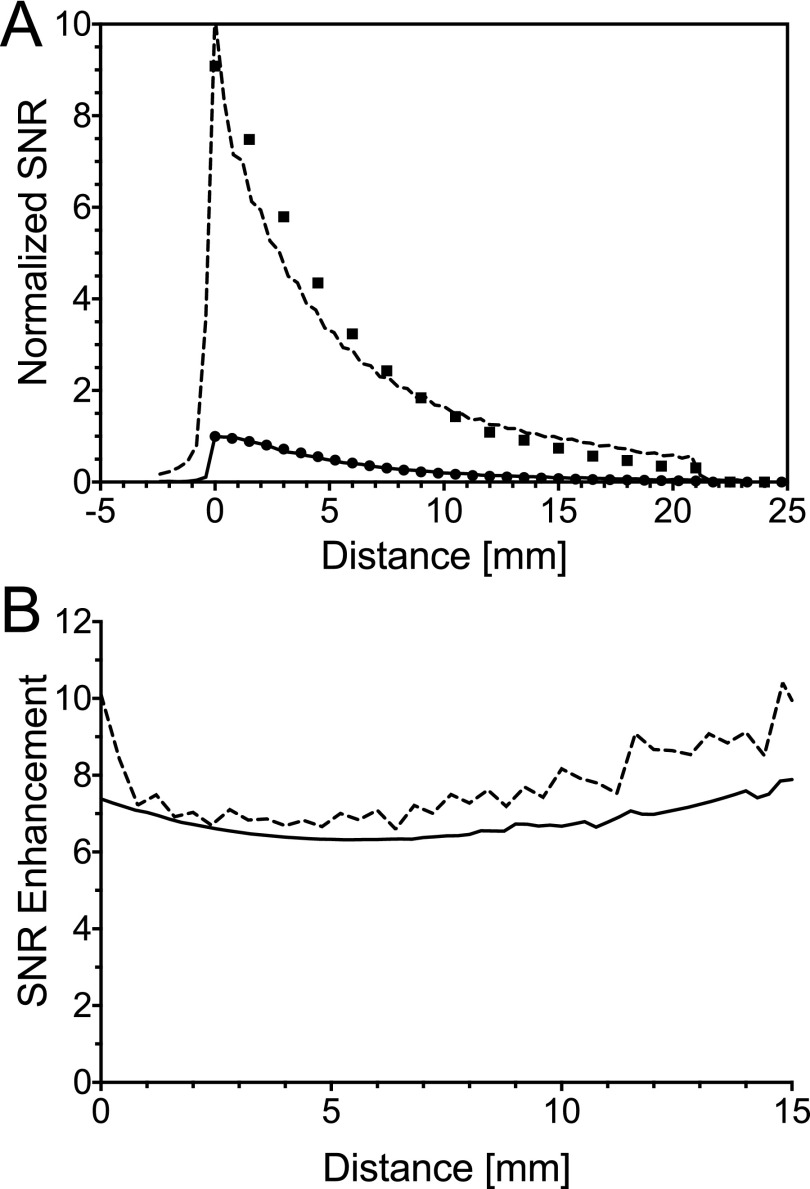
Shown in Fig. 7(a) is depth sensitivity SNR measured data compared to simulated SNR data. Measured data were taken along the axis of the coils of the center slice for the 15 mm surface coil, shown as a solid line, and the SRS coil assembly, shown as a dashed line in Fig. 7(a). The simulated VRF was scaled by the square-root of the resistance. The measured 15 mm and SRS coil assembly data are in good agreement to the simulated data, ● and ■, respectively. In Fig. 7(b) the SNR is normalized to the peak 15 mm surface coil signal at the axial point of the start of the phantom. The SNR enhancement ratio is calculated for the profile of Fig. 7(a) and plotted in Fig. 7(b), where simulated data are shown as a solid line and measured data as a dashed line. Measured data calculated past 15 mm were unreliable due to the SNR of the 15 mm coil. An average SNR enhancement of 7.8 and 7.0 is measured on axes over the plotted 15 mm depth for the experimental and simulation results, respectively. The noise ratio between the SRS coil assembly and 15 mm surface coil at vo, Figs. 3 and 11, of 0.62 was simulated. A direct measurement of the voltage ratio between the SRS coil assembly and the 15 mm coil in Ansys HFSS under conditions of unit current gave 3.38. This value is about 10% different than the ℰ value for the circuit model under the conditions of the third row of Table II.
FIG. 7.
SNR plots along the axis of the coil systems down the center slice. (a) SRS coil assembly measured (dashed) and simulated (■); 15 mm surface coil measured (solid) and simulated (●). (b) SNR for the SRS coil assembly relative to that for the 15 mm coil. Measured data are dashed and Ansys HFSS simulated data are a solid line.
TABLE II.
Predictions of the coupled circuit theory at 5 mm depth below the surface coils.
| fp (MHz) | fs (MHz) | Qp | Qs | Q | k | f0− (MHz) | is/ip | ℰ | 𝒩 | ℰ/𝒩 | Description |
|---|---|---|---|---|---|---|---|---|---|---|---|
| 451 | 435 | 350 | 500 | 350 | 0.15 | 412 | 2.80-j0.05 | 4.49 | 1.01 | 4.44 | No sample loading |
| 450 | 419 | 350 | 250 | 200 | 0.15 | 402 | 3.61-j0.17 | 4.67 | 0.93 | 4.99 | With sample loading |
| 450 | 419 | 350 | 150 | 200 | 0.15 | 402 | 3.60-j0.28 | 3.06 | 0.76 | 4.04 | Sample loading w/ lower Qs |
| 450 | 435 | 350 | 250 | 200 | 0.25 | 395 | 2.52-j0.05 | 4.51 | 1.23 | 4.51 | Sample loading w/ higher k |
| 450 | 409 | 350 | 250 | 200 | 0.10 | 401 | 5.42-j0.57 | 3.52 | 0.67 | 5.29 | Sample loading w/ lower k |
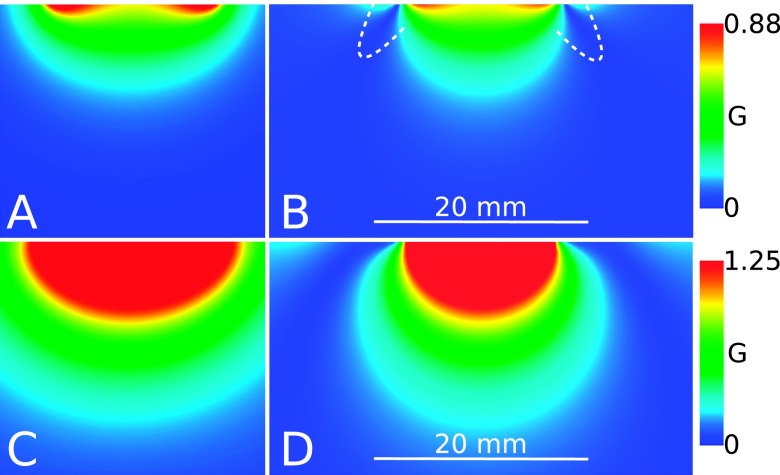
Shown in Fig. 8 are simulations of the VRF of the 15 mm coil compared to the SRS assembly. This figure can be compared to Fig. 6. The VRF of the SRS assembly is about 4.4 times stronger than the 15 mm coil. It also has a profile of similar size radially to the 15 mm coil. The major part of the VRF of the SRS assembly is due to the SRS. This is because the current per turn in the SRS is 3.38 times the current in the 25 mm coil. Tissue coverage in regions close to the surface is substantially improved when using the SRS assembly.
FIG. 8.
Magnitude of the rotating component of the rf magnetic field perpendicular to the static field for 1 A in the (equalization) coil: ((a) and (b)) 15 mm; ((c) and (d)) SRS coil assembly; ((a) and (c)) axial; ((b) and (d)) sagittal slice along the center line of the coil. Compare with Fig. 6.
When lines of rf magnetic flux are parallel to the static magnetic field, no MRI signal intensity exists, and the region of the image corresponding to this condition becomes black. This phenomenon occurs in a sagittal slice that is perpendicular to a circular surface coil and bisects it. Nearby slices also exhibit signal loss. The effect is evident in the simulation of Fig. 8(b) (emphasized by overlaid dashed white lines) as well as in the corresponding phantom image, Fig. 6(c). The useful coverage of the surface coil is reduced. This effect is not apparent in the simulations and phantom images using an SRS assembly. A qualitative explanation is that the current in the SRS assembly travels not only in the loop of the equalization coil but also in thin circular sheets of the meta-metallic coil. Loss of signal intensity is more dispersed.
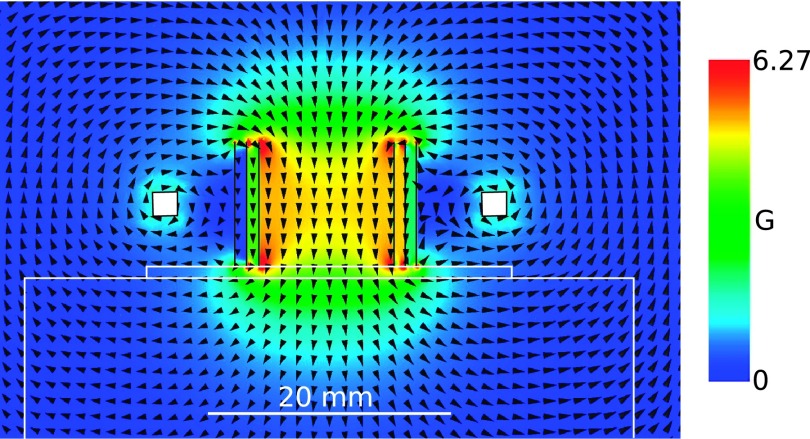
Another plot of the SRS assembly VRF is shown in Fig. 9. Here, the axial slice field of view cuts through both coils in order to show how the magnetic field produced by each coil adds together (vectorially) around the coils. Notice that in the annular region between the coils, the return flux of the SRS largely subtracts from the flux of the outer equalization coil. Since the average diameter of the SRS is 13 mm, the active region at the sample surface below the SRS assembly is comparable to the 15 mm coil. In addition, the flux of the two coils add constructively inside the SRS. The vector addition of the rf magnetic fields boosts the flux inside the SRS and causes the total return flux to occur mostly outside the outer equalization coil. These results suggest that the field below the SRS is not only stronger but also penetrates the sample to a greater depth.
FIG. 9.
VRF of SRS assembly. A 1 mm thick G10 spacer is placed between the SRS and the phantom. A near cancellation is seen in the magnetic field in the annular region between the coils. The fields from the two coils add constructively inside the SRS. The return flux from both coils goes primarily around the outer coil.
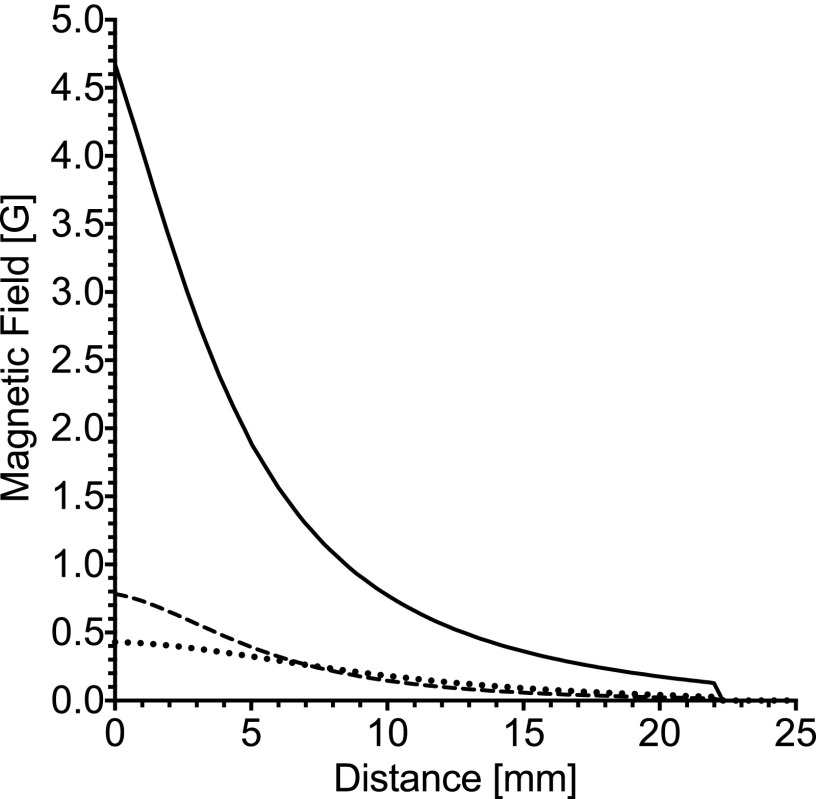
Finite-element simulations were also done for the configuration of the 25 mm coil alone with the coil placed on the G10 spacer. A comparison of the VRF for all three coil configurations is shown in Fig. 10. Each configuration was critically coupled. Several things are evident. First, the VRF is stronger for the SRS assembly than any other configuration, discussed above. Second, the 25 mm coil has a lower VRF under the coil than the 15 mm but higher VRF at depth. The classic crossover depth is exhibited. Finally, apart from a factor of about 4.5, the VRF of the SRS assembly has a similar profile to the 15 mm coil, consistent with Fig. 7.
FIG. 10.
VRF down the axis of the coil starting at the sample surface (0 mm) for the SRS assembly (solid), 15 mm (dashed), and 25 mm (dotted).
Shown in Table II are results from the circuit model for parameters corresponding to the fabricated coils. The first row corresponds to no sample loading. The frequencies fp = 451 MHz and fs = 435 MHz and Q-values Qs and Q were measured at the bench using the coupling loop and network analyzer described in Refs. 1, 31, and 32. The value of Qp was estimated since it had no coupling capacitor Cc, Fig. 4, but was connected to the coupling circuit. The k-value shown produces the coupled resonance frequency f0− shown in the table and corresponds to the coupled resonance frequency measured on the bench. In the second row, Qs and Q were lowered to simulate sample loading. In addition, fs was lowered to produce the observed coupled resonance frequency. The current ratio is/ip predicted by the circuit theory was compared to results from the Ansys simulation, which gave a ratio of 3.7. In Ansys, this ratio value was per turn of the secondary, consistent with the circuit model. With sample loading, the signal ratio ℰ predicted by the circuit model is close to the Ansys simulations, Table I. The SNR ratio ℰ/𝒩 increases, but there is less agreement with Table I and Fig. 7(b). Reasons for discrepancy can include (1) use of the formula Eq. (17) to estimate the rf magnetic fields produced by the coils and (2) that the circuit model does not account for changes to the rf current distributions in the coils, which can influence inductance and Q values. The third row of the table shows what happens when Qs is reduced—both the signal and the noise are reduced. This is consistent with SNR scaling as the square-root of the eigenmode Q-value. The fourth row shows that as the coupling constant is increased, the current ratio decreases, the signal increases, and the noise increases. The opposite happens when k is reduced. Maximum signal for the parallel mode occurs near the value given by Eq. (22). However, there is also a consideration not reflected in the circuit model that as the current in the coupling coil decreases, the perfect magnetic boundary condition is no longer presented to the SRS and so Qs will decrease for the reasons described in Ref. 1. In the present experiment, sample loading was dominant.
Several additional SRS assemblies were built and bench-tested in order to determine the importance of foil thickness on the performance. It was found that the Q-value of an SRS alone of 5.5 μm thickness is 621 when tested in a PTFE holder and inside an aluminum shield. This is consistent with results reported in Ref. 1. When placed in an ABS plastic holder, the Q-value goes down to 500, Table II. Both of these values are significantly higher than the 15 mm coil connected to the coupling circuit (350). In addition, the equalization coil by itself with a 2.4 pF capacitor to mimic the connection to the PCB and capacitive network was measured to be 500. This is also higher than the Q-value of the 15 mm coil. An SRS was built from thicker copper foil, measured as 38 μm. It was made from copper tape in which the adhesive was removed with toluene and acetone. It was found that the thicker SRS by itself has a Q-value only slightly lower (596) than the 5.5 μm SRS made from CuFlon (621). This is supported by finite-element simulations. For the present SRS geometry, the thin foil has lower losses in the flat part of the foil and greater losses on the foil edges1 compared to the thicker foil, resulting in a relatively similar Q-value. Measurements of the Q-values of the SRS assemblies were made. In parallel mode, the Q-value of the thin assembly was 575 and the thick was 514. In anti-parallel mode (555 MHz), the Q-values were 499 and 457, respectively. It appears from this that the effect of the equalization coil in suppressing the rf edge currents for the present SRS assembly geometry is inconclusive, again suggesting that further potential increase in Q-value due to the meta-metallic effect is possible. These results lead to the conclusion that there would be little difference in the MRI results between use of the thin foil SRS and a thicker foil SRS because body loading dominates in both cases.
V. DISCUSSION
In Ref. 1, a promising surface coil geometry with simplicity of fabrication was found to be an SRS surrounded by an equalization coil. High Q-values of the SRS and equalization coils compared to a resonant simple coil of similar diameter to the SRS improve body loading of the SRS assembly. A 1 mm thick G10 spacer was placed between the SRS and phantom to reduce electric field losses in the phantom. Because of the strong inductive coupling between foil layers in the SRS and between the SRS and the equalization coil, the phase of the magnetic field between different parts of the coupled system is coherent. Conveniently, the equalization coil can also be used to couple the SRS to a matching circuit and transmission line.
In Sec. II, four distinct factors that can increase SNR for the inductively coupled SRS system over the standard surface coil loop were identified: (1) high Q-value of the SRS causes dominant loading by the sample for small coil diameters; (2) the VRF is increased by the number of turns of the SRS; (3) the VRF is increased by the rf current ratio between secondary and primary (this ratio multiplies the number of turns); and (4) an impedance transformation between secondary and primary can cause the noise presented to the output of the coupling coil vo, Fig. 3 to be reduced compared to the output from a single coil vo, Fig. 11. The Ansys HFSS simulations, Sec. IV, show that the VRF of the SRS assembly is altered compared to a simple coil. The superposition of the emf induced by the spins in each coil normalized to unit current in each coil appears across the equalization coil. This superposition causes an increase in the VRF of the SRS assembly. The inductive coupling of the coils also transforms the equivalent resistance across the equalization coil. Both effects increase the SNR compared to a simple loop of comparable diameter to the SRS. An improvement in the VRF also occurs due to the field lines being more perpendicular to the sample surface. The field lines tend to go deeper into the sample. This can be seen in comparing Figs. 6 and 8 and also in Fig. 7.
Placement of a surface coil on tissue lowers the Q-value. If power is coupled to a surface coil placed on an aqueous phantom, the vector reception field is readily measured with a pick-up coil. It is apparent from this experiment that loss in Q-value is dominated by tissue very close to the surface. The SRS coil assembly introduced here reduces tissue loss of Q relative to a single-turn resonant loop in several ways: distributing the current that gives rise to the vector reception field over the thin foil, distributing the current among the layers of the coil, distributing return magnetic flux very broadly as it emerges from tissue, and eliminating the bunching of current filaments and lines of magnetic flux that are found with the single-turn loop.
In addition, eddy currents induced by the gradient fields are smaller than they are in a thick conducting loop. For example, using a gradient field rise time of 90 μs (1.8 kHz), the skin depth for these fluctuations is 1.6 mm. The foils of the SRS are transparent to these fluctuations.
The VRF is determined by the sum of currents in the equalization coil and the SRS, Fig. 9. These coils are strongly coupled resulting in two modes, one with the currents circulating in the same direction and one with currents circulating in opposite directions. The modes are well separated in frequency, and we have tuned the first mode to the Larmor frequency. Current in the equalization coil does improve depth sensitivity, while current in the SRS flows circumferentially in loops of continuously varying radial segments and depth sensitivity. Comparison with a simple coil reflects this complexity.
Further improvements of both the 15 mm and SRS coil assembly can be achieved by adding an onboard LNA in line with the transmission-line and coupling circuit. A simple loop surface coil of similar design with an onboard LNA and a 10 mm loop was used in Ref. 26. We routinely use 10 mm and 15 mm surface coils with onboard LNA to obtain fMRI data at 200 μm cubic resolution in rat brain. Adding an onboard LNA to the SRS coil assembly would allow for sub-100 μm cubic fMRI resolution in rat brain.
The coil assembly described here has many adjustable parameters including the L, C combination for each loop, the placement of each loop with respect to the subject surface, the height of each loop, the choice between inductive and capacitive-network coupling, and the number of turns of each loop. Meta-metallic technology can be improved for the SRS33 and used for both loops, probably with inductive rather than capacitive-network coupling. It appears that networks of the assemblies can be formed with overlap of loops to cancel mutual induction. Extension from two coaxial loops to three or four may be within reach, although the fourth order differential equation describing the circuit would rise to sixth and eighth orders. There appears to be substantial opportunity for further development of the coil concepts introduced here. Confirmation of coil performance by finite-element modeling of electromagnetic fields provides confidence that much of this extensive parameter space can be explored by computation.
VI. CONCLUSION
A practical SRS coil assembly was built and data were collected using a 30% polyacrylamide phantom. The SRS coil assembly showed a factor of 8.8 improvement in magnetic resonance SNR over a 25 × 25 mm region on a phantom compared to a 15 mm surface coil (simple loop). The strong mutual coupling between the coils in the assembly increased the VRF and SNR of the assembly compared to the simple loop coil. Results are consistent with the magnetic resonance theory of the emf generated in a coil, the theory of inductively coupled circuits, and the superposition principle. Other geometries shown in Ref. 1 can be used to build resonators for other applications such as nuclear magnetic resonance, electron paramagnetic resonance, and other types of signal detection.
Acknowledgments
This work was supported by P41 EB001980 and R01 EB000215 from the National Institute of Biomedical Imaging and Bioengineering (NIBIB) in the National Institutes of Health (NIH).
APPENDIX A: SECOND-ORDER CIRCUIT
Results presented in this appendix are consistent with Ref. 18. Consider the circuit of a single surface coil shown in Fig. 11. The input impedance at the capacitor can be written as
| (A1) |
where the second-order denominator
| (A2) |
, and Q = ω0L/R. The eigenfrequencies of the system can be found from the solutions of 𝒦2 = 0. We have, for the root with positive real part,
| (A3) |
| (A4) |
The real and imaginary parts of the eigenfrequencies satisfy as expected. From Eqs. (A3) and (A4) it is seen that the ring-down reflected in the exact eigenmode solution causes a lower real frequency by than the real resonance frequency obtained by solving Re(𝒦2) = 0.34
When the circuit is excited at resonance with a real frequency ω = ω0,
| (A5) |
Consequently, the input impedance can be written as
| (A6) |
At any frequency excitation, the voltage gain vo/vi for an emf vi generated in the coil can be obtained from the circuit equations,
| (A7) |
| (A8) |
| (A9) |
We find
| (A10) |
In the no-load limit ZL → ∞, the voltage gain becomes . At resonance, from Eq. (A5),
| (A11) |
When the load impedance ZL is matched to Zin0, Eq. (A6), which is within order 1/Q of critical coupling, it can be shown from Eq. (A10) that
| (A12) |
This result is exact.
Thermal noise voltage fluctuations at the output of the circuit are proportional to the square-root of the resistive part of the impedance.3,13,21 If the bandwidth Δf of the receiver is smaller than the bandwidth of the circuit, Eq. (A6) can be used. The SNR of the second-order system is, in the no-load limit, apart from phase,
| (A13) |
where kB is the Boltzmann constant and T is the temperature. If critically coupled, the SNR is a factor of smaller, Eq. (A12). Since Q = ω0L/R, the SNR is inversely proportional to the square-root of the effective coil resistance R. With the emf vi given by Eq. (1), the result is consistent with the literature.18 For a multi-turn coil, vi is proportional to the number of turns. For a large number of turns of wire much thicker than a skin depth, the proximity effect causes the coil resistance to be proportional to the square of the number of turns and SNR to be independent of the number of turns.35
APPENDIX B: FOURTH-ORDER CIRCUIT
For an emf vip generated in the primary coil and vis = 0, the six circuit equations, from Fig. 3, can be written as
| (B1) |
| (B2) |
| (B3) |
| (B4) |
| (B5) |
| (B6) |
For an emf vis generated in the secondary coil and vip = 0, the first four circuit equations, from Fig. 3, are the same as Eqs. (B1)-(B4). The remaining two equations can be written
| (B7) |
| (B8) |
The eigenmode Q-value of each mode can be found by substituting ω = ωr + jωi into Eq. (4) and solving Im(𝒦) = 0 for ωi. Use of results in the eigenmode Q-values of the two resonances,
| (B9) |
REFERENCES
- 1.Mett R. R., Sidabras J. W., and Hyde J. S., Rev. Sci. Instrum. , 084703 (2016). 10.1063/1.4961573 [DOI] [PMC free article] [PubMed] [Google Scholar]
- 2.Mett R. R., Sidabras J. W., and Hyde J. S., “High Q-factor magnetic resonance imaging radio frequency coil device and methods,” PCT international patent application PCT/US2015/61882 (20 November 2015).
- 3.Hoult D. and Richards R., J. Magn. Reson. , 329 (1976). 10.1016/j.jmr.2011.09.018 [DOI] [PubMed] [Google Scholar]
- 4.Terman F. E., Radio Engineers’ Handbook, McGraw-Hill Handbooks (McGraw-Hill Book Company, Inc., 1943). [Google Scholar]
- 5.Mett R. R., Hyde J. S., and Sidabras J. W., “Strongly coupled fourth-order resonance coil systems for enhanced signal detection,” U.S. provisional patent application 62/396 579 (19 September 2016).
- 6.Hoult D. and Deslauriers R., Magn. Reson. Med. , 411 (1990). 10.1002/mrm.1910160307 [DOI] [PubMed] [Google Scholar]
- 7.Froncisz W., Jesmanowicz A., Kneeland J., and Hyde J., Magn. Reson. Med. , 590 (1986). 10.1002/mrm.1910030412 [DOI] [PubMed] [Google Scholar]
- 8.Hoult D. and Tomanek B., Concepts Magn. Reson. , 262 (2002). 10.1002/cmr.10047 [DOI] [Google Scholar]
- 9.Bilgen M., Biomed. Eng. Online , 3 (2006). 10.1186/1475-925X-5-3 [DOI] [PMC free article] [PubMed] [Google Scholar]
- 10.Voll N., Mareci T., Constantinidis I., and Simpson N., Magn. Reson. Med. , 998 (2010). 10.1002/mrm.22268 [DOI] [PMC free article] [PubMed] [Google Scholar]
- 11.Kim K.-N., Kim Y.-B., and Cho Z.-H., J. Korean Soc. Magn. Reson. Med. , 103 (2012). 10.13104/jksmrm.2012.16.2.103 [DOI] [Google Scholar]
- 12.Eroglu S., Gimi B., Roman B., Friedman G., and Magin R., Concepts Magn. Reson. , 1 (2003). 10.1002/cmr.b.10068 [DOI] [Google Scholar]
- 13.Haacke E. M., Brown R. W., Thompson M. R., and Venkatesan R., Magnetic Resonance Imaging: Physical Principles and Sequence Design (John Wiley & Sons, 1999). [Google Scholar]
- 14.Equation (1) may not be valid for the following reasons: (i) the non-filamentary nature of the currents in the foil; (ii) wave retardation effects in the sample; and (iii) radiation damping.
- 15.Vergers C. A., in Handbook of Electrical Noise Measurement and Technology, 2nd ed. (TAB Professional and Reference Books, 1987), Chap. 5–6. [Google Scholar]
- 16.Choma J., USC Technical Report No. USC 02-0511, 2011.
- 17.Choma J., USC Technical Report No. USC 03-0511, 2011.
- 18.Mispelter J., Lupu M., and Briguet A., NMR Probeheads for Biophysical and Biomedical Experiments: Theoretical Principles & Practical Guidelines, 2nd ed. (Imperial College Press, 2006). [Google Scholar]
- 19.Mett R. R., Sidabras J. W., Golovina I. S., and Hyde J. S., Rev. Sci. Instrum. , 094702 (2008). 10.1063/1.2976033 [DOI] [PMC free article] [PubMed] [Google Scholar]
- 20.Equation (12) is consistent with Eqs. (1) and (2) of Ref. 9.
- 21.Nyquist H., Phys. Rev. , 110 (1928). 10.1103/PhysRev.32.110 [DOI] [Google Scholar]
- 22.Schremp E. J., “Amplifier sensitivity,” in MIT Radiation Lab Series Vol. 18 Vacuum Tube Amplifiers, edited by Valley S. and Waldman J. (McGraw-Hill, 1948), Chap. 12, pp. 496–614. [Google Scholar]
- 23.In this analysis, at the location vo in the circuits, the noise level is different between the two coil systems. It is convenient to consider the signal enhancement ratio and the noise ratio separately. When the signal and noise are coupled through the capacitive network to a transmission line, both the signal vs and noise vn are multiplied by the same S parameter. However, the S parameters are different for the SRS system (S21srs) and the 15 mm system (S2115mm). At the transmission line, the noise levels of the two systems are the same if matched to the characteristic impedance of the transmission line. Therefore, vnsrsS21srs = vn15mmS2115mm. From this, it follows that the signal ratio between the two systems at the transmission line is equal to the ratio of the SNRs of the two systems at vo. The same argument holds when matching to the input of an LNA instead of a transmission line.
- 24.Hayes C. E. and Axel L., Med. Phys. , 604 (1985). 10.1118/1.595682 [DOI] [PubMed] [Google Scholar]
- 25.Hoult D. I. and Lauterbur P. C., J. Magn. Reson. , 425 (1979). 10.1016/0022-2364(79)90019-2 [DOI] [Google Scholar]
- 26.Li R., Liu X., Sidabras J. W., Paulson E. S., Jesmanowicz A., Nencka A. S., Hudetz A. G., and Hyde J. S., PLoS One , e0119450 (2015). 10.1371/journal.pone.0119450 [DOI] [PMC free article] [PubMed] [Google Scholar]
- 27.Doty F. D., Entzminger G., Kulkarni J., Pamarthy K., and Staab J. P., NMR Biomed. , 304 (2007). 10.1002/nbm.1149 [DOI] [PubMed] [Google Scholar]
- 28.The PCB was designed to accommodate a particular LNA, WanTcom WMA9RA, between Cout and Signal, Fig. 4. Typical values of Cb and Cm are 2 pF and 3 pF, respectively. It can be shown that for these values, the impedance presented across the coil due to the network of five capacitors Cb, Cm, and Cout, Fig. 4, with Cout connected to a 50 Ω transmission line is equivalent to 7.3 kΩ in parallel with 0.72 pF. When Cout is connected to the 1.5 Ω LNA input, the impedance is 202 kΩ in parallel with 0.74 pF. This network capacitance can be part of Cp or C in Figs. 3 or 11 and the resistance ZL. See also Fig. 2. For critical coupling, . For the 15 mm coil, evaluation of Eq. (A6) results in Zin = 9.1 kΩ for Q = 150. Critical coupling to the point vo in Figs. 3 or 11 is achieved in practice by adjusting the body loading of the coil.
- 29.Gabriel S., Lau R., and Gabriel C., Phys. Med. Biol. , 2251 (1996). 10.1088/0031-9155/41/11/002 [DOI] [PubMed] [Google Scholar]
- 30.Andreuccetti D., Bini M., Ignesti A., Olmi R., Rubino N., and Vanni R., IEEE Rev. Biomed. Eng. , 275 (1988). 10.1109/10.1377 [DOI] [PubMed] [Google Scholar]
- 31.Ginzton E. L., Microwave Measurements (McGraw-Hill Book Company, Inc., 1957). [Google Scholar]
- 32.This definition of Q, e.g., Ch. 7 of 31 or Sec. 1.04 of 34, is often called the unloaded Q because it does not account for the loading of the external circuit, Ch. 7 of 31, Sec. 10.13 of 34. This is also consistent with Ref. 1.
- 33.According to Ref. 1, the optimum thickness for the meta-metallic effect of a 3-turn SRS at this frequency is one skin depth, 3.3 μm. It is also possible to further reduce the rf currents on the SRS foil edges with the equalization coil.
- 34.Ramo S., Whinnery J., and Van Duzer T., Fields and Waves in Communication Electronics (J. Wiley, 1965). [Google Scholar]
- 35.See, e.g., Secs. 1.1.2, 8.1.1, 8.1.3, 9.1.2, and 10.2.2 of Ref. 18.


