Abstract
Alternative splicing is widely recognized for playing roles in regulating genes and creating gene diversity. Consequently the identification and quantification of differentially spliced transcripts are pivotal for transcriptome analysis. However, how these diversified isoforms are spliced during genomic transcription and protein expression and what biological factors might influence the regulation of this are still required for further exploration. The advances in next-generation sequencing of messenger RNA (RNA-seq) have enabled us to survey gene expression and splicing more accurately. We have introduced a novel computational method, graph-based exon-skipping scanner (GESS), for de novo detection of skipping event sites from raw RNA-seq reads without prior knowledge of gene annotations, as well as for determining the dominant isoform generated from such sites. We have applied our method to publicly available RNA-seq data in GM12878 and K562 cells from the ENCODE consortium, and integrated other sequencing-based genomic data to investigate the impact of splicing activities, transcription factors (TFs) and epigenetic histone modifications on splicing outcomes. In a separate study, we also apply this algorithm in prostate cancer in The Cancer Genomics Atlas (TCGA) for de novo skipping event discovery to the understanding of abnormal splicing in each patient and to identify potential markers for prediction and progression of diseases.
Keywords: RNA-sequencing, Graph-based exon-skipping scanner (GESS), Alternative splicing (AS), Epigenetic
1 Introduction
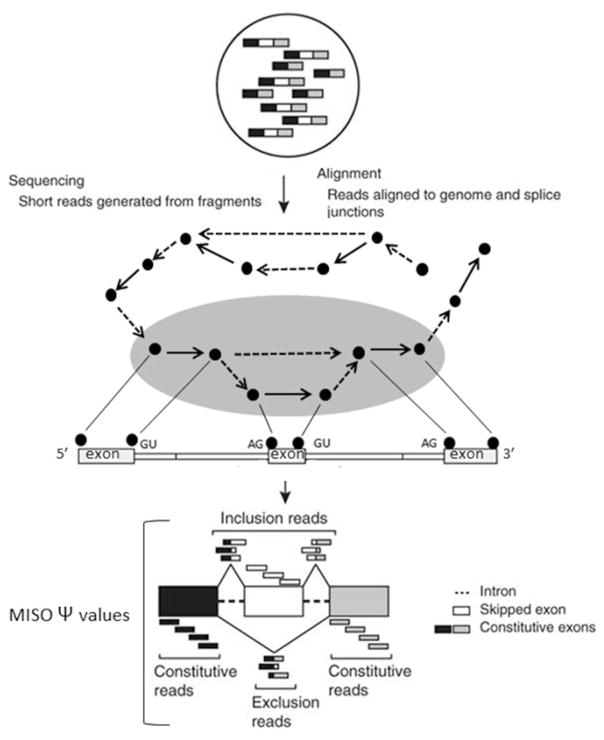
Exon-skipping is the most common alternative splicing mechanism known in mammals, and is a major contributor to protein diversity in mammals. Exon-skipping results in the loss of an exon in the alternatively spliced mRNA. In this mode, the middle exon in three consecutive exons may be included in mature mRNA under some conditions or in particular tissues, but may be excluded from the mature mRNA in others. Several computational methods have been developed to detect exon-skipping events, such as ASprofile [1], DiffSplice [2], and DSGseq [3]. Notably, all of the abovementioned methods have been proven to be useful in detecting novel motifs and deciphering the logics of alternative splicing [4]. To this end, our group has developed a novel computational method, graph-based exon-skipping scanner (GESS) [5] (detection scheme summarized in Fig. 1). Remarkably, a notable advantage of our GESS method is reflected in the capability of capturing de novo exon-skipping events from raw RNA-seq data without the prior knowledge of gene annotation information [6].
Fig. 1.
The scheme of the exon-skipping event detection pipeline (GESS)
Since the mechanism of transcriptional regulation in a cell is complex and dynamic, resulting in diverse outcomes under different physiological conditions, many current approaches for the identification of skipping event depend on annotated exon information. Not only such approaches may be unable to capture the full landscape of gene expression in situ, but also sometimes may lead to errors in the interpretation of results [7]. To the contrary, our GESS method rather builds a splice-site-link graph from first- hand, raw RNA-seq reads and then implements a walking strategy on this graph by iteratively navigating sub-graphs to reveal those with a pattern corresponding to an exon-skipping event. Thus, it can provide a more accurate and comprehensive picture of skipping events associated with a particular physiological condition within a cell. Furthermore, we integrated the MISO model into our method to determine which isoform, skipping- or inclusion- isoform, is the dominant transcript produced from a skipping- event site, where the maintenance of the subtle balance between the two mRNA molecules is indeed vital to cellular function and dynamics.
2 Methods
The flowchart in Fig. 1 exhibits the general protocol used for the discovery of de novo splicing events.
2.1 Tophat Splicing Aware Alignment
Input raw RNA-seq data set (either in single-end or pair-end sequences) in FASTQ or FASTA format.
Bad reads with low quality and ambiguous bases were filtered out.
Process the input data set in TopHat [8] and align the remaining reads to the reference genome (either human hg18/19 or mouse mm8/9/10).
-
Remaining set of unique aligned reads are composed of two subsets:
A set of aligned splicing-reads in which those reads are split between two genomic locations (presumably the putative exon’s junction).
A set of aligned constitutive-reads in which those reads are restrictively mapped to the same genomic location without splitting two locations (presumably within one exon).
2.2 Introduction to GESS
Assign the two chromosome positions of a junction revealed by a spliced-read into two nodes, each corresponding to the potential splice site.
Link the two nodes with an edge in a dotted line if a certain number (default parameter is 5) of spliced-reads are above the defined threshold.
Determine the direction of the line by examining the “GT- AG” consensus rule for most vertebrate introns since the dotted-line edge corresponds to an intron gap.
Calculate the coverage density among these splice sites using the set of constitutive-reads.
Link the two splice sites (nodes) with an edge in a solid line if higher density of reads between two splice sites. This type of edge should correspond to those exonic regions.
-
Sort these splice sites along the chromosome coordinates, and calculate the depth of coverage for each segment between the two adjacent splice sites (see Note 1).
As shown in Fig. 1 (the grey oval shape), a walking strategy on this graph by iteratively navigating the sub-graphs with pattern introduce an exon-skipping event.
Check the pattern which should conform to tri-exons with three solid edges, and the downstream exon would be connected to the upstream exon indicated by the dotted edges.
Ignore patterns that are not matched and move to next combination.
-
Define these confirmed sub-graphs as exon-skipping events with two possible combinations:
the inclusion combination (termed as inclusion isoform)—inclusion of the middle exon
the skipping combination (termed as skipping isoform)—exclusion of the middle exon
-
Integrate a MISO [9] model to calculate the ratio of two isoforms and determine which isoform is a dominant event in this cellular condition using the following formula.
Ratio of two isoformsFor more information on integration of MISO, please view the MISO website http://miso.readthedocs.org/en/fastmiso/.
3 Application to K562 and GM Cells (Lymphoid Origin)
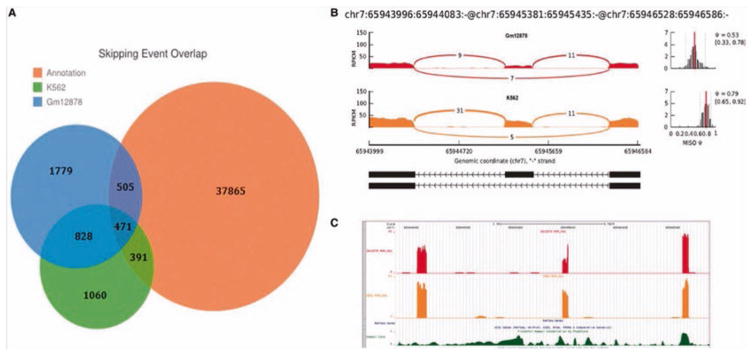
To demonstrate its performance and applicability, we applied the GESS method to publicly available RNA-seq data from K562 and GM12878 cells [10]. These two cell lines are ENCODE Tier 1 cell lines with many publicly available “omics” datasets for further analysis available for each [11]. Using GESS, we identified 2750 exon- skipping events in K562 cells and 3583 events in GM12878 cells. Of these events, 1299 were common to both cell lines (Fig. 2a). Comparing our results to the annotated exon-skipping database for the human genome, which contains 39,232 events and was downloaded from the MISO website, we found only ~30 % of our events overlapped previously annotated skipping events, with many unique skipping events being newly detected by our method. We also observed that a large amount of annotated events were not reported by GESS due to absent/low expression signals or splicing links in the RNA-seq data utilized. By comparing GESS-predicted skipping events with the annotated RefSeq database (UCSC HG19 RefSeq), in which each exon-skipping event can be mapped to a specific annotated gene, we found 40 skipping events that were not assignable to any known genes in K562 cells, while 34 events lacked annotations in GM12878 cells. As an example shown in Fig. 2b, we observed three adjacent exons on chromosome 7 covered by numerous reads in which the alignment pattern of splicing- reads revealed two isoforms with differential expression ratios in the two cell lines. However, no gene annotation information exists for this genomic region (see the RefSeq gene track in Fig. 2c) and no skipping event annotation can be found in the MISO dataset.
Fig. 2.
(a) A Venn diagram showing an overlapping comparison of exon-skipping events identified by GESS with the annotated events from the MISO website. (b) An exon-skipping event detected by GESS, in which both isoforms are present in K562 and GM12878 cells. (c) No RefGene information for this skipping event was found on the UCSC track (top panel); the coverage along the chromosome is also provided (bottom panel)
4 Application to PCa Patients
Prostate cancer (PCa) is the most common cancer and the second cause of cancer death among men in European countries [12]. In general, PCa is a highly heterogeneous disease, ranging from slow- growing tumors to rapidly progressing highly aggressive carcinomas associated with significant morbidity and mortality. Therefore, early detection of PCa by measuring prostate specific antigen (PSA) values at regular intervals in peripheral blood is important to identify men with aggressive cancers at early stage [13, 14] (Table 1).
Table 1.
Prostate cancer stage
| Stage I | The tumor is small and only in the prostate |
| Stage II | The tumor is larger and may be in both lobes of the prostate but is still confined to the prostate |
| Stage III | The tumor has spread beyond the prostate to close by lymph glands or seminal vesicles |
| Stage IV | The tumor has spread to other organs such as the bone and is referred to as metastatic cancer. If prostate cancer spreads, or metastasizes, to the bone, one gets prostate cancer cells in the bone |
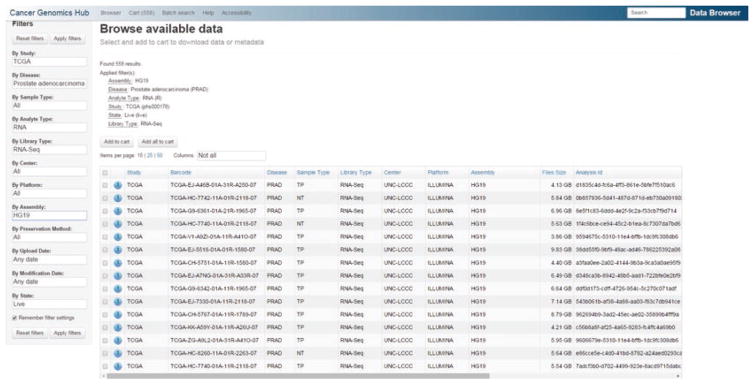
Next generation RNA sequencing data were generated by The Cancer Genomics Atlas (TCGA) consortium for 558 samples, 48 benign samples and 510 primary tumors. 96 of these samples represented advanced disease with Gleason grade ≥8 [15] (Table 2) and 33 cases had undergone progression as characterized by post- operative biochemical recurrence. Data were downloaded from the UCSC Cancer Genome Browser (Fig. 3) (https://browser.cghub.ucsc.edu/). Associated clinical data were downloaded from the TCGA Data Portal (https://tcga-data.nci.nih.gov/tcga/).
Table 2.
Gleason scores in categorical order
| Gleason 6 | The tumor tissue is well differentiated, less aggressive, and likely to grow more slowly |
| Gleason 7 | The tumor tissue is moderately differentiated, moderately aggressive, and likely to grow but may not spread quickly |
| Gleason 8–10 | The tumor tissue is poorly differentiated or undifferentiated highly aggressive and likely to grow faster and spread |
Fig. 3.
Screenshot of PCa raw RNA-seq data download page from the UCSC Cancer Genome Browser Data Portal (https://browser.cghub.ucsc.edu/)
Our Initial sequencing studies together with GESS illustrated previously suggest that the upregulation of selected splicing regulators in PCa, such as SAM68, SRSF1, or DDX5, directly contributes to the phenotype by altering the splicing profile of key genes [16]. The potential value of targeting specific components of the splicing machinery in cancer cells is also suggested by the antioncogenic properties of natural compounds, such as spliceostatin A (SSA), in a variety of cancer cell models. SSA targets the splicing factor 3B subunit 1 (SF3B1) of the spliceosome, thus affecting a large number of splicing events concomitantly [17]. The PCa genome appears to be characterized by rare SNP and frequent copy-number aberrations and genomic rearrangements. These rearrangements seem to arise in a punctuated manner, driving clonal expansion and evolution [18].
5 Correlation of Epigenetic Marks with Exon-skipping Events
It has been widely accepted that chromatin state plays essential roles in regulating gene expression. While DNA methylation, nucleosome occupancy and modifications of histone are all involved in determining the chromatin state, some transcription factors (TFs) can bind to specific regulatory regions to interact with chromatin and regulate gene expression [19]. All these factors can be considered as epigenetic features that regulate gene expression from a broad perspective [20].
In order to understand the relationship between chromatin modifications and exon skipping events, we analyzed “omics” data for two epigenetic marks associated with transcription elongation, H3K36me3 and H3K79me2 [21]. In GM12878 cells, we found that H3K36me3 is not only involved in coupling transcription and splicing events, but also in regulating splicing processes in a cell type- and perhaps gene site-specific manner. For H3K79me2, we observed that it is enriched over splice sites in the ψsml group versus the ψbig group in both cell types. Interestingly, with the exception of H3K79me2, the distribution of these transcription and epigenetic factors exhibited decreasing enrichment when progressing from an exon toward an intron. However, increasing enrichment was noted when progressing from an intron to an exon. This suggests these factors either may participate or show sensitivity to exon–intron boundary establishment. Taken together, our analysis suggests that different epigenetic factors may introduce a variable obstacle in the process of exon–intron boundary establishment leading to skipping events.
Footnotes
For each specific segment carrying a robustly higher signal ratio (i.e., 3.0) relative to the flanking background segments, a solid edge is introduced as an exon gap. Thus a complex graph would be obtained with intronic or exonic links among the splice sites.
References
- 1.Florea L, Song L, Salberg SL, et al. Thousands of exon skipping events differentiate among splicing patterns in sixteen human tissues. F1000Research. 2013;2:188. doi: 10.12688/f1000research.2-188.v1. [v2; ref status: indexed, http://f1000r.es/2dl] [DOI] [PMC free article] [PubMed] [Google Scholar]
- 2.Hu Y, Huang Y, Du Y, et al. DiffSplice: the genome-wide detection of differential splicing events with RNA-seq. Nucleic Acids Res. 2013;41:e39. doi: 10.1093/nar/gks1026. [DOI] [PMC free article] [PubMed] [Google Scholar]
- 3.Wang W, Qin Z, Feng Z, et al. Identifying differentially spliced genes from two groups of RNA-seq samples. Gene. 2013;518:164–170. doi: 10.1016/j.gene.2012.11.045. [DOI] [PubMed] [Google Scholar]
- 4.Laurent L, Wong E, Li G, et al. Dynamic changes in the human methylome during differentiation. Genome Res. 2010;20:320–331. doi: 10.1101/gr.101907.109. [DOI] [PMC free article] [PubMed] [Google Scholar]
- 5.Ye Z, Chen Z, Lan X, et al. Computational analysis reveals a correlation of exon-skipping events with splicing, transcription and epigenetic factors. Nucleic Acids Res. 2014;42:2856–2869. doi: 10.1093/nar/gkt1338. [DOI] [PMC free article] [PubMed] [Google Scholar]
- 6.Pushkarev D, Neff NF, Quake SR. Single-molecule sequencing of an individual human genome. Nat Biotechnol. 2009;27:847–850. doi: 10.1038/nbt.1561. [DOI] [PMC free article] [PubMed] [Google Scholar]
- 7.Foissac S, Sammeth M. ASTALAVISTA: dynamic and flexible analysis of alternative splicing events in custom gene datasets. Nucleic Acids Res. 2007;35(Web Server issue):W297–W299. doi: 10.1093/nar/gkm311. [DOI] [PMC free article] [PubMed] [Google Scholar]
- 8.Trapnell C, Pachter L, Salberg SL. TopHat: discovering splice junctions with RNA-Seq. Bioinformatics. 2009;25:1105–1111. doi: 10.1093/bioinformatics/btp120. [DOI] [PMC free article] [PubMed] [Google Scholar]
- 9.Katz Y, Wang ET, Airoldi EM, Burge CB. Analysis and design of RNA sequencing experiments for identifying isoform regulation. Nat Methods. 2010;7:1009–1015. doi: 10.1038/nmeth.1528. [DOI] [PMC free article] [PubMed] [Google Scholar]
- 10.Trapnell C, Williams BA, Pertea G, et al. Transcript assembly and abundance estimation from RNA-Seq reveals thousands of new transcripts and switching among isoforms. Nat Biotechnol. 2010;28:511–515. doi: 10.1038/nbt.1621. [DOI] [PMC free article] [PubMed] [Google Scholar]
- 11.The ENCODE Project Consortium. An integrated encyclopedia of DNA elements in the human genome. Nature. 2012;489:57–74. doi: 10.1038/nature11247. [DOI] [PMC free article] [PubMed] [Google Scholar]
- 12.Catalona WJ, Partin AW, Finlay JA, et al. Use of percentage of free prostate-specific antigen to identify men at high risk of prostate cancer when psa levels are 2.51 to 4 ng/mL and digital rectal examination is not suspicious for prostate cancer: an alternative model. Urology. 1999;54:220–224. doi: 10.1016/s0090-4295(99)00185-5. [DOI] [PubMed] [Google Scholar]
- 13.Jemal A, Bray F, Center MM, et al. Global cancer statistics. CA Cancer J Clin. 2011;61:69–90. doi: 10.3322/caac.20107. [DOI] [PubMed] [Google Scholar]
- 14.Shen MM, Abate-Shen C. Molecular genetics of prostate cancer: new prospects for old challenges. Genes Dev. 2010;24:1967–2000. doi: 10.1101/gad.1965810. [DOI] [PMC free article] [PubMed] [Google Scholar]
- 15.Clarke RA, Schirra HJ, Catto JW, et al. Markers for detection of prostate cancer. Cancers (Basel) 2010;2:1125–1154. doi: 10.3390/cancers2021125. [DOI] [PMC free article] [PubMed] [Google Scholar]
- 16.Berger MF, Lawrence MS, Demichelis F, et al. The genomic complexity of primary human prostate cancer. Nature. 2011;470:214–220. doi: 10.1038/nature09744. [DOI] [PMC free article] [PubMed] [Google Scholar]
- 17.Kornblihtt AR, de la Mata M, Fededa JP, et al. Multiple links between transcription and splicing. RNA. 2004;10:1489–1498. doi: 10.1261/rna.7100104. [DOI] [PMC free article] [PubMed] [Google Scholar]
- 18.Baca SC, Prandi D, Lawrence MS, et al. Punctuated evolution of prostate cancer genomes. Cell. 2013;153:666–677. doi: 10.1016/j.cell.2013.03.021. [DOI] [PMC free article] [PubMed] [Google Scholar]
- 19.Goodrich JA, Tjian R. Unexpected roles for core promoter recognition factors in cell- type-specific transcription and gene regulation. Nat Rev Genet. 2010;11:549–558. doi: 10.1038/nrg2847. [DOI] [PMC free article] [PubMed] [Google Scholar]
- 20.Barski A, Cuddapah S, Cui K, et al. High-resolution profiling of histone methylations in the human genome. Cell. 2007;129:823–837. doi: 10.1016/j.cell.2007.05.009. [DOI] [PubMed] [Google Scholar]
- 21.Wang ET, Sandberg R, Luo S, et al. Alternative isoform regulation in human tissue transcriptomes. Nature. 2008;456:470–476. doi: 10.1038/nature07509. [DOI] [PMC free article] [PubMed] [Google Scholar]


