Abstract
Ribosomal RNAs (rRNAs) account for >60% of all RNAs in eukaryotic cells and are encoded in the ribosomal DNA (rDNA) arrays. The rRNAs are produced from two sets of loci: the 5S rDNA array resides exclusively on human chromosome 1, whereas the 45S rDNA array resides on the short arm of five human acrocentric chromosomes. The 45S rDNA gives origin to the nucleolus, the nuclear organelle that is the site of ribosome biogenesis. Intriguingly, 5S and 45S rDNA arrays exhibit correlated copy number variation in lymphoblastoid cells (LCLs). Here we examined the genomic architecture and repeat content of the 5S and 45S rDNA arrays in multiple human genome assemblies (including PacBio MHAP assembly) and ascertained contacts between the rDNA arrays and the rest of the genome using Hi-C datasets from two human cell lines (erythroleukemia K562 and lymphoblastoid cells). Our analyses revealed that 5S and 45S arrays each have thousands of contacts in the folded genome, with rDNA-associated regions and genes dispersed across all chromosomes. The rDNA contact map displayed conserved and disparate features between two cell lines, and pointed to specific chromosomes, genomic regions, and genes with evidence of spatial proximity to the rDNA arrays; the data also showed a lack of direct physical interaction between the 5S and 45S rDNA arrays. Finally, the analysis identified an intriguing organization in the 5S array with Alu and 5S elements adjacent to one another and organized in opposite orientation along the array. Portraits of genome folding centered on the ribosomal DNA array could help understand the emergence of concerted variation, the control of 5S and 45S expression, as well as provide insights into an organelle that contributes to the spatial localization of human chromosomes during interphase.
Keywords: concerted variation, rDNA, genome structure, Hi-C, nuclear structure, nucleolus
Introduction
Ribosomes are essential for protein synthesis in all living organisms. In eukaryotes the ribosome is assembled from ∼80 protein subunits and 4 ribosomal RNAs (rRNAs). The rRNAs account for >60% of all RNAs in eukaryotic cells and are encoded in ribosomal DNA (rDNA) arrays (Warner 1999; Grummt 2003; Moss et al. 2007; Pederson 2011; Woolford and Baserga 2013). The 5S rDNA array encodes the 5S rRNA; the 45S rDNA array encodes the 45S rRNA subunits 18S, 5.8S, and 28S rRNAs. The subunits of the 5S and 45S arrays are not homologous and differences between the 5S and 45S rRNAs reflect deep evolutionary events. Transcription of 5S and 45S subunits by distinct RNA polymerase is conserved in yeasts, plants, humans, worms, and fruit flies. RNA polymerase I is dedicated exclusively to the transcription of the 45S rRNAs, whereas RNA polymerase III is dedicated to the transcription of the 5S rRNAs and tRNAs. Protein coding genes are transcribed from RNA polymerase II. It is therefore reasonable that the 5S rDNA array and the 45S rDNA arrays reside in different genomic locations in Drosophila, humans and several other eukaryotes. In humans, the 5S array is exclusive to chromosome 1 whereas the 45S array is localized to human acrocentric chromosomes 13, 14, 15, 21, and 22 (Hendersonet al. 1972, 1973; Wicke et al. 2011). The nucleolus is the intranuclear organelle that is the site of 45S rRNA synthesis (Warner 1999; Grummt 2003; Moss et al. 2007; Pederson 2011; Woolford and Baserga 2013). The extensive sequence conservation of ribosomal DNA (rDNA) subunits reflect their fundamental functional importance and is such that rDNA loci harbor the most widely used segments for phylogenetic analysis (Lane et al. 1985; Doolittle 1999; Turner et al. 1999; Mallatt and Winchell 2002).
Intriguingly, in some yeast and plant lineages, the 5S and 35S rDNA subunits (the 35S rDNA subunits in yeast and plants are homologous to the human 45S rDNA subunits) are adjacent to one another within a rDNA array unit (Petes 1979; Sone et al. 1999; Ganley and Kobayashi 2007; Wicke et al. 2011; Liu et al. 2013; Garcia et al. 2014). This is because in some plant and fungi lineages, the 5S subunit gained residency inside 35S arrays in spite of their transcription from different RNA polymerases (Sone et al. 1999; Wicke et al. 2011; Liu et al. 2013; Garcia et al. 2014). Evidence indicates that, at least in some cases, the configuration with 5S–35S in a single array evolved from ancestral arrays that were comprised exclusively of 5S units or 35S units (as is the case of the 5S and 45S arrays in Drosophila and mammals). For instance, the incorporation of 5S units into the 35S array appears to have occurred at least three times in plant evolution (Garcia et al. 2010; Garcia and Kovařík 2013). These alternative configurations point to the malleable genomic architecture of these arrays, and also suggest costs and benefits to 5S and 45S array residency on different locations versus their co-existence in a common array.
In humans, diploid copy number of the 45S rDNA ranges from about 60 to more than 800 units (Caburet et al. 2005; Ganley and Kobayashi 2007; Stults et al. 2008; Gibbons et al. 2014, 2015), whereas diploid copy number of the 5S rDNA unit varies from about 10 to more than 400 units (Gibbons et al. 2015). The 5S and 45S rDNA arrays show a strong correlation in copy number across genotypes that can be detected in human lymphoblastoid cells (LCLs), human whole blood, and mouse liver (Gibbons et al. 2015). This concerted copy number variation (cCNV) emerges despite the lack of sequence homology between 5S and 45S rDNA subunits and their residency on different chromosomes. Whereas the mechanism of cCNV remains undefined, cytological evidence might offer clues: it indicates that the 5S array localizes to the periphery of the nucleolus during interphase (Thompson et al. 2003; Nemeth et al. 2010; Fedoriw et al. 2012; Padeken and Heun 2014); cCNV might be facilitated if the 5S and 45S arrays are spatially close in the cell nucleus. However, the occurrence of multiple copies of rDNA units within the 5S and 45S arrays and the existence of 10 loci harboring 45S rDNA arrays per human diploid genome has hampered their sequence assembly. This issue has precluded the adoption of proximity ligation and sequencing technology (Dekker et al. 2002; van Berkum et al. 2010) to illuminate rDNA positioning in the cell nucleus. Indeed, the rDNA arrays were excluded from studies of nuclear architecture. Nevertheless, gaining insights about putative physical interactions between the 5S rDNA and the 45S rDNA arrays, and building contact maps between the rDNA and the rest of the genome is necessary to further our understanding of concerted rDNA variation, nuclear architecture, and nucleolar function.
Here we addressed the genomic architecture and repeat content of the 5S and 45S rDNA arrays across multiple assemblies and ascertained contact maps of the rDNA arrays using Hi-C datasets from two cell lines. We tested the occurrence of rDNA contacts between the 5S rDNA and 45S rDNA arrays as well as identified contacts between these loci and the rest of the genome. Interestingly, the contact map showed that the 5S and 45S rDNA arrays are not in close contact in the nucleus. Our results exhibit the repetitive structure of the 5S and 45S arrays and reveal thousands of cell-specific contacts between the rDNA arrays and the rest of the genome, pointing to specific chromosomes, genomic regions, and genes with evidence for close spatial proximity to the 5S and 45S rDNA arrays.
Materials and Methods
The 5S rDNA Array and Flanking Sequences in Alternative Human Genome Assemblies
We analyzed the status of the 5S array in four human genome assemblies: (i) Homo sapiens GRCh37 Primary Assembly (hg19), (ii) alternate assembly HuRef (J. Craig Venter assembly; GenBank GCA_000002125.2), (iii) alternate assembly CHM1_1.1 (Steinberg et al. 2014) and (iv) CHM1tert MHAP PacBio assembly (Berlin et al. 2015) (http://www.cbcb.umd.edu/software/PBcR/MHAP/). GRCh37 (hg19) is a widely used reference and historical standard. Two recent alternative assemblies (CHM1_1.1 and CHM1tert) are based on deep sequencing of a haploid genome using Illumina short sequencing reads (CHM1_1.1) or long PacBio sequencing reads (CHM1tert). Both recent assemblies also used recently developed assembly methodologies. The two alternative assemblies (HuRef and CHM1_1.1) are based on whole genome shotgun sequence aided or not by BAC clones. CHM1tert assembly is based on long reads and new assembly methods. Copy number along the segments was determined for two human LCL genotypes (NA18916 and NA19108) as previously described (Gibbons et al. 2014, 2015).
Unique single copy genes that flank the 5S array were used to exclude potential array fragments and aided in the identification of putative 5S arrays. The genes RNF187 and RHOU are immediately upstream (5′) and downstream (3′) to the 5S array, respectively, in all three assemblies (GRCh37, CHM1_1.1, and HuRef). For the PacBio CHM1tert assembly, we identified contigs containing 5S sequences by the following procedure. First, we searched all the assembled contigs using the conserved 5S sequence as a nucleotide query using BLASTn. Second, we use the presence of the flanking genes to further evaluate the contigs. Third, we used YASS (Noé and Kucherov 2005) and ClustalW (http://www.ch.embnet.org/software/ClustalW.html) to identify structural similarities among the contigs.
The 45S Array
We used a 45S rDNA unit with 45,337 bp nucleotides. It contains a core 13 kb element that includes the 18S, 5.8S, and 28S rRNA encoding segments, external transcribed sequences (ETS) and internal transcribed segments (ITS1 and ITS2), as well as a ∼32 kb non-coding intergenic spacer (IGS). The GenBank reference number is U13369.1 (Gonzalez and Sylvester 1995; Zentner et al. 2011). We included the promoter region from upstream (∼2 kb) (Gibbons et al. 2014), with the final human 45S rDNA unit including the promoter region, ETS1, 18s, ITS1, 5.8s, ITS2, 28S, ETS2, and IGS. Copy number along the segment was determined for two human LCL genotypes (NA18916 and NA19108) as previously described (Gibbons et al. 2014, 2015).
Hi-C Data Sources
We used two sources of Hi-C reads. The first was downloaded from NCBI’s Gene Expression Omnibus (GEO) Database with accession number GSE18199 (Lieberman-Aiden et al. 2009; van Berkum et al. 2010). The second sets of Hi-C reads were downloaded from accession number GSE63525 (Rao et al. 2014). Reads were converted from SRA to forward and reverse FASTQ files by the NCBI SRA Toolkit’s command (fastq-dump). Low quality bases and adapters were trimmed with Trim Galore (http://www.bioinformatics.babraham.ac.uk/projects/trim_galore/). These datasets were selected because of the depth of highly replicated data for LCLs, the cell line in which cCNV has been described. The LCL dataset contains multiple biological and technical replicates. K562 data were selected to access the replication of genome-wide rDNA contacts in another cell line for which biological and technical replicates were also collected with high depth.
GSE18199 corresponds to the original human Hi-C dataset with experiments conducted in two cell types (the LCL GM06990 and K562). For the LCL, Hi-C experiments were done with two restriction enzymes (HindIII and Ncol) and replicated two times for each enzyme for a total of four replicates. For the K562 cell, Hi-C experiments were done with the restriction enzyme HindIII and replicated twice.
GSE63525 corresponds to a recently collected high-coverage dataset with the LCL GM12878 and the K562 cell line. For the LCL, Hi-C experiments were done with two restriction enzymes (Mbol and DpnII). For Mbol, we used five biological replicates; three of those contain two technical replicates each. For DpnII, we used two biological replicates, with three and two technical replicates each. For the K562 cell, Hi-C experiments were done with the restriction enzyme Mbol and biologically replicated twice. One biological replicate includes two technical replicates. The other biological replicate includes four technical replicates.
Read Mapping
We independently mapped each end (forward and reverse) of the trimmed reads to the masked 5S repeat unit and masked 45S repeat unit using Bowtie2 (Langmead and Salzberg 2012). Trimmed reads were mapped in unpaired setting using the “very-sensitive” parameter (combinations of parameters: −D 20 −R 3 −N 0 −L 20 −i S, 1, 0.50). The mapping results were converted from sorted into binary format using the samtools (Li et al. 2009) and then converted into bed format using BEDTools (Quinlan and Hall 2010). Both 5S and 45S elements contain embedded or nearby Alu, Line1, and other repetitive elements. Also, due to the widespread occurrence of repetitive elements elsewhere in the human genome, the Hi-C analysis pipeline could produce spurious or ambiguous contacts. Unless otherwise stated, all mapping of Hi-C data was performed with masked rDNA sequences.
Randomization Test for 5S-45S Contacts
To address whether the number of 5S–45S contacts observed when the analysis is done with unmasked repeats is larger than the value expected by chance, we randomly selected 1,000 DNA segments from chromosome 1 and 1,000 DNA segments from the 1q42 region in which the 5S array is located. The segments had exactly the same length of the extended 5S rDNA unit (2121 bp) and were subjected to the same procedure to ascertain their contacts with the 45S. The 2121 bp segment includes the 5S unit (121 bp) and the 2 kb sequence between units (Sorensen and Frederiksen 1991).
Annotating rDNA-Gene Contacts
In order to identify genes that might be spatially associated with the 5S and 45S arrays we extracted the coordinates of each read mapped. We defined a “rDNA-gene contact” if a read has one end mapped to the rDNA arrays and the other end mapped in the interval between the first and last exon of a protein coding gene, using the GTF file from the Ensembl database (Homo_sapiens.GRCh37.75.gtf). GC content per gene was computed for the same intervals. Over-represented Gene Ontology terms were evaluated with the web based tool DAVID (Huang et al. 2007). P-values were corrected with Benjamini multiple testing procedure.
Results
Structure of the 5S Array and Flanking Sequences in Multiple Assemblies
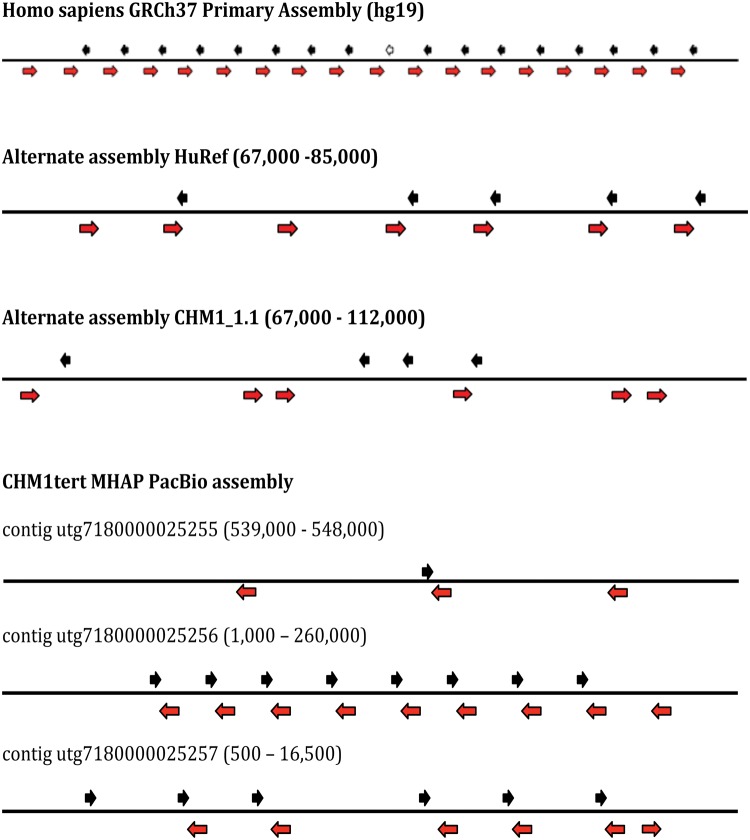
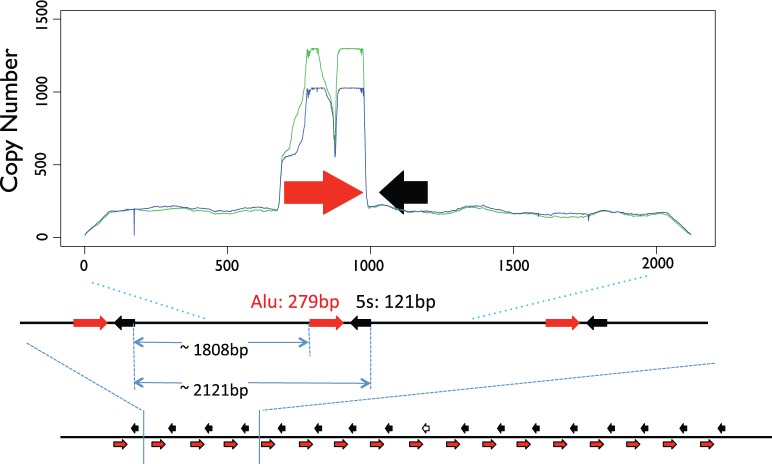
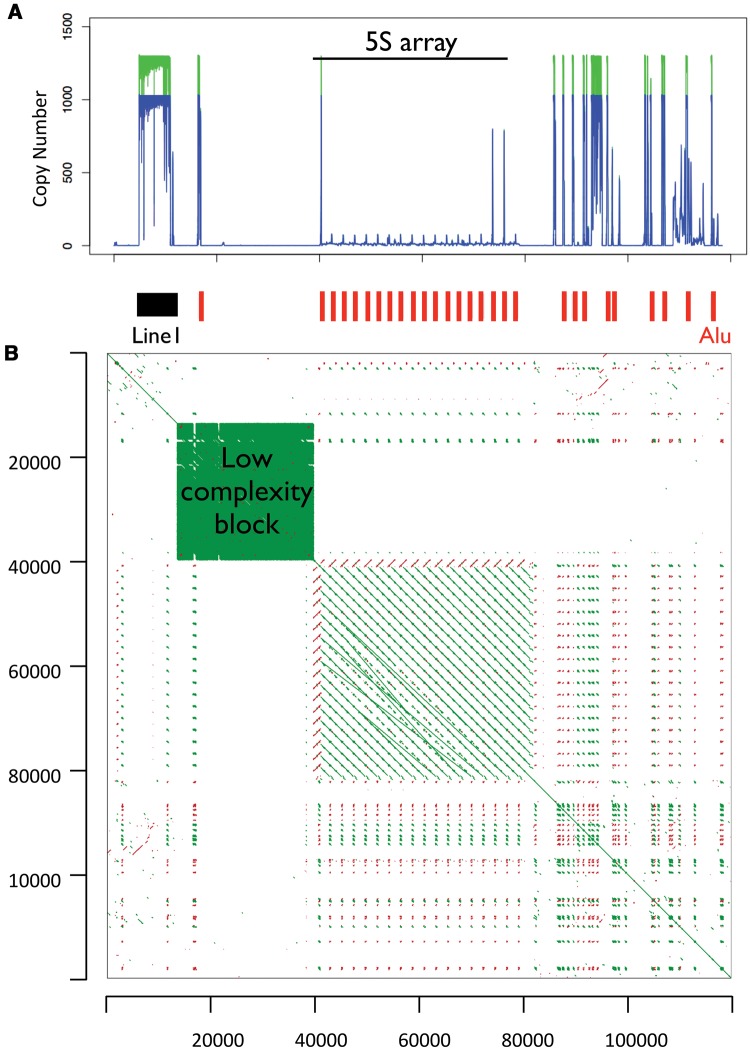
We extracted the 5S array in each of 4 assemblies. The coordinates of the array in each assembly is the following: (i) For GRCh37, the 5S array is in chr1: 228743523–228781906; (ii) for HuRef the 5S array is in chr1: 199189717–199279339; (iii) for assembly CHM1_1.1 the 5S array is in chr1: 229947334–230060501; (iv) in addition, we identified contigs containing the 5S array in the PACBIO assembly using BLASTn. For the identification of bona fide 5S arrays in CHM1tert, we queried the contigs with the conserved 5S sequence (121bp; complete sequence). We identified those containing multiple 5S sequences in tandem and displaying 100% identify to the conserved 5S sequence. Five contigs contained >1 5S segment with 100% identity with the full-length 121bp reference. ClustalW alignment indicated that contigs utg7180000025258 and utg7180000025259 did not contain extra information apart from the other three contigs utg7180000025255, utg7180000025256, and utg7180000025257. Therefore, we compared these three contigs in the PacBio assembly (CHM1tert) to the other genome assemblies. The results, which are based on the assembly of long PacBio reads, exhibit inconsistencies among the three contigs that cover the same regions and highlight the repetitive and complex landscape of the 5S rDNA region. This variation partially reflects the challenge of assembling rDNA arrays. Nevertheless, a few features consistently appear across multiple assemblies (fig. 1, supplementary table S1, Supplementary Material online). First, several genome assemblies displayed an Alu element located adjacent to a 5S element; Alu elements were defined if they were >90% identical to the Alu reference. Curiously, a single Alu element of 277 bp is adjacent to all 5S sequences in the GRCh37 assembly, with 37 bp separating Alu and 5S. All 5S and Alu elements are oriented in opposite directions. Similarly, in the CHM1tert PacBio assembly 5S units are paired with an Alu sequence in opposite direction (figs. 1 and 2), although some assemblies show variable intergenic segments between each Alu-5S pair. In contig utg7180000025256, we observed eight evenly spaced 5S units with 100% similarity to the 5S reference, all of which are coupled with an adjacent Alu element in the opposite direction, as expected from the GRCh37 assembly. Second, contigs from the CHM1tert PACBIO assembly as well as the GRCh37 assembly showed a ∼20 kb low complexity sequence segment and immediately upstream to the 5S array (fig. 3; green box) as well as a Line1 element upstream of this low complexity block. In addition, several Alu elements reside downstream of the 5S array. Analyses of copy number along the 5S rDNA array unit showed that sites outside of the Alu element displayed stable coverage (fig. 2).
Fig. 1.—
Organization of the 5S rDNA array in multiple assemblies. The red arrows represent Alu elements; black solid arrows represent 5S units. Coordinates are for the segment in chromosome 1 of the HuRef and CHM1_1.1 assemblies or for the segment in the contigs of the CHM1tert assembly.
Fig. 2.—
Detailed structure of the 5S repeat unit and copy number along the unit. The red arrows represent Alu elements; black solid arrows represent 5S elements with 100% identity to the reference. The graph shows the profile of normalized read-depth (copy number) along the 5S rDNA repeat unit for two individuals (NA18916 and NA19108).
Fig. 3.—
Structure of the genomic segment containing the 5S rDNA array. The figure displays the 5S array (∼40 kb) and upstream and downstream segments (40 kb on each side of the array) in the 1q42 region of hg19. (A) Line1 and Alu sequences in the 5S rDNA array region and normalized read-depth (copy number) along the segment for two individuals (NA18916 and NA19108). Red vertical bars below the graph denote the position of Alu sequences; the black rectangle denotes a Line1 insert. The 5S array is located between nucleotides 40,000 and 80,000. (B) Dot plot of the region. The plot displays segments of local similarity in the 5S rDNA arrays and adjacent sequences. One sequence is represented on each axis and significant matching regions are distributed along diagonals in the matrix. Green lines represent sequences that align on the forward strand and red lines represent for sequences that match on the reverse strand. The green box is indicative of a ∼20 kb low complexity region adjacent to the 5S array (the low complexity region is also observed in contigs from the CHM1tert PacBio assembly). Gene RNF187 is upstream the low complexity region and gene RHOU is downstream of the 5S array.
Structure of the 45S rDNA Arrays
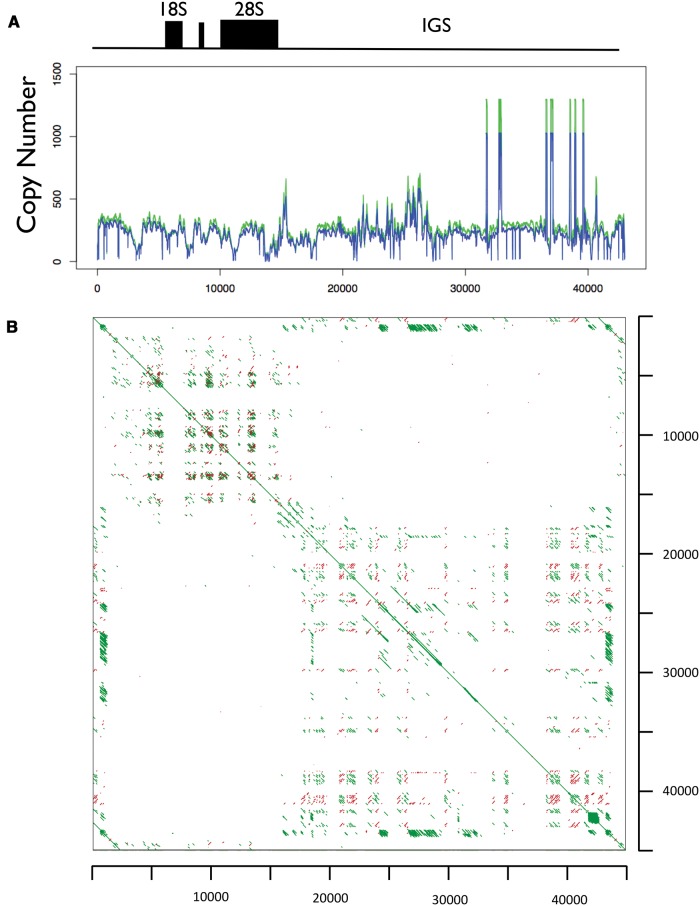
The 45S array is unresolved in the GRCh37 assembly of the human genome as well as on the recent assemblies based on long reads. In view of this, we decided to focus exclusively on the core 45S rDNA array repeat unit of 43 kb; it contains the 18S, 5.8S, and 28S rRNA encoding regions and the promoter, internal transcribed spacer (ITS) as well as external transcribed spacer (ETS) regions, and a the intergenic segment (IGS). The segment is GC-rich and does not harbor conserved Line1 elements (fig. 4). Segments with similarity to Alu elements are present on the IGS (fig. 4). Interestingly, the array unit displays uneven sequencing coverage along its length (fig. 4).
Fig. 4.—
Structure of the 45S rDNA array. (A) Profile of normalized read-depth (copy number) along the 45S rDNA repeating unit for two individuals (NA18916 and NA19108). (B) Dot plot for the 45S rDNA array unit (∼45 kb). We used a reference 45S rDNA unit with 45,337 bp nucleotides, which includes the promoter region, ETS1, 18S, ITS1, 5.8S, ITS2, 28S, ETS2, and IGS. Green lines represent sequences that match on the forward strand and red lines represent for sequences that match on the reverse strand. Lines off the main diagonal represent sequence similarity between different parts of the 45S rDNA repeat unit.
Identification of Hi-C Reads That Map to the 5S or 45S rDNA Arrays
First, we studied the original human Hi-C data (Lieberman-Aiden et al. 2009; van Berkum et al. 2010) and identified 562 reads that mapped to the repeat masked 5S rDNA array, and 74,692 reads that mapped to the repeat masked 45S rDNA array. We extracted reads that map to the 5S rDNA array (masked for repeats) and mapped the opposite end to the whole genome. The procedure identified 504 reads with one end mapped to the 5S and the other end mapped to the remainder of the genome. Similarly we extracted reads that map to the 45S rDNA reference (masked for repeats) and mapped the other end to the whole genome. The procedure identified 66,162 reads with one end mapped to the 45S rDNA and the other end mapped to the rest of the genome. Second, to validate the analyses, we studied recent high-depth human Hi-C data (Rao et al. 2014) and identified 89,557 reads that mapped to the masked 5S rDNA array (supplementary table S2, Supplementary Material online) and 7,691,535 reads that mapped to masked 45S rDNA array (supplementary table S3, Supplementary Material online). We extracted reads that map to the 5S and 45S rDNA array (masked for repeats) and mapped the opposite end to human DNA repeat libraries. This procedure tags less than 20% of the reads, which were excluded from further analysis. The remainder reads were then mapped to the whole genome. The procedure identified 68,729 reads with one end mapped to the 5S and the other end mapped to the remainder of the genome. Similarly, the procedure identified 4,239,516 reads with one end mapped to the 45S rDNA and the other end mapped to the rest of the genome.
Reproducible rDNA Contacts in All Chromosomes
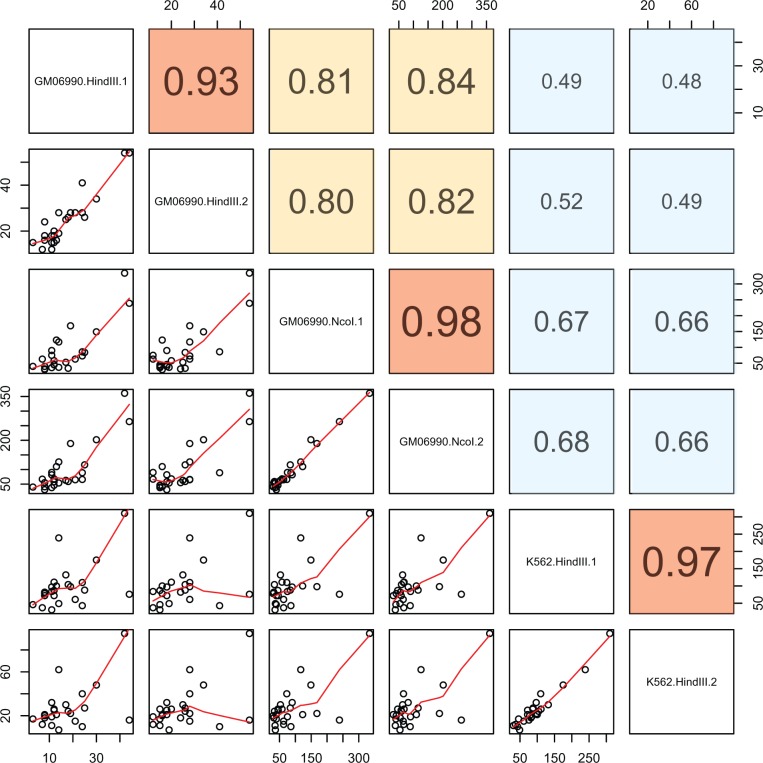
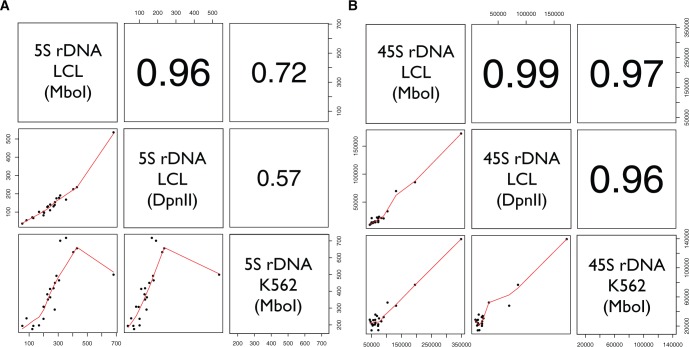
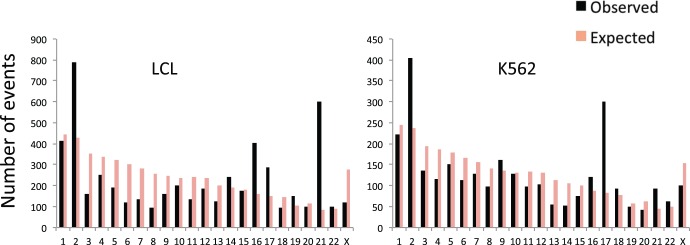
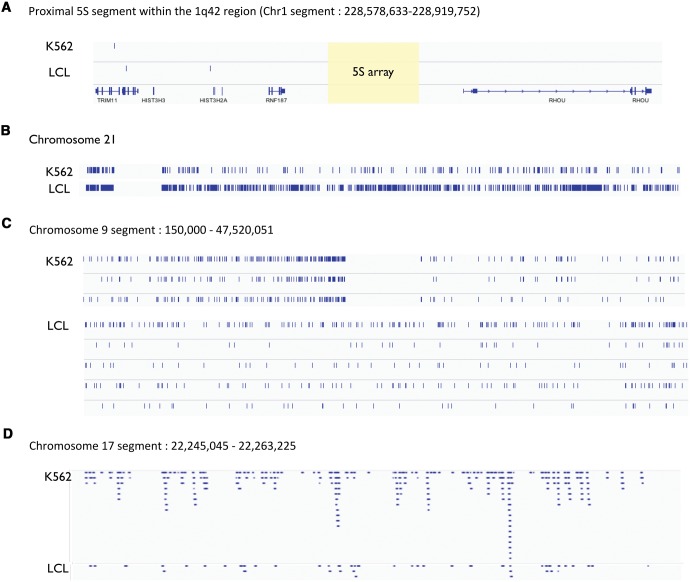
Next, we identified rDNA-genome contacts and determined the number of rDNA contacts with each human chromosome. We observed consistent results across biological replicates and different cell lines (fig. 5). Specifically, we observed good reproducibility between replicates of a cell line using the same restriction enzyme (ρ > 0.93 for all datasets; P < 0.001; fig. 5) as well as different restriction enzymes (ρ > 0.80 for all pairwise contrasts; P < 0.001; fig. 5). On the other hand, we observed more modest reproducibility between experiments conducted with LCL and K562 (ρ = 0.49–0.66 for all contracts between the LCL and K562 contacts; P < 0.001; fig. 5). This means that contacts with the 45S rDNA display detectable conservation in different cell lines (GM06990 and K562). These observations were replicated in the higher density dataset, including a high reproducibility between biological replicates with different enzymes and cell lines for both the 5S (supplementary fig. S1, Supplementary Material online; fig. 6a) and the 45S (supplementary fig. S2, Supplementary Material online; fig. 6b). The data also showed statistically significant biases in the density of rDNA contacts with each chromosome. For instance, chromosome 2 was significantly enriched in rDNA contacts for both cell lines (P = 2.2e−16, Odds ratio = 1.98 in LCL; P = 2.445e−12, Odds ratio = 1.82 in K562; Fisher's exact test). On the other hand, the data also revealed differences between cell lines. Specifically, we observed an enrichment of rDNA contacts in chromosome 16 and chromosome 21 in the LCLs (P < 2.2e−16, Fisher’s exact test; fig. 7a and b), whereas we observed an enrichment of rDNA contacts in chromosome 17 in the K562 line (P < 2.2e−16, Fisher’s exact test; fig. 7a and b). Chromosomal biases were also replicated in the high-density dataset. For instance, chromosome 2 remained significantly enriched in rDNA contacts for both cell lines (P < 2.2e−16, Odds ratio = 2.37 and 3.80 in LCL for both enzymes; P < 2.2e−16, Odds ratio = 2.32 in K562; Fisher's exact test). Finally, visualization of the contact map shows unique contacts with similarities and differences in each cell line (fig. 8a–d). For instance, rDNA contacts with chromosome 21 appear distributed across the entire length of the chromosome (fig. 8b) with higher density on the LCL (fig. 8b). On the other hand, a segment on chromosome 9 shows an rDNA contact desert that is exclusive to K562 (fig. 8c). Finally, a segment on chromosome 17 shows a higher density of reads in K562, whereas sparse representation in the LCL (fig. 8d).
Fig. 5.—
Reproducibility of 45S rDNA contacts in experimental replicates and cell lines across 6 Hi-C datasets. Each dot represents the number of contacts identified in each chromosome. Red lines in the lower panels are loess smoothers. Upper panels show the spearman rank correlation between experiments. Red boxes show the correlation between replicates for the same enzyme. Yellow boxes show correlation between experiments using two different enzymes (HindIII and NcoI). Blue boxes represent correlations between the two cell lines (LCL genotype GM06990 and K562). All correlations are statistically significant (P < 0.001).
Fig. 6.—
rDNA contacts identified in LCL and K562 cells. (A) Contacts between the 5S array and each chromosome in experiments with two enzymes (Mbol and DpnII) and two cell lines (LCL and K562). (B) Contacts between the 45S array and each chromosome in experiments with two enzymes (Mbol and DpnII) and two cell lines (LCL and K562). Each dot represents the number of contacts identified in each chromosome. Red lines in the lower panels are loess smoothers. Upper panels show the spearman rank correlation between datasets. All correlations are statistically significant (P < 0.001).
Fig. 7.—
Variable number of 45S rDNA contacts in each human chromosome. The black bars represent the number of contacts observed between the 45S rDNA and the human genome (hg19) for each chromosome in two cell lines (LCL and K562). The orange bars represent the number of contacts expected between the 45S rDNA and the human genome (hg19) for each chromosome. The expected numbers were calculated from the total number of reads mapped to the rDNA in each cell line and the size of each chromosome. Chromosome 2 and chromosome 21 are significantly enriched for rDNA contacts in both cell lines (P < 0.001 in each cell line, Fisher’s exact test), whereas chromosome 16 and 17 are enriched in LCL and K562 cells (P < 0.001 in each case, Fisher’s exact test), respectively. Data summary for the 6 Hi-C experiments shown in figure 5.
Fig. 8.—
Visualization of rDNA contacts in specific segments and chromosomes. (A) The panel shows the segment in which the 5S rDNA arrays are located with no evidence of contact with the 45S rDNA arrays. The yellow box indicates the location of the 5S array. Genes RNF187 and RHOU are located upstream and downstream of the 5S rDNA arrays, respectively. (B) The panel shows contacts between the 45S rDNA and chromosome 21 for LCLs and K562 cells. Note that the rDNA contacts are dispersed across the entire chromosome. (C) The panel shows contacts between the 45S rDNA and a segment in chr9 (interval 150,000–47,520,051). Lanes show 45S rDNA contacts in K562 (two biological replicates shown below it) and in the LCLs (four biological replicates shown below it). (D) The panel shows 45S rDNA contacts on a segment in chromosome chr17 (interval 22,245,045–22,263,225) in the expanded view mode. Each blue bar represents evidence from one 45S rDNA contact. Note the higher number of contacts in K562.
Intra-rDNA Contacts and Lack of 5S–45S Contacts
We observed that ∼10% of 5S reads had both ends mapped inside the 5S array, whereas >25% of the 45S reads had both ends mapped inside the 45S arrays (supplementary tables S2 and S3, Supplementary Material online). This suggests the possibility that there are relatively large proportions of rDNA molecules folding into one another, although the pattern could also be due to the existence of multiple rDNA copies in an array and the higher probabilities of ligation between contiguous sequences. On the other hand, not a single read had ends mapping to both the 5S and the 45S arrays after masking the arrays for repetitive elements. These results indicate that the 5S rDNA array is not in close spatial proximity to the 45S rDNA array. Whereas masking repetitive elements (e.g., Alu) eliminates a potential confounding, it also excludes the possibility that 5S and 45S arrays might come into contact via repeats. In order to investigate the issue, we implemented the analysis pipeline with unmasked rDNA sequences for both 5S and 45S arrays, and identified 72 contacts between unmasked 5S and 45S in one dataset. All these contacts were mediated by the Alu sequence adjacent to the 5S unit. However, analysis of random segments shows that the number of observed contacts between unmasked 5S and 45S rDNA is not higher than the number of contacts observed for randomly selected unmasked segments with the same length (supplementary fig. S3, Supplementary Material online). Combined with the results using repeat masked rDNA arrays, the data argues that a meager number of contacts between 5S and 45S could be explained by the existence of Alu sequences, but the event is not more frequent than would have been expected by chance (supplementary fig. S3, Supplementary Material online). Visual inspection of the region surrounding the 5S array illustrated the lack of 45S and 5S mapped reads (fig. 8a). In conclusion Hi-C contact maps revealed no evidence for spatially close interaction between 5S rDNA and 45S rDNA arrays.
Identification of rDNA-Gene Contacts
In order to further investigate the identity of regions along the genome that are spatially close to the 5S and 45S rDNA arrays, we annotated reads with one end mapped to rDNA arrays and the other end mapped in the interval between the first and last exons of each gene in the human genome. We observed 2,533 genes with evidence of contact with the 5S rDNA arrays (>10, 5S rDNA-gene reads), and 10,477 genes with evidence of contact with the 45S rDNA arrays (>100, 45S rDNA-gene reads). These sets contain a diverse group of genes represented in all chromosomes. Interestingly, both 5S-gene and 45S-gene contacts show strong enrichments in genes that undergo alternative splicing (5S, P = 5.9E−152; 45S, P < 3.2E−200; Benjamini corrected P-values). Finally, we find that genes with contact with the rDNA arrays have lower GC% content than the genome average, with a significant negative association between the overall GC-content of a gene and the number of rDNA contacts assigned to it (ρ = −0.23, P < 2.2E−16).
Discussion
The 45S rDNA gives origin to the nucleolus, the nuclear organelle that is the site of ribosome assembly, and transcription and processing of 45S rRNA transcripts to mature rRNAs (Warner 1999; Grummt 2003; Moss et al. 2007; Pederson 2011; Woolford and Baserga 2013; Henras et al. 2015). The 5S rDNA resides on a single human chromosome, is required for ribosome function, and is transcribed outside of the nucleolus (Sorensen and Frederiksen 1991). Here we examined the genomic architecture and repeat content of the 5S array in multiple human genome assemblies and ascertained contacts between both rDNA arrays (5S and 45S) and the rest of the genome in two human cell lines (erythroleukemia K562 and lymphoblastoid cells). The analyses revealed that 5S and 45S arrays each have thousands of contacts in the folded genome. The analysis also identified an intriguing organization in the 5S array with Alu elements and 5S units adjacent to one another, and organized in opposite orientation along the array. The rDNA contact map displayed conserved and disparate features between two cell types, and pointed to specific chromosomes, genomic regions, and genes with evidence of spatial proximity to the rDNA arrays. The contacts include cell-type specific associations with non-repetitive elements of all human chromosomes. Interestingly, rDNA-associated genes were dispersed across all chromosomes. Moreover, the data showed a lack of direct physical interaction between non-repetitive elements of the 5S and 45S rDNA arrays in K562 and LCLs. This observation suggests that the correlation in copy number between the 5S and 45S array, which has been reported for LCLs (Gibbons et al. 2015), might not require direct physical contact between these two arrays. Finally, 5S and 45S contacts with a wide range of chromosome regions and genes are consistent with the global regulatory consequence of rDNA copy number (Gibbons et al. 2014).
The substructure of the nucleolus has been carefully described in classical ultra-structural studies (Bouteille et al. 1967; Goessens 1984; Fischer et al. 1991; Scheer et al. 1993), and 45S rDNA units are presumed to form chromosomal loops within the organelle (Raška et al. 2006). Hence, the observation that >30% of reads containing rDNA sequences had both ends mapping to the 45S arrays is expected. It could reflect rDNA arrays looping in active arrays or be due to a tight packing of array units adopting a silenced state. This is because rDNA array looping has been suggested as a mechanism facilitating coordinate transcription among repeat units of the rDNA array (Henderson et al. 1973; Wicke et al. 2011). On the other hand, tight packaging of the rDNA array in silenced heterochromatic states is to be expected because not all 10 alleles are presumed to be active at the same time. Both looping to facilitate coordinated transcription as well as tight packaging for silencing could also operate among 45S rDNA arrays on different human chromosomes. Because of the widespread distribution of Alu and other repeats (Batzer and Deininger 2002; Jurka 2004), masking these elements is necessary to remove potential sources of read ambiguity that could confound analyses of Hi-C data. In this regard, analyses with masked repeats indicate a lack of 5S–45S rDNA contacts. However, the procedure excluded the possibility that the 5S and 45S arrays might be connected through Alu elements. Hence, we also studied 5S–45S rDNA contacts without masking for repeats. The procedure identified only a limited number of hits suggesting a minor contribution of 5S–45S contacts even when Alu and other repeats are not masked. Our simulation study was carried out to evaluate this bias and showed that the number of observed contacts between 5S and 45S rDNA is not higher than the number expected from random selected regions with the same length. Finally, when we considered read pairs for which only one end mapped to the 45S rDNA, we found that in >70% of the cases the other end cannot be mapped to libraries of human DNA repeats that include Alu and Line1 repeats.
Recent observations of concerted rDNA copy number variation between the 5S and 45S rDNA arrays raise the possibility of cellular processes that promote co-variation in the 5S and 45S arrays. One clue might come from the co-localization of 5S and 45S array subunits in the genome of some fungi and plant species. It suggests that their co-existence in shared 5S–45S arrays could have benefits. In yeast, the 5S and 45S units are physically linked in a common array in chromosome XII (Petes 1979; Ganley and Kobayashi 2007). This feature is puzzling in view of 5S and 45S transcription from different RNA polymerases; it has been suggested that functional demands contributed to maintain their association. Similarly, in some plant lineages, the conserved linkage of two rDNA clusters (5S and 35S) is thought to be evolutionary ancient (Wicke et al. 2011; Barros et al. 2012; Galián et al. 2012). For instance, in some species of moss (bryophytes) the 5S gene resides in the 26S–18S spacers (Sone et al. 1999; Wicke et al. 2011; Liu et al. 2013). These are called L-type rDNA arrays. Observations in gymnosperms (ginkgo and conifers) and angiosperms (flowering plants) suggested that the L-type might have evolved independently at least three times (Garcia et al. 2010; Garcia and Kovařík 2013). On the other hand, S-type arrays in which the 5S and 35S elements are located in different chromosomes have also evolved independently in multiple plant lineages (Wicke et al. 2011; Garcia and Kovařík 2013). More detailed phylogenetic sampling in plants is necessary to ascertain the multiple evolutionary transitions to and from L-type arrays that appear to be frequent in plants (Garcia et al. 2014). Although pseudogenized copies of the 5S rDNA unit exist in animals (Borsuk et al. 1988; Sorensen and Frederiksen 1991; Matsuda et al. 1994; Martins et al. 2002; Kapitonov and Jurka 2003; Kalendar et al. 2008) tight physical clustering between functional 5S and 45S elements have not evolved in animals. In humans, the 1q42 rDNA cluster appears to be the only source of mature 5S rRNA species assembled into the ribosome (Barciszewska et al. 2001; Ciganda and Williams 2011). Hence, evolutionary evidence of linear co-localization of rDNA clusters in plants and yeast need to be reconciled with data from other eukaryotes.
Studies in plant groups with L and S types of rDNA arrays have yet to find evidence that natural selection favors either case (Garcia and Kovařík 2013). Notwithstanding this, costs and benefits to linked and separated rDNA arrays can be readily envisioned. Evolutionary integration of all rDNA components into a common array suggests that benefits of linked 5S–45S might sometimes override potential costs. One plausible advantage of linked 5S–45S structures might be to facilitate mechanisms maintaining balance in rRNAs, either through coordinated expression of rRNA units or through co-variation in the abundance of rDNA copies. On the other hand, separation of the arrays might diminish costs from transcription interference due to the high activity of distinct RNA polymerases operating within the same array. For instance, separated 5S and 45S clusters could facilitate the partition of the intracellular environment that are best suited for expression from RNA polymerase I (45S rDNA) or RNA polymerase III (5S rDNA) and diminish resource competition from these two transcriptionally demanding arrays.
In the case of separated 5S and 45S arrays of humans, Drosophila and other eukaryotes, the evolution of cellular functions that promote regulatory and copy number coordination might be expected. In this regard, rDNA centered nuclear organization raises the prospect that spatial co-localization might contribute to resolving tradeoffs of having separated 5S and 45S rDNA arrays with correlated copy number variation and balanced expression of rRNAs. Collectively, the data highlight rDNA array interactions with the rest of the genome and point to cell-line specific rDNA associations with non-repetitive elements of human chromosomes. Portraits of genome folding centered on the ribosomal DNA can help understand the emergence of concerted variation, the control of 5S and 45S expression, as well as provide insights into an organelle that contributes to the spatial localization of human chromosomes during interphase.
Supplementary Material
Supplementary tables S1–S3 and figures S1–S3 are available at Genome Biology and Evolution online (http://www.gbe.oxfordjournals.org/).
Acknowledgments
We thank two reviewers for insightful comments and members of the Lemos lab for helpful discussions during development of this work. The computations in this paper were run on the Odyssey cluster supported by the FAS Division of Science at Harvard University. Work supported through Harvard Chan School start-up funding to BL.
Literature Cited
- Barciszewska MZ, Szymanski M, Erdmann VA, Barciszewski J. 2001. Structure and functions of 5S rRNA. Acta Biochim Pol. 48(1):191–198. [PubMed] [Google Scholar]
- Barros ESA, Dos Santos SFW, Guerra M. 2012. Linked 5S and 45S rDNA sites are highly conserved through the subfamily Aurantioideae (Rutaceae). Cytogenet Genome Res. 140(1):62–69. [DOI] [PubMed] [Google Scholar]
- Batzer MA, Deininger PL. 2002. Alu repeats and human genomic diversity. Nat Rev Genet. 3(5):370–379. [DOI] [PubMed] [Google Scholar]
- Berlin K, et al. 2015. Assembling large genomes with single-molecule sequencing and locality-sensitive hashing. Nat Biotechnol. 33:623–630. [DOI] [PubMed] [Google Scholar]
- Borsuk P, Gniadkowski M, Bartnik E, Stepien PP. 1988. Unusual evolutionary conservation of 5S rRNA pseudogenes in Aspergillus nidulans: similarity of the DNA sequence associated with the pseudogenes with the mouse immunoglobulin switch region. J Mol Evol. 28(1–2):125–130. [DOI] [PubMed] [Google Scholar]
- Bouteille M, Kalifat SR, Delarue J. 1967. Ultrastructural variations of nuclear bodies in human diseases. J Ultrastruct Res. 19(5):474–486. [DOI] [PubMed] [Google Scholar]
- Caburet S, et al. 2005. Human ribosomal RNA gene arrays display a broad range of palindromic structures. Genome Res. 15(8):1079–1085. [DOI] [PMC free article] [PubMed] [Google Scholar]
- Ciganda M, Williams N. 2011. Eukaryotic 5S rRNA biogenesis. Wiley Interdiscipl Rev RNA 2(4):523–533. [DOI] [PMC free article] [PubMed] [Google Scholar]
- Dekker J, Rippe K, Dekker M, Kleckner N. 2002. Capturing chromosome conformation. Science 295(5558):1306–1311. [DOI] [PubMed] [Google Scholar]
- Doolittle WF. 1999. Phylogenetic classification and the universal tree. Science 284(5423):2124–2129. [DOI] [PubMed] [Google Scholar]
- Fedoriw AM, Starmer J, Yee D, Magnuson T. 2012. Nucleolar association and transcriptional inhibition through 5S rDNA in mammals. PLoS Genet. 8(1):e1002468.. [DOI] [PMC free article] [PubMed] [Google Scholar]
- Fischer D, Weisenberger D, Scheer U. 1991. Assigning functions to nucleolar structures. Chromosoma 101(3):133–140. [DOI] [PubMed] [Google Scholar]
- Galián J, Rosato M, Rosselló J. 2012. Early evolutionary colocalization of the nuclear ribosomal 5S and 45S gene families in seed plants: evidence from the living fossil gymnosperm Ginkgo biloba. Heredity 108(6):640–646. [DOI] [PMC free article] [PubMed] [Google Scholar]
- Ganley AR, Kobayashi T. 2007. Highly efficient concerted evolution in the ribosomal DNA repeats: total rDNA repeat variation revealed by whole-genome shotgun sequence data. Genome Res. 17(2):184–191. [DOI] [PMC free article] [PubMed] [Google Scholar]
- Garcia S, Galvez F, Gras A, Kovarik A, Garnatje T. 2014. Plant rDNA database: update and new features. Database (Oxford) 2014:bau063. [DOI] [PMC free article] [PubMed] [Google Scholar]
- Garcia S, Kovařík A. 2013. Dancing together and separate again: gymnosperms exhibit frequent changes of fundamental 5S and 35S rRNA gene (rDNA) organisation. Heredity 111(1):23–33. [DOI] [PMC free article] [PubMed] [Google Scholar]
- Garcia S, Panero JL, Siroky J, Kovarik A. 2010. Repeated reunions and splits feature the highly dynamic evolution of 5S and 35S ribosomal RNA genes (rDNA) in the Asteraceae family. BMC Plant Biol. 10:176.. [DOI] [PMC free article] [PubMed] [Google Scholar]
- Gibbons JG, Branco AT, Godinho SA, Yu S, Lemos B. 2015. Concerted copy number variation balances ribosomal DNA dosage in human and mouse genomes. Proc Natl Acad Sci U S A. 112:2485–2490. [DOI] [PMC free article] [PubMed] [Google Scholar]
- Gibbons JG, Branco AT, Yu S, Lemos B. 2014. Ribosomal DNA copy number is coupled with gene expression variation and mitochondrial abundance in humans. Nat Commun. 5:4850. [DOI] [PubMed] [Google Scholar]
- Goessens G. 1984. Nucleolar structure. Int Rev Cytol. 87:107–158. [DOI] [PubMed] [Google Scholar]
- Gonzalez IL, Sylvester JE. 1995. Complete sequence of the 43-kb human ribosomal DNA repeat: analysis of the intergenic spacer. Genomics 27(2):320–328. [DOI] [PubMed] [Google Scholar]
- Grummt I. 2003. Life on a planet of its own: regulation of RNA polymerase I transcription in the nucleolus. Genes Dev. 17(14):1691–1702. [DOI] [PubMed] [Google Scholar]
- Henderson A, Warburton D, Atwood K. 1972. Location of ribosomal DNA in the human chromosome complement. Proc Natl Acad Sci U S A. 69(11):3394–3398. [DOI] [PMC free article] [PubMed] [Google Scholar]
- Henderson A, Warburton D, Atwood K. 1973. Ribosomal DNA connectives between human acrocentric chromosomes. Nature 245(5420):95–97. [DOI] [PubMed] [Google Scholar]
- Henras AK, Plisson-Chastang C, O'Donohue MF, Chakraborty A, Gleizes PE. 2015. An overview of pre-ribosomal RNA processing in eukaryotes. Wiley Interdiscip Rev RNA 6(2):225–242. [DOI] [PMC free article] [PubMed] [Google Scholar]
- Huang DW, et al. 2007. DAVID Bioinformatics Resources: expanded annotation database and novel algorithms to better extract biology from large gene lists. Nucleic Acids Res. 35(suppl 2):W169–W175. [DOI] [PMC free article] [PubMed] [Google Scholar]
- Jurka J. 2004. Evolutionary impact of human Alu repetitive elements. Curr Opin Genet Dev. 14(6):603–608. [DOI] [PubMed] [Google Scholar]
- Kalendar R, et al. 2008. Cassandra retrotransposons carry independently transcribed 5S RNA. Proc Natl Acad Sci U S A. 105(15):5833–5838. [DOI] [PMC free article] [PubMed] [Google Scholar]
- Kapitonov VV, Jurka J. 2003. A novel class of SINE elements derived from 5S rRNA. Mol Biol Evol. 20(5):694–702. [DOI] [PubMed] [Google Scholar]
- Lane DJ, et al. 1985. Rapid determination of 16S ribosomal RNA sequences for phylogenetic analyses. Proc Natl Acad Sci U S A. 82(20):6955–6959. [DOI] [PMC free article] [PubMed] [Google Scholar]
- Langmead B, Salzberg SL. 2012. Fast gapped-read alignment with Bowtie 2. Nat Methods 9(4):357–359. [DOI] [PMC free article] [PubMed] [Google Scholar]
- Li H, et al. 2009. The sequence alignment/map format and SAMtools. Bioinformatics 25(16):2078–2079. [DOI] [PMC free article] [PubMed] [Google Scholar]
- Lieberman-Aiden E, et al. 2009. Comprehensive mapping of long-range interactions reveals folding principles of the human genome. Science 326(5950):289–293. [DOI] [PMC free article] [PubMed] [Google Scholar]
- Liu Y, Forrest LL, Bainard JD, Budke JM, Goffinet B. 2013. Organellar genome, nuclear ribosomal DNA repeat unit, and microsatellites isolated from a small-scale of 454 GS FLX sequencing on two mosses. Mol Phylogenet Evol. 66(3):1089–1094. [DOI] [PubMed] [Google Scholar]
- Mallatt J, Winchell CJ. 2002. Testing the new animal phylogeny: first use of combined large-subunit and small-subunit rRNA gene sequences to classify the protostomes. Mol Biol Evol. 19(3):289–301. [DOI] [PubMed] [Google Scholar]
- Martins C, et al. 2002. Dynamics of 5S rDNA in the tilapia (Oreochromis niloticus) genome: repeat units, inverted sequences, pseudogenes and chromosome loci. Cytogenet Genome Res. 98(1):78–85. [DOI] [PubMed] [Google Scholar]
- Matsuda Y, et al. 1994. Chromosomal mapping of mouse 5S rRNA genes by direct R-banding fluorescence in situ hybridization. Cytogenet Cell Genet. 66(4):246–249. [DOI] [PubMed] [Google Scholar]
- Moss T, Langlois F, Gagnon-Kugler T, Stefanovsky V. 2007. A housekeeper with power of attorney: the rRNA genes in ribosome biogenesis. Cell Mol Life Sci. 64(1):29–49. [DOI] [PMC free article] [PubMed] [Google Scholar]
- Nemeth A, et al. 2010. Initial genomics of the human nucleolus. PLoS Genet. 6(3):e1000889.. [DOI] [PMC free article] [PubMed] [Google Scholar]
- Noé L, Kucherov G. 2005. YASS: enhancing the sensitivity of DNA similarity search. Nucleic Acids Res. 33(suppl 2): W540–W543. [DOI] [PMC free article] [PubMed] [Google Scholar]
- Padeken J, Heun P. 2014. Nucleolus and nuclear periphery: velcro for heterochromatin. Curr Opin Cell Biol. 28:54–60. [DOI] [PubMed] [Google Scholar]
- Pederson T. 2011. The nucleolus. Cold Spring Harb Perspect Biol. 3(3): a000638. [DOI] [PMC free article] [PubMed] [Google Scholar]
- Petes TD. 1979. Yeast ribosomal DNA genes are located on chromosome XII. Proc Natl Acad Sci U S A. 76(1):410–414. [DOI] [PMC free article] [PubMed] [Google Scholar]
- Quinlan AR, Hall IM. 2010. BEDTools: a flexible suite of utilities for comparing genomic features. Bioinformatics 26(6):841–842. [DOI] [PMC free article] [PubMed] [Google Scholar]
- Rao SS, et al. 2014. A 3D map of the human genome at kilobase resolution reveals principles of chromatin looping. Cell 159(7):1665–1680. [DOI] [PMC free article] [PubMed] [Google Scholar]
- Raška I, Shaw PJ, Cmarko D. 2006. New insights into nucleolar architecture and activity. Int Rev Cytol. 255:177–235. [DOI] [PubMed] [Google Scholar]
- Scheer U, Thiry M, Goessens G. 1993. Structure, function and assembly of the nucleolus. Trends Cell Biol. 3(7):236–241. [DOI] [PubMed] [Google Scholar]
- Sone T, et al. 1999. Bryophyte 5S was inserted into 45S rDNA repeat units after the divergence from higher land plants. Plant Mol Biol. 41:679–685. [DOI] [PubMed] [Google Scholar]
- Sorensen PD, Frederiksen S. 1991. Characterization of human 5S rRNA genes. Nucleic Acids Res. 19(15):4147–4151. [DOI] [PMC free article] [PubMed] [Google Scholar]
- Steinberg KM, et al. 2014. Single haplotype assembly of the human genome from a hydatidiform mole. Genome Res. 24(12):2066–2076. [DOI] [PMC free article] [PubMed] [Google Scholar]
- Stults DM, Killen MW, Pierce HH, Pierce AJ. 2008. Genomic architecture and inheritance of human ribosomal RNA gene clusters. Genome Res. 18(1):13–18. [DOI] [PMC free article] [PubMed] [Google Scholar]
- Thompson M, Haeusler RA, Good PD, Engelke DR. 2003. Nucleolar clustering of dispersed tRNA genes. Science 302(5649):1399–1401. [DOI] [PMC free article] [PubMed] [Google Scholar]
- Turner S, Pryer KM, Miao VP, Palmer JD. 1999. Investigating deep phylogenetic relationships among cyanobacteria and plastids by small subunit rRNA sequence analysis. J Eukaryot Microbiol. 46(4):327–338. [DOI] [PubMed] [Google Scholar]
- van Berkum NL, et al. 2010. Hi-C: a method to study the three-dimensional architecture of genomes. J Vis Exp. (39):1869. [DOI] [PMC free article] [PubMed] [Google Scholar]
- Warner JR. 1999. The economics of ribosome biosynthesis in yeast. Trends Biochem Sci. 24(11):437–440. [DOI] [PubMed] [Google Scholar]
- Wicke S, Costa A, Muñoz J, Quandt D. 2011. Restless 5S: The re-arrangement (s) and evolution of the nuclear ribosomal DNA in land plants. Mol Phylogenet Evol. 61(2):321–332. [DOI] [PubMed] [Google Scholar]
- Woolford JL, Jr., Baserga SJ. 2013. Ribosome biogenesis in the yeast Saccharomyces cerevisiae. Genetics 195(3):643–681. [DOI] [PMC free article] [PubMed] [Google Scholar]
- Zentner GE, Saiakhova A, Manaenkov P, Adams MD, Scacheri PC. 2011. Integrative genomic analysis of human ribosomal DNA. Nucleic Acids Res. 39:4949–4960. [DOI] [PMC free article] [PubMed] [Google Scholar]
Associated Data
This section collects any data citations, data availability statements, or supplementary materials included in this article.


