Abstract
Rigidity of substrates plays an important role in stem cell fate. Studies were commonly carried out on isotropically stiff substrate or substrates with unidirectional stiffness gradients. However, many native tissues are anisotropically stiff and it is unknown whether controlled presentation of stiff and compliant material axes on the same substrate governs cytoskeletal and nuclear morphology, as well as stem cell differentiation. In this study, electrocompacted collagen sheets were stretched to varying degrees to tune the stiffness anisotropy (SA) in the range of 1 to 8, resulting in stiff and compliant material axes orthogonal to each other. The cytoskeletal aspect ratio increased with increasing SA by about 4-fold. Such elongation was absent on cellulose acetate replicas of aligned collagen surfaces indicating that the elongation was not driven by surface topography. Mesenchymal stem cells (MSCs) seeded on varying anisotropy sheets displayed a dose-dependent upregulation of tendon-related markers such as Mohawk and Scleraxis. After 21 days of culture, highly anisotropic sheets induced greater levels of production of type-I, type-III collagen and thrombospondin-4. Therefore, SA has direct effects on MSC differentiation. These findings may also have ramifications of stem cell fate on other anisotropically stiff tissues, such as skeletal/cardiac muscles, ligaments and bone.
Keywords: Substrate stiffness anisotropy, cellular alignment, MSC differentiation, Collagen sheet stretch
1. Introduction
A number of natural tissues such as tendons, blood vessels and muscles are substantially stiffer along their load bearing direction than other tissue axes. Notably, the cytoskeletons and nuclei of cells in such tissues are generally elongated along the stiffer direction. In such a fundamental context, the effects of extracellular matrix (ECM) stiffness anisotropy (SA) on cellular morphology and response have not been investigated. Prior research has demonstrated the effects of extracellular matrix rigidity on morphology, proliferation and differentiation of mesenchymal stem cells (MSCs)[1–7]. Such studies were commonly carried out on environments with isotropic stiffness. Depending on matrix rigidity, MSCs may undergo neurogenesis, myogenesis or osteogenesis[1]. Matrix rigidity has also shown to affect the degree to which a cell spreads[8–10]. It has also been shown that cell migration can be controlled by stiffness gradients in a process termed as durotaxis[11].
Alignment and elongation of the cytoskeleton have been achieved predominantly by topographical cues such as micropatterned ridges, micropillars, gratings, wells or microimprinted cell-adhesive patterns[2–7, 12–14]. There is evidence that cells seeded on nanofibrous topographies align along the longer axes of fibers[15–17]. This outcome is mainly due to the defined topography of the substrates. It was demonstrated that topography induced cytoskeletal alignment differentiated MSCs to tenogenic and neuronal differentiation[18, 19]. It is yet unknown whether controlled presentation of substrate SA governs cytoskeletal and nuclear morphology, as well as stem cell fate.
Type I collagen is the most abundant and major structural protein in connective tissues[20, 21]. Therefore, it is the center of many tissue engineering strategies for anisotropic tissues such as tendon, ligament, etc. To the best of our knowledge there is no study which introduces SA directly to the pure collagen substrate by incorporating different stiffness values in different material directions and studies the effect on cytoskeletal response and differentiation toward anisotropic tissue lineage. Our research group demonstrated transformation of monomeric collagen solutions to solid phase by electrochemical gradients induced by linear electrodes[22–24]. The method generates highly dense and aligned collagen threads with a packing density (1030 mg/ml) one of the highest reported to date[25, 26]. The molecular alignment lacks when planar electrodes are used to fabricate sheets. In the current study, SA was introduced in electrocompacted sheets by controlled unidirectional stretch of the sheets to various levels. Variations in the cytoskeletal and nuclear morphology of cells seeded on collagen sheets of varying SA were studied. Effects of collagen SA on the expression of tendon-related transcription factors and tendon-related extracellular matrix synthesis were also investigated.
2. Results
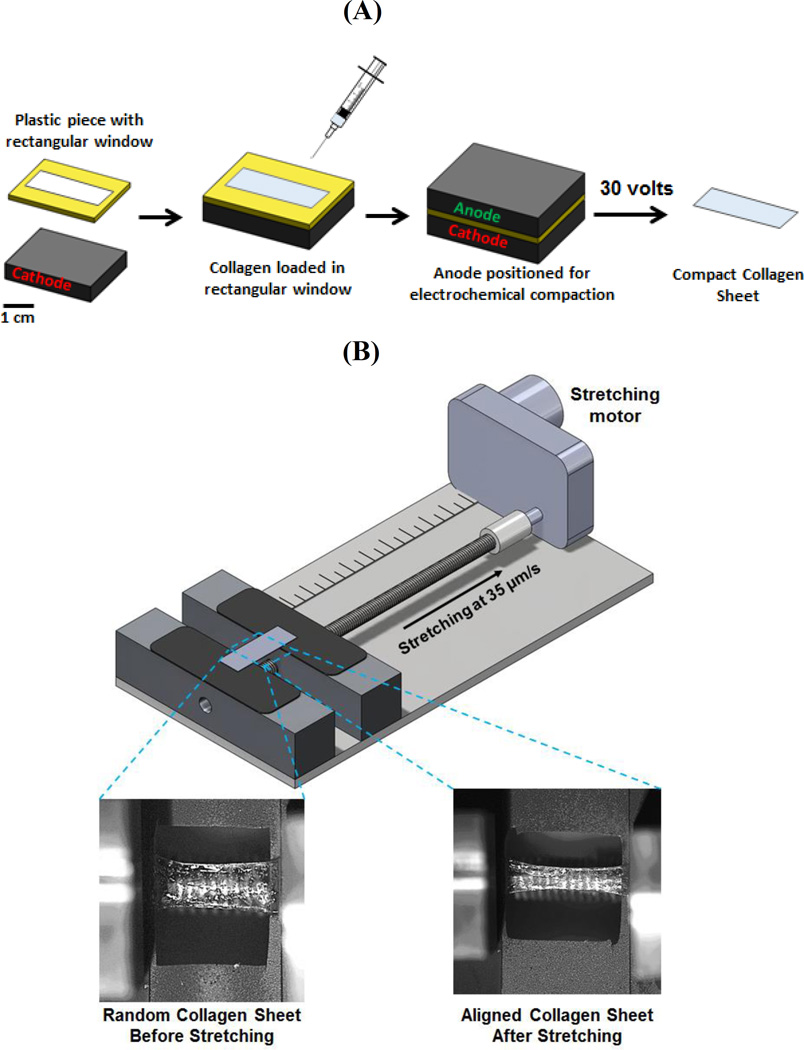
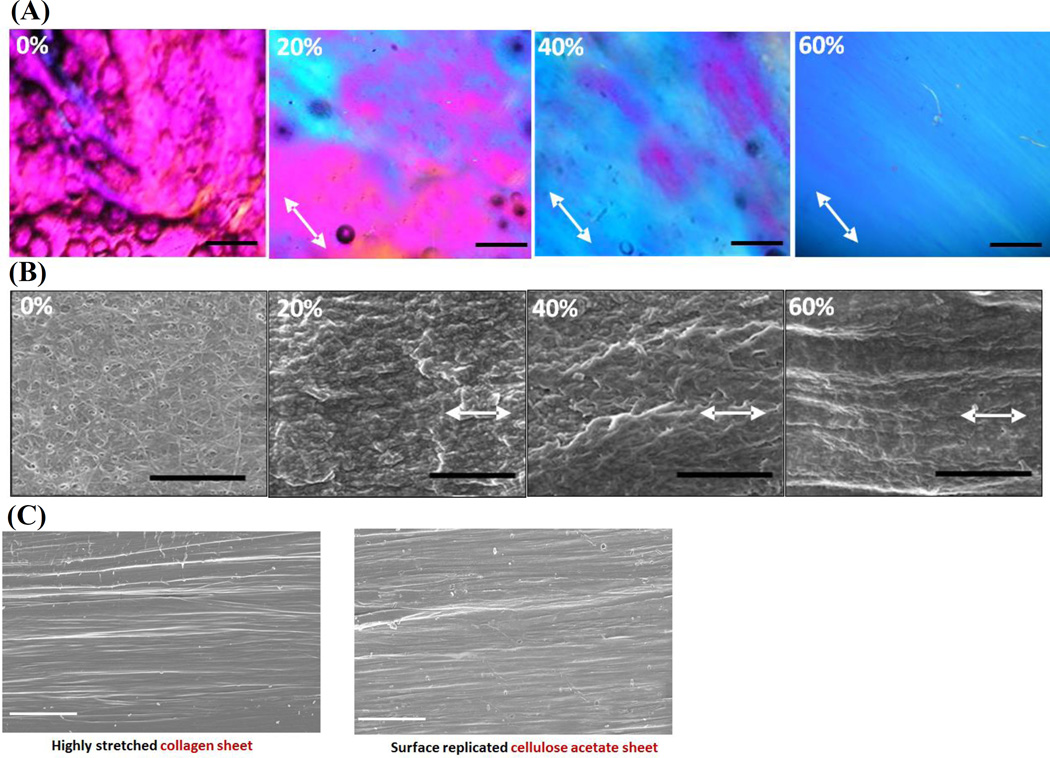
Electrochemically compact collagen sheets were fabricated by using planar electrodes (Figure 1A) and stretched by a mechanical stretching device to incorporate SA in isotropic collagen sheets (Figure 1B) (see Methods). Collagen molecules are randomly (i.e. isotropically) oriented in compact sheets as evidenced by CPI (Compensated Polarized Imaging) image (magenta indicates randomness[22, 27, 28] in Figure 2A, 0% stretch). Molecular alignment increased gradually with stretch as indicated by the emergence of blue color in the polarized images (Figure 2A). 0% stretch group was isotropic and 60% stretched group had the highest alignment as indicated by the uniform blue color over the aligned compact sheet. CPI results were backed up by the SEM (scanning electron microscopy) images (Figure 2B) which revealed collagen fibrils of 0% stretch group were randomly oriented. A gradual increase (Figure 2B) in fibrillary alignment was observed along the stretching direction. SEM images indicated a full replication of the aligned collagen surface topography by the cellulose acetate (Figure 2C).
Figure 1.
A) Overview of electrochemical compaction of collagen sheets, B) Overview of molecular alignment by stretching.
Figure 2.
A) CPI images of collagen sheets at different levels of stretch. The arrow indicates the slow axis of the gypsum plate and molecular alignment along the direction of the slow axis is manifested by blue which emerges gradually with stretch. At 60% stretch, full alignment is present over the field of view. Scale bar 100 µm, B) SEM images of collagen sheets stretched to different strain levels indicate an aligned topography along the stretching direction (arrows; scale bar 2µm). C) Replication highly stretched (SA=8) collagen sheet surface to cellulose acetate film. Scale bar: 20µm
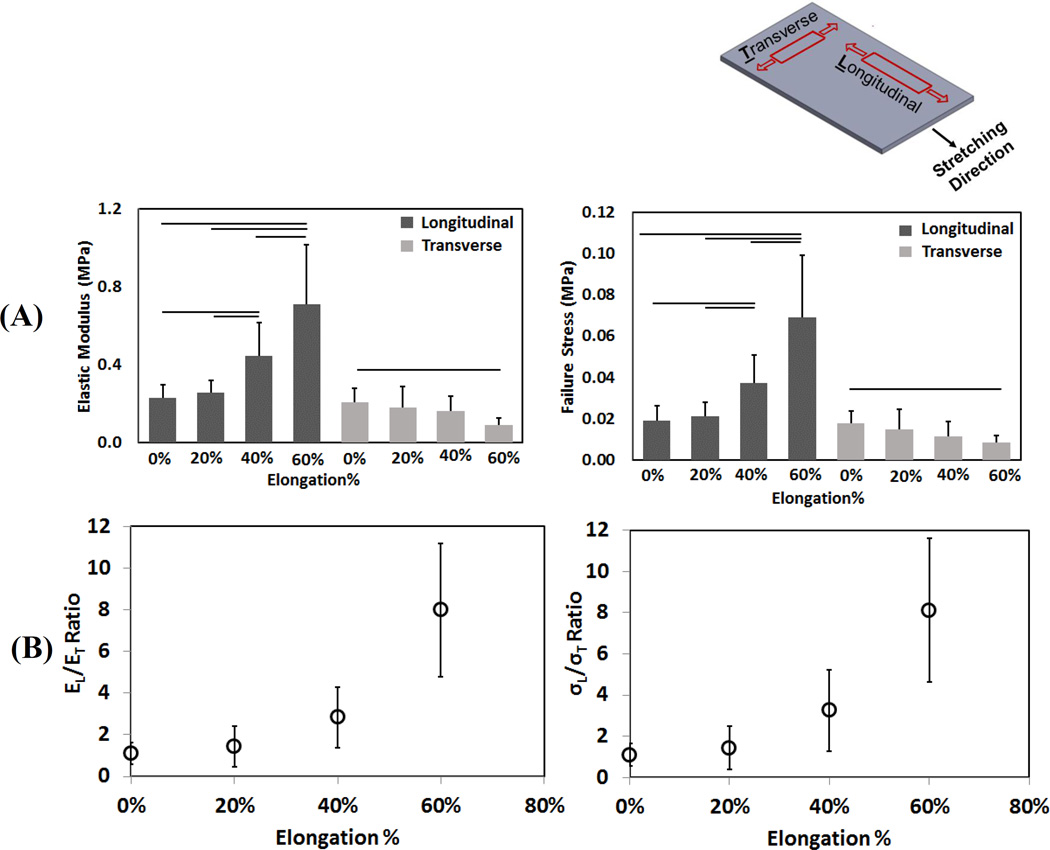
The electro compacted collagen sheets were tested mechanically both in longitudinal and transverse to the stretching direction. The mechanical test result of different SA collagen sheet indicated that longitudinal direction modulus (EL) and maximum failure stress (σL) increased about 4-fold when increased from 1 to 8 (Figure 3A). On the other hand, ET and σT declined by 2-fold from SA=1 group to SA=8 group (“T” indicates transverse direction property).
Figure 3.
Top right figure shows the mechanical testing direction of the longitudinal and transverse samples with the stretching direction. A) Transverse and longitudinal stiffness of collagen sheets at different stretch levels. B) Stiffness (left) and failure stress (right) anisotropy in collagen sheets increased with stretch. Horizontal lines indicate significant differences between groups (p < 0.05)
Electrocompacted random collagen sheet (0% stretch) was isotropically stiff and strong (SA=1.11 ± 0.51, STA=1.09 ± 0.55, respectively), in agreement with the random fibrillar orientation observed by CPI and SEM. SA and STA increased gradually by up to 8-fold with increasing stretching level (Figure 3B).
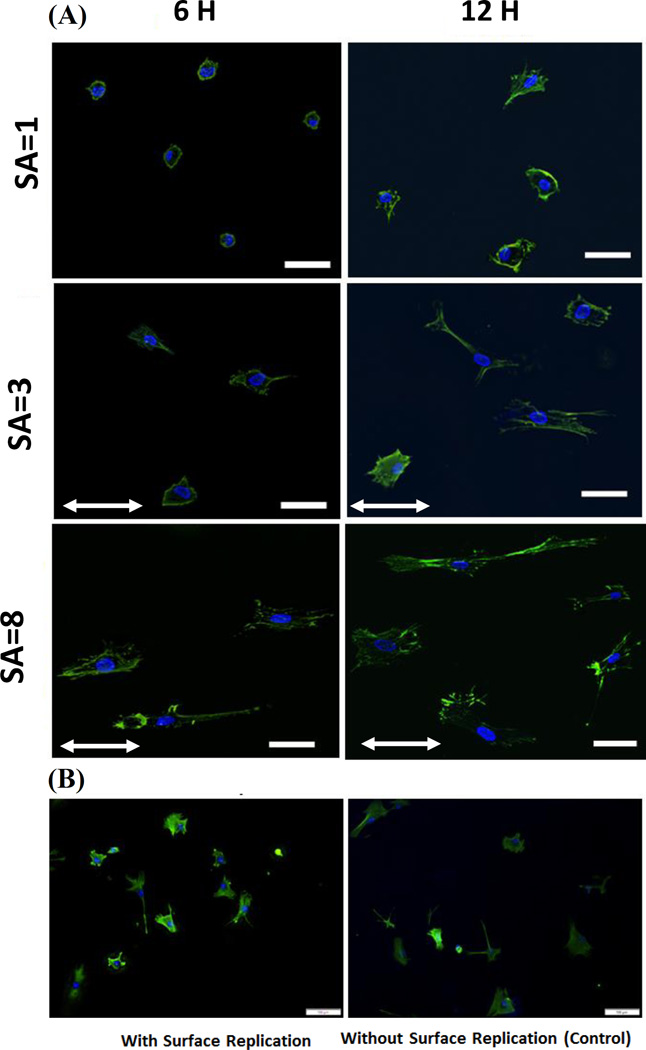
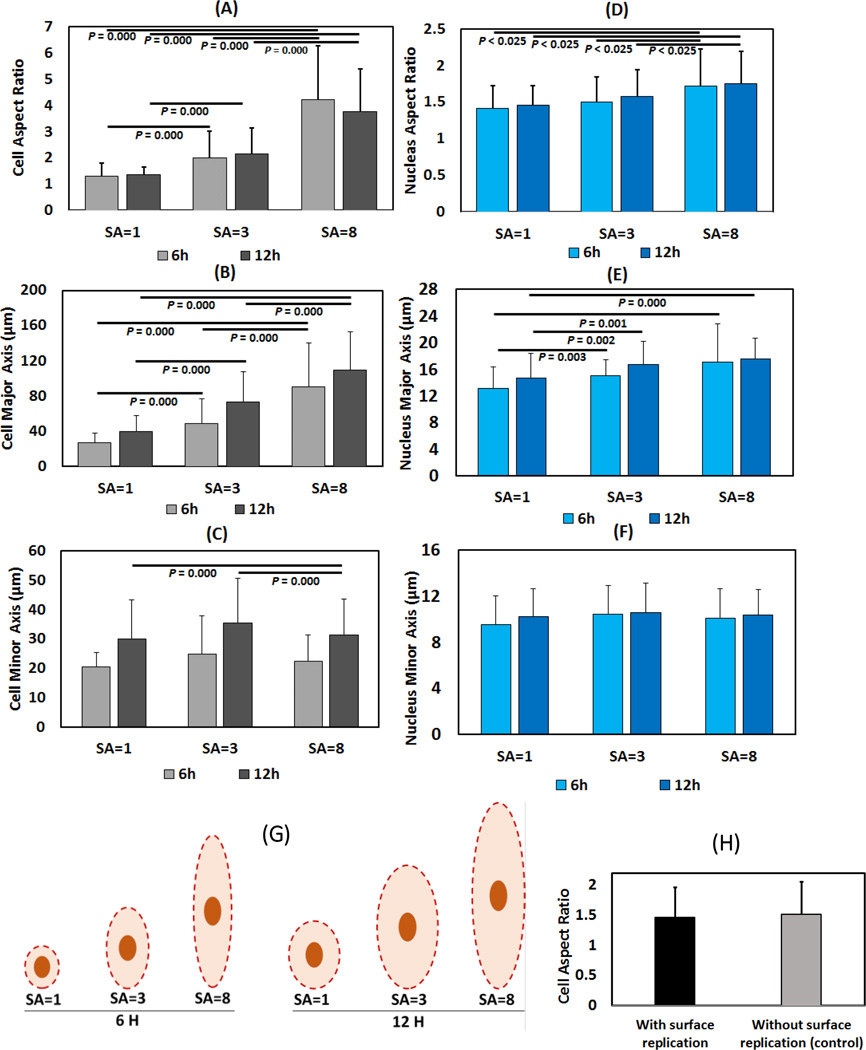
Human mesenchymal stem cells (hMSC) seeded on collagen sheets of varying SA showed a 4-fold increase in the cytoskeletal aspect ratio with increasing SA (Figure 4, 5A) both at 6 and 12 hours. This increase in aspect ratio was mainly due to continual increase in the length of major axis from 40 microns at SA=1 to 110 microns at SA=8 at 12-hour time point (Figure 4, 5B). On the other hand, cell minor axis length was stagnant at about 30 micrometers by 12-hour time point regardless of the SA (Figure 5C). Both major axis length (p =0.003) and minor axis length (p = 0.000) increased between 6 and 12 hours indicating continual spreading of cells over time (Figure 4, 5B, 5C). There was no significant difference of cell aspect ratio between cells seeded on surface replicated cellulose acetate sheet and control cellulose acetate sheet (Figure 4B & 5H). Cells on cellulose acetate with functionalized Collagen-I coating also did not show any significant difference like the uncoated cellulose acetate sample experiment.
Figure 4.
A) MSCs’ cystoskeletal morphology at SA=1, SA=3 and SA=8 (Scale bar 50 µm) after 6 and 12 hours of seeding. Stretching direction indicated by arrows. B) Morphology of cells seeded on cellulose acetate with and without surface replication shows similar morphology and alignment. (Scale bar: 100µm).
Figure 5.
Cell aspect ratio (A), major axis (B) and minor axis (C) length after 6 and 12 hours (Left column). Nuclear aspect ratio (D), major axis (E) and minor axis (F) length after 6 and 12 hours (Right column). Significance was set at p < 0.025 using Bonferroni correction. (G)The schema is drawn to scale from the reported average measurements to illustrate cell and nucleus dimensions at different values of anisotropy. (H) Cells seeded on surface replicated cellulose acetate sheet showed that there was no significant difference of cell aspect ratio surface replication and control group.
Nuclear aspect ratio (Figure 5D) increased moderately but significantly within increasing SA (p<0.025). In parallel with the changes observed for cytoskeletal dimensions, major axis length (Figure 5E) of nuclei increased with increasing SA whereas the minor axis (Figure 5F) did not change with increasing SA.
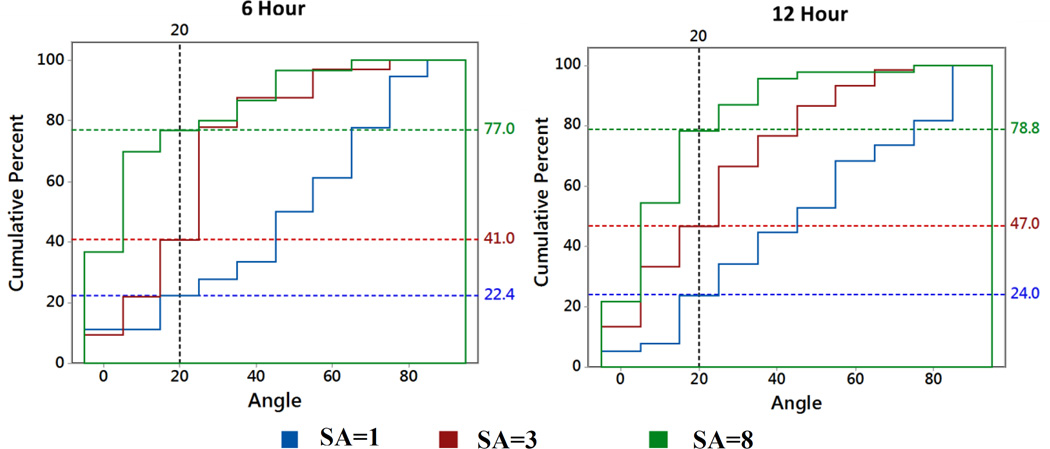
The cumulative histograms (Figure 6) indicated that a greater fraction of cells were aligned along the stretch axis with increasing amount of stretch. Such that, at 12 hours, 24%,47% and 78.8% aligned cells were within 20° angle of stretching direction for SA=1, SA=3 and SA=8 groups, respectively. For SA=1 group, after 6 hours, 65% of cells had r < 1.2 and after 12 hours 33.33% of cells had r < 1.2. Cells with aspect ratios of r < 1.2 were considered to be round and therefore, not included in the histogram.
Figure 6.
Cumulative Relative Histogram Plot of Cell Alignment Angle. After 6 hours, for SA=1, SA=3 and SA=8 group, 22.4%, 41.0% and 77.0% aligned cells are within 200 angle of the stretching direction respectively. After 12 hours, for SA=1, SA=3 and SA=8 group, 24.0%, 47.0% and 78.8.0% of aligned cells are within 200 angle of the stretching direction respectively. For SA=1 group, after 6 hours, 65% cell has r <1.2 and after 12 hours 33.33% of cells have r<1.2 are considered to be round and therefore, not included in the cell alignment angle histogram.
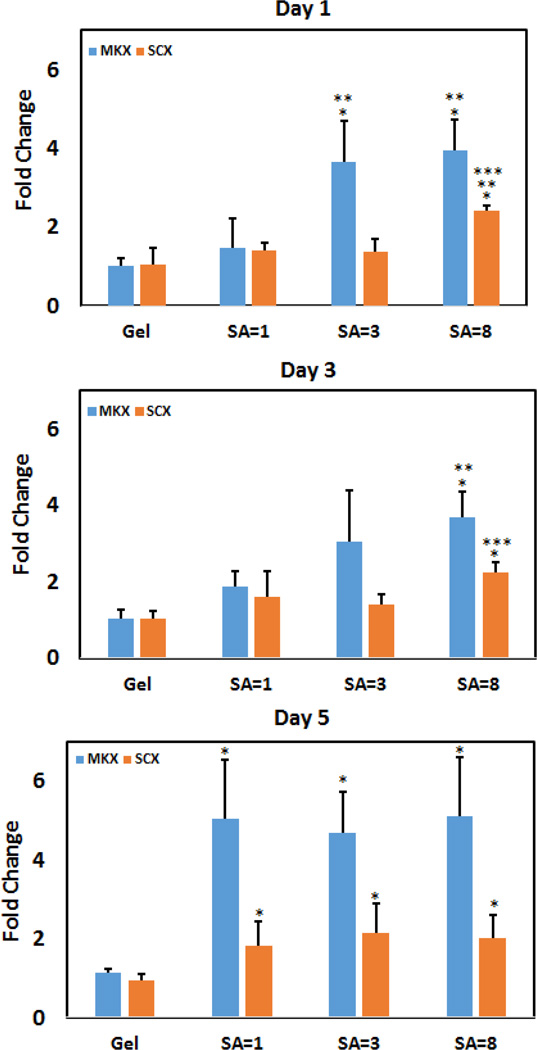
Gene expression results on days 1 and 3 (Figure 7) showed that increasing the stiffness by compaction while maintaining isotropy (gel vs. unstretched sheet) did not affect the expression levels of MKX and SCX. On day 1, induction of SA resulted in significant increases in the expressions of MKX and SCX. On day 3, expressions of MKX and SCX were greater only for the highest level of stretch. By day 5, expressions of all electrocompacted groups (stretched or not) were comparable, and, greater than those of the collagen gel.
Figure 7.
Effect of SA on tenogenic differentiation of human MSCs. After day 1, 3 and 5 SCX showed gradual increase of expression level. MKX showed increased expression for SA=3 and SA=8 group after day 1 and 3. Within the same marker and day, significance difference between gel and compact group is noted by “*” and between non anisotropic compact with other anisotropic group is denoted by “**” and SA=3 vs SA=8 is denoted by “***”.
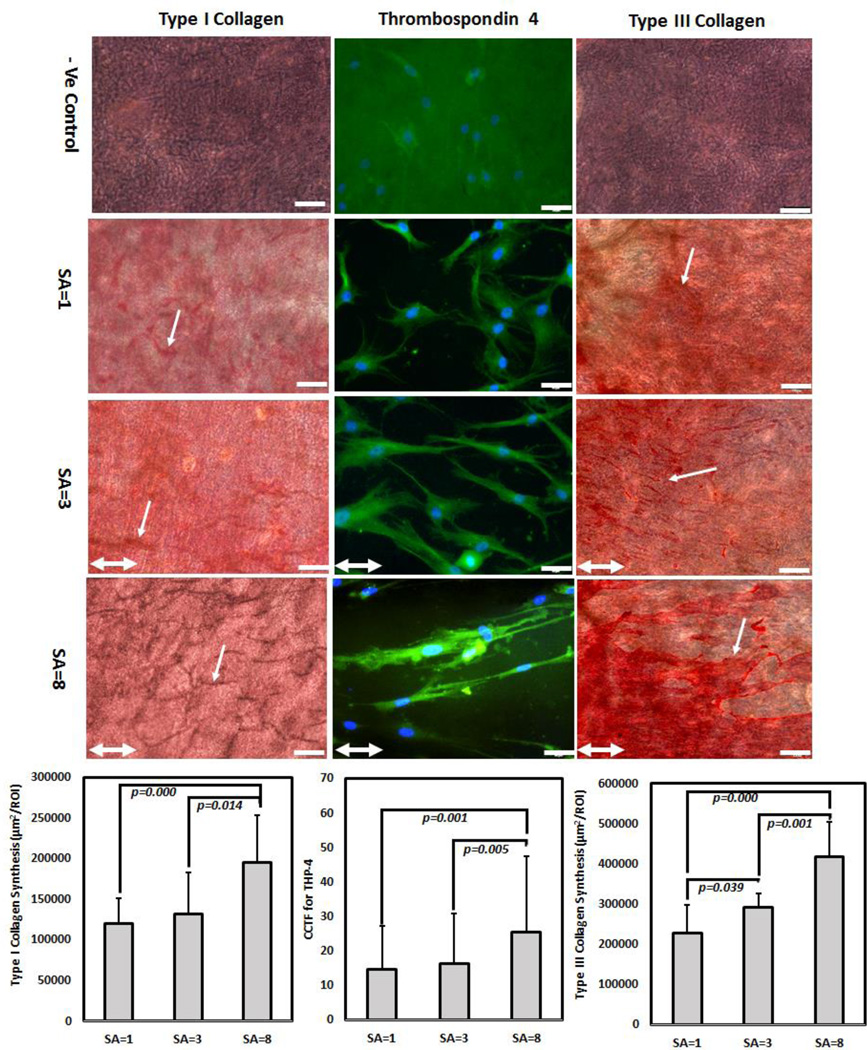
After 21 days of culture, type-I and type-III collagen production increased by 2-fold in highly anisotropic group (SA=8) than SA= 1 and SA=3 (Figure 8). For type-I collagen, there was no significant difference between SA=1 and SA=3. For type-III collagen, SA=3 samples showed significantly greater matrix synthesis than SA=1. In case of TSP-4, cells on SA=8 sheet showed 2.5- fold increase in TSP-4 expression than SA=1 indicated by corrected total cell fluorescence (CCTF) level (Figure 8). There was no significant difference in TSP-4 immunofluorescence level of cells between SA=1 and SA=3.
Figure 8.
Effect of SA on long term matrix synthesis. After day 21 days of hMSc culture, highly anisotropic (SA=8) showed 2-fold upregulation of type-I collagen synthesis than non-anisotropic sheet (SA=1); cells on SA=8 sheet showed 2- fold increase in TSP-4 production than SA=1 indicated by corrected total cell fluorescence (CCTF); and gradual increase in type-III collagen synthesis by 2-fold increase from SA=8 to SA=1 sheet; White arrow indicates collagen synthesis; for type-I and type-III collagen, scale bar 100 µm and for TSP-4 scale bar 50 µm. Double head white arrow indicate stretching direction
3. Discussion
The planar stretch induced SA in collagen sheet affected cellular and nuclear morphology. Furthermore, cell fate, specifically tenogenic differentiation of MSCs were inducible by substrate SA. The observed outcome was attributable to SA rather than aligned topography as demonstrated by the absence of cellular elongation on isotopically stiff cellulose acetate sheets which replicated the topography of aligned collagen sheets.
The increase in anisotropy was mostly due to an increase in the modulus along the stretch axis whereas the modulus transverse to the stretch axis varied less prominently (4-fold vs 2-fold) with the stretching. This outcome implies that the lateral interactions between collagen molecules define the stiffness in the transverse direction, regardless the molecules are oblique (as in the isotropic state) or fully parallel (as in the aligned state) to each other. Overall, molecular alignment predominantly benefits the modulus along the longer axes of molecules.
Preferential alignment towards the stiffer material axis as we report in this study is an agreement with the preferential migration of cells towards higher rigidity regions of materials with rigidity gradients[11]. Plotnikov et al. reported that individual focal adhesions (FAs) sense ECM locally by repeatedly applying tugging forces and that soft ECMs promote tugging traction dynamics in FAs whereas rigid ECMs promote stable traction in FAs[11]. Therefore, cells migrate towards the rigid ECM with stable traction of FAs by directed migration. In this study cells showed elongation along the stiff direction. This indicates that the FAs of cells were able to sense and differentiate between the stiff and softer directions of the anisotropic sheets and responded accordingly.
The response of nuclear aspect ratio to substrate anisotropy (22% increase) was significant but less pronounced than the response of cytoskeletal aspect ratio (201% increase). The change in nuclear morphology occurred largely by an increase in the major axis length of the nucleus while there was no change in the minor axis length of the nucleus. In highly anisotropic tendon tissue, cell aspect ratio varies from 3–8[29–31] whereas nucleus aspect ratio varies from 2.5–6[29, 32, 33]. The nucleus aspect ratio in isotropic tissue types (adipocyte, cornea) varies from 1.1–1.8[34–38]. Cells seeded on the highly anisotropic sheets in this study had a nucleus aspect ratio of 2, a ratio that is on the higher end of isotropic tissues and lower end of anisotropic tissues. Experiments with longer durations of cell-seeding on anisotropic sheets may show greater elongation of the nuclei which remains to be determined. Also, cells are investigated in 2D context whereas the 3D nature of native tissues may be promoting a greater degree of increase in the nuclear aspect ratio.
The nucleus had an increasing major axes length with increasing SA whereas the minor axes remained static. It is likely that this behavior is determined by preferential recruitment of actin fibers along the stiffer direction pulling on the nucleus along the major axis predominantly. Therefore, substrate anisotropy may be transmitted to the nucleus via mediation of actin filaments along the major axis. Future experiments targeting actin anchorage to the nuclei would prove this point conclusively.
For the isotropic (SA=1) group, 65% and 34% of cells were round after 6 and 12h. Whereas for medium (SA=3) and highly anisotropic (SA=8) sheet close to 100% cells were elongated. The average alignment direction gradually comes closer to the stretching direction as the anisotropy of the sheet increases. This indicates that cell sensed the stiffer direction of the anisotropic sheet and showed direct response by gradually increasing cell aspect ratio and by gradually extending along the stretching direction. In this context, arguably, SA is a form of durotaxis where the cell translates locally by expanding along the stiffer axis at a higher rate than the compliant axis to assume both an elongated form while aligning along the stiffer direction of the material.
It has been well established that biophysical cues such as substrate stiffness induce MSCs to commit to different lineages[1, 39]. Younesi et al. showed that anisotropic alignment of the electrocompacted collagen fibers yields tenogenic differentiation of MSCs as demonstrated by gene expression and matrix production[17]. Mature tendon tissues are highly anisotropic in nature and during tendon development in embryos, the environment where cells are undergoing tenogenesis are observed to be formed of highly anisotropic parallel bundle of collagen fibrils[40, 41]. The anisotropic collagen sheets in this study partially mimic the anisotropic nature of the tendon ECM by presenting parallel collagen molecular alignment. Therefore, it is likely that the substrate SA induced cellular elongation is a contributor to the upregulation of the tendon markers as reported in this study. Therefore, we propose anisotropy of the stiffness as one of the determinants of MSC fate.
Scleraxis is an early progenitor marker which regulates tendon formation[42–44]. It has been shown that scleraxis was expressed in day 14.5 embryonic mouse tendon[45]. Mechanical force and scleraxis incorporation in the hESCs induced hESCs commitment to tenocytes[46]. Tendons of scleraxis null mutant mice showed severe defects. All these studies suggest that expression of scleraxis is important in tendon development. Previous studies of MSCs seeded on highly anisotropic collagen fibers[17, 18] and knitted silk collagen scaffold[47] showed early increase in scleraxis expression and later the expression was decreased. Growth differentiation factor-5 (GDF-5)[48] treated MSCs seeded on culture plates are reported to induce early increase in scleraxis expression followed by a decrease. The current study similarly showed early increase in the scleraxis expression and interestingly, at day 1 and day 3 highly anisotropic sheet showed higher expression than gel, non-anisotropic and intermediate anisotropic groups (Figure 7). At day 5 scleraxis expression decreases and levels between groups (Figure 7). This early increase in the scleraxis expression in highly anisotropic sheet indicates that, the anisotropic nature of the collagen sheet promotes the genes involved in early phases tenogenic differentiation.
Mohawk is expressed in developing tendons of mouse embryo and Mohawk knockout mice showed hypoplastic tendons and down regulation of type I collagen[49–51]. These results indicate that Mohawk is another critical regulator for tendon differentiation. Liu et al. demonstrated that the transcription factor Mohawk upregulates scleraxis in murine MSCs. Otabe et al. demonstrated that Mohawk was upregulated by 1.8 fold when rat MSCs were seeded on a collagen scaffold to repair a tendon defect[52, 53]. MSCs[54] or tendon-derived cells[55] seeded on collagen gels exhibited 1.5- and 3-fold upregulation of Mohawk after 7 days and 2 days of culture period, respectively, without the use of any growth factor. The intermediate and highly anisotropic sheet in this study showed 4-fold upregulation of Mohawk expression at day 1 without the use of any growth factor. At day 3, the expression increases from 2- to 4-fold from isotropic to highly anisotropic sheet. At day 5, there is further increase in Mohawk expression. Overall, Mohawk displayed the most robust response to SA among the markers investigated in this study.
Long term tendon related matrix production study indicated that highly anisotropic samples favored tendon related matrix production. Type-I collagen is the main tendon collagen and type-III collagen is one of the major tendon-associated collagen which is crucial for type-I collagen fibrilogenesis[56, 57]. Studies demonstrated that transcription factor SCX and MKX is involved in tendon formation by regulating type-I collagen production[49, 58–60]. This study also conforms with the previous studies by showing that SCX and MKX upregulation in the first five days and increased type-I collagen production by day 21 (Figure 8) occurred for highly anisotropic group (SA=8). Type-III collagen mediate attachments of tendon and helps during healing of tendon injury[61–63]. The response of the body of tendon injury is to produce type-III collagen to quickly repair the damage[64, 65]. After long periods type-III collagen is remodeled to type-I collagen[63, 64]. In this study type-III collagen production was higher in anisotropic groups than the isotropic group (Figure 8). TSP-4 is one of the main tendon-related genes[66]. Tendon extracellular matrix contains TSP-4 which displays the highest tendon selective expression compared to other tissue types[66–68]. TSP-4 is also believed to bind to collagen and form complexes with COMP in tendon[68, 69]. TSP-4 was shown to be upregulated in both engineered scaffold-free tendon tissue and in collagen matrix[70, 71]. Recently, Ning et al. showed that TSP-4 was upregulated when cells were seeded on decellularized tendon slices[72]. The highly anisotropic group (SA=8) in this study showed higher level of TSP-4 immunofluorescence (Figure 8) than the SA=1 and SA=3 groups indicating that the anisotropy of the collagen sheet mimics the anisotropy of the tendon and increase TSP-4 level as in Ning et al.’s study.
4. Conclusions
To the best of our knowledge, this study is the first which demonstrated that stem cell fate is affected by not only the magnitude of stiffness but also by the directional anisotropy of the substrate stiffness. Such anisotropy can be a key determinant in driving cell morphology and differentiation during development and maintenance of anistropically stiff tissues. We have demonstrated a case for tendon differentiation and future studies will investigate genotypes and phenotypes associated with other anisotropic tissues such as skeletal or cardiac muscles.
5. Materials and Methods
5.1 Fabrication of Collagen Sheets by Electrochemical Compaction [Figure 1A]
Bovine dermis derived acid soluble monomeric type-I collagen solution (Advanced Biomatrix, San Diego, CA; 6 mg/ml) was diluted two-fold using RNAase/DNAase free water. The pH of the collagen solution was adjusted to 8–10 using 1 N NaOH and dialyzed against ultrapure water for 18 hours to prepare the collagen solution for electrocompaction.
Electrocompaction of collagen in the sheet form was carried out as described before[23, 24]. Briefly, a rectangular window of 30×10×1.5 mm was cut in a plastic piece. The plastic window was placed on planar carbon electrode and filled with the dialyzed collagen solution. Another plane carbon electrode was placed above the plastic boundary, sandwiching the collagen solution between the electrodes between which 30 VDC was applied for 2 min. Electric current electrophoretically mobilizes collagen molecules and compacts them under the effects of mechanisms detailed in an earlier publication[73]. This electrocompaction generates 100 microns thick rectangular sheets of 30×10 mm dimensions between the two planar electrodes.
5.2 Resolving the effects of topography from the effects of SA by cellulose acetate replication of surface topography
The topography of a highly stretched collagen sheet (SA=8) was replicated using a cellulose acetate sheet to assess whether stretch induced surface topographical alignment induce cell alignment and elongation. Briefly, a thin film of cellulose acetate sheet is wetted with acetone, placed on top of the highly stretched collagen sheet and kept for 5 minutes. The surface topographical pattern of the collagen sheet is replicated through the flow of solubilized the cellulose molecules. The replicated cellulose acetate samples were then peeled off and washed with deionized water to remove any trace of acetone.
5.3 Tuning of Molecular Alignment via Mechanical Stretch
A motorized mechanical device was built to align collagen molecules by stretching (Figure 1B). Randomly oriented collagen sheet was gripped in the device and stretched at a translational speed of 35µ/s to 20%, 40% and 60 % of their initial length of 20 mm to induce different levels of SA.
5.4 Imaging of Molecular Alignment in Compacted Collagen Sheets
The degree of alignment of collagen molecules at different levels of stretching was assessed by a polarized optical microscope equipped with a first order wavelength gypsum plate (Olympus BX51, Melville, NY, USA) and by using SEM.
Collagen is a positive birefringent material and the aligned molecules along the slower axis of the gypsum plate shows blue interference color and the molecules which are perpendicular to the slow axis appear yellow[74]. Magenta color indicates lack of alignment and emergence of blue in the CPI image indicates molecular alignment in the SW-NE direction or along the slower axis or perpendicular to the long dimension of the gypsum plate.
The surface morphology of collagen and cellulose acetate samples were observed by a scanning electron microscope (FEI Nova Nanolab 200, Hillsboro, Oregon) at a voltage of 3 kV and a beam current of 0.12 nA. Before analyzing the samples with SEM, all the samples were sputter coated with 5 nm thick layer of palladium (Denton Desk IV Coater DCH240).
5.5 Assessment of Mechanical Properties of Stretched Sheets (SA)
Treatment groups were: i) Unstretched, ii) 20% stretched, iii) 40% stretch, iv) 60% stretch. Collagen sheets were cut into 20×2 mm strips along the stretch direction (Longitudinal) or transversely to the stretch direction (Transverse) (n = 6–8 samples per group). Samples were hydrated in deionized water for 30 minutes and then they were tested under monotonic tension (Rheometrics Inc., NJ) until failure at a strain rate of 10 mm/min. Cross sectional areas of sheet samples were measured with a multi-photon confocal microscope (Leica TCS SP2, Wetzlar, Germany) in the hydrated state. Stress-strain curves were constructed from the load-displacement data using sample geometry. Moduli along the longitudinal (EL) and transverse (ET) directions were calculated from the slopes of the linear regions of stress strain curves. SA was defined by dividing the modulus in the longitudinal by the modulus in the transverse directions:
| (1) |
Similarly, stress anisotropy (STA) was defined as:
| (2) |
Where, σL and σT is defined as the maximum failure stress.
5.6 Effect of SA on Cytoskeletal and Nuclear Morphologies
Cells were seeded on sheets stretched to anisotropy levels of SA = 1 (isotropic), SA = 3 and SA = 8. Prior to cell seeding, samples were disinfected in 70% ethanol for 4 hours and washed in 1× PBS. Samples (n = 3 wells/group) were placed into ultralow attachment 24 well plates (Corning). Human MSCs (Lonza, Walkersville, MD) at passage 5 were seeded at a density of 5000 cells/cm2. The culture medium composed of alpha MEM (Invitrogen) supplemented with 10% MSC-Qualified FBS (Invitrogen), 1% penicillin/streptomycin and 50 µg/mL ascorbic acid.
Cell morphology was visualized by staining cytoskeletal actin filaments with AlexaFluor 488 Phalloidin (Life Technologies, Grand Island, NY, USA) at 6 and 12 hour time points. Cells were fixed with 3% formaldehyde (with 0.1% TritonX-100) for 10 min followed 1× PBS wash. The actin filaments were stained by incubating the cells in AlexaFluor 488 Phalloidin at 37 °C for 20 min. The stain was washed with 1× PBS and images of stained cells were taken using an Olympus Microscope (Olympus IX83) with a 20× objective lens. Images were taken from randomly selected fields of view (N=3–5 repeat measurements/sample). Cell nuclei were visualized by DAPI nucleic acid stain (Invitrogen). Briefly the stock solution was diluted to 300 nM in 1× PBS and added to the sample wells. Samples were incubated for 3 minutes for nucleic acid staining. The staining was washed with 1× PBS and images were taken as described for actin staining within the same field of view as actin staining. For actin staining imaging, EGFP filter (486/509 nm wave length) and for DAPI staining image DAPI filter (358/461 nm wavelength) was used.
5.7 Cell seeding on the replicated cellulose acetate film
Cells were seeded on the cellulose acetate film with the topography replication and without the topography replication (control) in similar method as described above. Cells were also seeded on collagen coated cellulose acetate sheet. Cellulose acetate samples were functionalized with Type I collagen with a stock solution of 50 µg/ml applied at 6 µg/cm2 area. Collagen-I surface coating was verified by Picro Sirius Red staining. Cell morphology was visualized by staining cytoskeletal actin filaments using AlexaFluor 488 Phalloidin (Life Technologies, Grand Island, NY, USA) after 6 hours.
5.8 Measurement of Cytoskeletal and Nucleus Morphologies
Cellular and nuclear morphologies were measured by ImageJ (NIH, MD, USA). An ellipse was fitted around each cell. The diameters of the major and the minor axes of the ellipse were recorded. The angle between the stretching direction and the major axis was defined as the cellular alignment angle Ɵ. Cell aspect ratio (r) was defined by the ratio of the diameters of the major axis to the minor axis.
5.9 Effect of SA on Tenogenic Differentiation of Human MSCs
Cells were seeded on electrocompacted collagen sheets which were stretched to anisotropy levels of SA = 1 (isotropic), SA = 3 and SA = 8 as elucidated earlier. Additionally, a random collagen gel group was included for this experiment which provides an SA of 1; however, collagen gel is less compliant than unstretched electrocompacted collagen sheet. Therefore, collagen gel enabled to sort out the effects of substrate stiffness. Collagen gel was synthesized by mixing acid soluble monomeric collagen solution with 10× PBS at a ratio of 8:1 parts and the pH was adjusted to 7.4 using 0.1 N NaOH. The neutral collagen solution was poured into the wells of a 6 well plate and gelled by incubating at 37 °C for 2h. At time points 1, 3 and 5 days total RNA was extracted by lysing the sells using TRIZOL reagent (Invitrogen) following manufacturer’s protocol. Briefly, chloroform was added to the trizol homogenized samples and the phase separation was performed by centrifuging the samples at 12,000 g for 15 min at 4 °C. The RNA was collected in a separate tube from the supernatant aqueous phase, precipitated by adding isopropanol and pelleted by centrifuging at 12,000 g for 10 min at 4 °C. 70% ethanol was used to wash the RNA pellet. The pellet was then dried and resuspended in RNAse/DNAse free water (Invitrogen) and stored at −80 °C. 2 µg of total RNA was reversed transcripted to synthesize cDNA using the cDNA Reverse Transcription Kit (Applied Biosystems). Taqman real time PCR mastermix (Applied Biosystems) and Taqman gene expression assays (Applied Biosystems) for early tendon specific or related genes (Scleraxis[42–48] and Mohawk[49–55]) were used to evaluate the expression of the genes by quantitative real time PCR (Applied Biosystems 7500 Real Time PCR System). The relative fold change in the target gene expression was quantified using 2 deltadeltaCt method by normalizing the target gene expression to RPLP0[17] as a housekeeping gene and relative to the expression on the random collagen gel at each time point.
5.10 Effect of SA on Tendon Related Matrix Synthesis
Cells were seeded on electrocompacted collagen sheets at anisotropy levels of SA = 1 (isotropic), SA = 3 and SA = 8 as described above. Cells were cultured for 21 days as described earlier. Three tendon-related extracellular matrix molecules were investigated: i) type-I collagen, ii) type-III collagen and iii) Thrombospondin-4 (TSP-4). For type-I and type-III collagen, immunohistochemistry was performed and for TSP-4 green immunofluorescence was performed.
Collagen sheet samples were fixed in 10% neutral buffered formalin, rinsed in 3 washes of PBS for 5 min each, permeabilized for 15 min in PBS containing 0.25% Triton X-100 followed by 3 washes in PBS for 5 min each. After blocking the samples in PBST (Phosphate Buffered Saline with Tween) containing 5% BSA, 22.52 mg/ml glycine and 0.1% Tween 20 for 30 min, the samples were incubated with primary antibody overnight at 4°C. The following antibodies were adopted for immunohistochemistry: mouse Anti-Col1A1 (Abcam), rabbit anti-Col III (Abcam), Thrombospondin 4 (Santa-Cruz). Samples incubated with blocking solution without primary antibody were used as negative control for the secondary antibody, and collagen sheet without cells were used as background negative control. Staining was performed by Alkaline phosphate substrate-chromogen using StayRed/AP kit (Abcam) according to manufacturer’s recommendations. Briefly, the samples were washed 3 times in PBS for 5 min each after overnight incubation with primary antibodies. Following the washes, the samples were incubated with a secondary ALP-conjugated antibody for an hour at room temperature. The samples were washed 3 times in PBS for 5 min each and incubated with StayRed/AP working solution (3 ml of StayRed/AP Substrate buffer containing one drop of StayRed/AP chromogen) for 15 min at room temperature. Samples were rinsed in PBS and imaged (N=3–5 repeat measurements/sample) using a microscope (Olympus IX83 digital microscope, Olympus Life Science). Images were processed and quantified by Cellsens Dimension software (Olympus Life Science).
For immunofluorescence, the anti-Rabbit Alexa-488 conjugated specific secondary antibody (Pierce Protein Biology, Thermo fisher Scientific) was used. The samples were visualized (N=3–5 repeat measurements/sample) under Olympus IX83 digital microscope (Olympus Life Science) using Cellsens Dimension software (Olympus Life Science)
Quantification of the protein staining was performed by ImageJ (NIH, Maryland, USA). The amount of type-I and type-III collagen staining was calculated by ImageJ colour thresholding[75]. The regions of interest were chosen randomly across the samples. Amount of TSP-4 was measured by corrected total cell fluorescence (CCTF) of each cell seeded on different group[76–79]. Briefly, the CCTF of a cell was measured by deducting the average fluorescence of the background around the cell from the average fluorescence of the cell area. Regions of interest were chosen randomly across the samples.
5.11 Statistical Analysis
Analysis of covariance (ANCOVA) was performed for mechanical data to check whether longitudinal modulus is significantly different from transverse modulus. Stretching level was taken as the covariant. Q-Q (Quantile-Quantile) plot of the residuals was plotted to check the normality of the data. A post hoc analysis using the Tukey’s test was conducted to compare the pair wise differences between different groups. The significance was set at p<0.05.
The cell study data were not normal according to the Q-Q plot, a two-way ANOVA equivalent of nonparametric test, ordered logistic regression (OLR) was used to check whether there is an effect of time point as well as anisotropy on cellular response. Non parametric Mann-Whitney U test was conducted to compare pairwise difference between groups (Figure 5) as a post hoc analysis. A Bonferroni correction was applied to the cell study statistical analysis to compensate for large data set and statistical significance was set at p<0.025. For protein quantification staining Mann-Whitney U test was conducted to compare difference between groups.
In the case of CCTF quantification of TSP-4, as cell data are involved, a Bonferroni correction was applied and statistical significance was set at p<0.025. Statistical computing tool “R” (R-Project, Vienna, Austria) was used to do all the statistical analysis.
Supplementary Material
Acknowledgments
This study was funded in part by grants from the National Science Foundation (Grant Number DMR-1306665) and National Institute of Health (Grant Number R01 AR063701).
References
- 1.Engler AJ, Sen S, Sweeney HL, Discher DE. Cell. 2006;126:677. doi: 10.1016/j.cell.2006.06.044. [DOI] [PubMed] [Google Scholar]
- 2.Kim DH, Han K, Gupta K, Kwon KW, Suh KY, Levchenko A. Biomaterials. 2009;30:5433. doi: 10.1016/j.biomaterials.2009.06.042. [DOI] [PMC free article] [PubMed] [Google Scholar]
- 3.Li Z, Gong Y, Sun S, Du Y, Lu D, Liu X, Long M. Biomaterials. 2013;34:7616. doi: 10.1016/j.biomaterials.2013.06.059. [DOI] [PubMed] [Google Scholar]
- 4.Saez A, Ghibaudo M, Buguin A, Silberzan P, Ladoux B. Proceedings of the National Academy of Sciences of the United States of America. 2007;104:8281. doi: 10.1073/pnas.0702259104. [DOI] [PMC free article] [PubMed] [Google Scholar]
- 5.Tong WY, Shen W, Yeung CWF, Zhao Y, Cheng SH, Chu PK, Chan D, Chan GCF, Cheung KMC, Yeung KWK, Lam YW. Biomaterials. 2012;33:7686. doi: 10.1016/j.biomaterials.2012.07.002. [DOI] [PubMed] [Google Scholar]
- 6.Wong S, Teo S-K, Park S, Chiam K-H, Yim EF. Biomechanics and Modeling in Mechanobiology. 2014;13:27. doi: 10.1007/s10237-013-0483-2. [DOI] [PubMed] [Google Scholar]
- 7.Yim EK, Reano RM, Pang SW, Yee AF, Chen CS, Leong KW. Biomaterials. 2005;26:5405. doi: 10.1016/j.biomaterials.2005.01.058. [DOI] [PMC free article] [PubMed] [Google Scholar]
- 8.Rape AD, Guo WH, Wang YL. Biomaterials. 2011;32:2043. doi: 10.1016/j.biomaterials.2010.11.044. [DOI] [PMC free article] [PubMed] [Google Scholar]
- 9.Hoffecker IT, Guo WH, Wang YL. Lab Chip. 2011;11:3538. doi: 10.1039/c1lc20504h. [DOI] [PubMed] [Google Scholar]
- 10.Leight JL, Wozniak MA, Chen S, Lynch ML, Chen CS. Mol Biol Cell. 2012;23:781. doi: 10.1091/mbc.E11-06-0537. [DOI] [PMC free article] [PubMed] [Google Scholar]
- 11.Plotnikov Sergey V, Pasapera Ana M, Sabass B, Waterman Clare M. Cell. 2012;151:1513. doi: 10.1016/j.cell.2012.11.034. [DOI] [PMC free article] [PubMed] [Google Scholar]
- 12.Bettinger CJ, Zhang Z, Gerecht S, Borenstein JT, Langer R. Advanced Materials. 2008;20:99. doi: 10.1002/adma.200702487. [DOI] [PMC free article] [PubMed] [Google Scholar]
- 13.Sjöström T, Lalev G, Mansell JP, Su B. Applied Surface Science. 2011;257:4552. [Google Scholar]
- 14.Biggs MJ, Richards RG, Gadegaard N, Wilkinson CD, Oreffo RO, Dalby MJ. Biomaterials. 2009;30:5094. doi: 10.1016/j.biomaterials.2009.05.049. [DOI] [PubMed] [Google Scholar]
- 15.Tseng LF, Mather PT, Henderson JH. Acta Biomater. 2013;9:8790. doi: 10.1016/j.actbio.2013.06.043. [DOI] [PubMed] [Google Scholar]
- 16.Wang S, Zhong S, Lim CT, Nie H. Journal of Materials Chemistry B. 2015;3:3358. doi: 10.1039/c5tb00026b. [DOI] [PubMed] [Google Scholar]
- 17.Younesi M, Islam A, Kishore V, Anderson JM, Akkus O. Advanced Functional Materials. 2014;24:5762. doi: 10.1002/adfm.201400828. [DOI] [PMC free article] [PubMed] [Google Scholar]
- 18.Kishore V, Bullock W, Sun X, Van Dyke WS, Akkus O. Biomaterials. 2012;33:2137. doi: 10.1016/j.biomaterials.2011.11.066. [DOI] [PMC free article] [PubMed] [Google Scholar]
- 19.Yim EKF, Pang SW, Leong KW. Experimental cell research. 2007;313:1820. doi: 10.1016/j.yexcr.2007.02.031. [DOI] [PMC free article] [PubMed] [Google Scholar]
- 20.Carter EM, Raggio CL. Current opinion in pediatrics. 2009;21:46. doi: 10.1097/mop.0b013e32832185c5. [DOI] [PubMed] [Google Scholar]
- 21.Kolacna L, Bakesova J, Varga F, Kostakova E, Planka L, Necas A, Lukas D, Amler E, Pelouch V. Physiological research / Academia Scientiarum Bohemoslovaca. 2007;56(Suppl 1):S51. doi: 10.33549/physiolres.931302. [DOI] [PubMed] [Google Scholar]
- 22.Cheng X, Gurkan UA, Dehen CJ, Tate MP, Hillhouse HW, Simpson GJ, Akkus O. Biomaterials. 2008;29:3278. doi: 10.1016/j.biomaterials.2008.04.028. [DOI] [PubMed] [Google Scholar]
- 23.Islam A, Chapin K, Younesi M, Akkus O. Biofabrication. 2015;7:035005. doi: 10.1088/1758-5090/7/3/035005. [DOI] [PMC free article] [PubMed] [Google Scholar]
- 24.Younesi M, Islam A, Kishore V, Panit S, Akkus O. Biofabrication. 2015;7:035001. doi: 10.1088/1758-5090/7/3/035001. [DOI] [PMC free article] [PubMed] [Google Scholar]
- 25.Cross VL, Zheng Y, Won Choi N, Verbridge SS, Sutermaster BA, Bonassar LJ, Fischbach C, Stroock AD. Biomaterials. 2010;31:8596. doi: 10.1016/j.biomaterials.2010.07.072. [DOI] [PMC free article] [PubMed] [Google Scholar]
- 26.Uquillas JA, Kishore V, Akkus O. Biomedical materials (Bristol, England) 2011;6:035008. doi: 10.1088/1748-6041/6/3/035008. [DOI] [PMC free article] [PubMed] [Google Scholar]
- 27.Amos FF, Dai L, Kumar R, Khan SR, Gower LB. Urol Res. 2009;37:11. doi: 10.1007/s00240-008-0169-x. [DOI] [PMC free article] [PubMed] [Google Scholar]
- 28.Li Y, Douglas EP. Colloids Surf B Biointerfaces. 2013;112:42. doi: 10.1016/j.colsurfb.2013.07.037. [DOI] [PubMed] [Google Scholar]
- 29.Kannus P. Scand J Med Sci Sports. 2000;10:312. doi: 10.1034/j.1600-0838.2000.010006312.x. [DOI] [PubMed] [Google Scholar]
- 30.Moore MJ, De Beaux A. Journal of Anatomy. 1987;153:163. [PMC free article] [PubMed] [Google Scholar]
- 31.Ippolito E, Natali PG, Postacchini F, Accinni L, De Martino C. J Bone Joint Surg Am. 1980;62:583. [PubMed] [Google Scholar]
- 32.Lee JY, Zhou Z, Taub PJ, Ramcharan M, Li Y, Akinbiyi T, Maharam ER, Leong DJ, Laudier DM, Ruike T, Torina PJ, Zaidi M, Majeska RJ, Schaffler MB, Flatow EL, Sun HB. PLoS One. 2011;6:e17531. doi: 10.1371/journal.pone.0017531. [DOI] [PMC free article] [PubMed] [Google Scholar]
- 33.F R, Stanley Rachael L, Patterson-Kane Janet C, Goodship Allen E, Ralphs Jim R. Microscopy and Analysi. 2006;20:5. [Google Scholar]
- 34.Choi JS, Kim EY, Kim MJ, Giegengack M, Khan FA, Khang G, Soker S. Biomed Mater. 2013;8:014108. doi: 10.1088/1748-6041/8/1/014108. [DOI] [PubMed] [Google Scholar]
- 35.Elsheikh A, Brown M, Alhasso D, Rama P, Campanelli M, Garway-Heath D. J Refract Surg. 2008;24:178. doi: 10.3928/1081597X-20080201-09. [DOI] [PubMed] [Google Scholar]
- 36.Galateanu B, Dinescu S, Cimpean A, Dinischiotu A, Costache M. Int J Mol Sci. 2012;13:15881. doi: 10.3390/ijms131215881. [DOI] [PMC free article] [PubMed] [Google Scholar]
- 37.He Z, Campolmi N, Ha Thi BM, Dumollard JM, Peoc'h M, Garraud O, Piselli S, Gain P, Thuret G. Mol Vis. 2011;17:3494. [PMC free article] [PubMed] [Google Scholar]
- 38.Pomari E, Stefanon B, Colitti M. Molecules. 2015;20:8409. doi: 10.3390/molecules20058409. [DOI] [PMC free article] [PubMed] [Google Scholar]
- 39.Yim EK, Sheetz MP. Stem Cell Res Ther. 2012;3:41. doi: 10.1186/scrt132. [DOI] [PMC free article] [PubMed] [Google Scholar]
- 40.Zhang G, Young BB, Ezura Y, Favata M, Soslowsky LJ, Chakravarti S, Birk DE. J Musculoskelet Neuronal Interact. 2005;5:5. [PubMed] [Google Scholar]
- 41.Richardson SH, Starborg T, Lu Y, Humphries SM, Meadows RS, Kadler KE. Molecular and Cellular Biology. 2007;27:6218. doi: 10.1128/MCB.00261-07. [DOI] [PMC free article] [PubMed] [Google Scholar]
- 42.Schweitzer R, Chyung JH, Murtaugh LC, Brent AE, Rosen V, Olson EN, Lassar A, Tabin CJ. Development. 2001;128:3855. doi: 10.1242/dev.128.19.3855. [DOI] [PubMed] [Google Scholar]
- 43.Brent AE, Schweitzer R, Tabin CJ. Cell. 2003;113:235. doi: 10.1016/s0092-8674(03)00268-x. [DOI] [PubMed] [Google Scholar]
- 44.Cserjesi P, Brown D, Ligon KL, Lyons GE, Copeland NG, Gilbert DJ, Jenkins NA, Olson EN. Development. 1995;121:1099. doi: 10.1242/dev.121.4.1099. [DOI] [PubMed] [Google Scholar]
- 45.Perez AV, Perrine M, Brainard N, Vogel KG. Mech Dev. 2003;120:1153. doi: 10.1016/j.mod.2003.08.003. [DOI] [PubMed] [Google Scholar]
- 46.Chen X, Yin Z, Chen J-l, Shen W-l, Liu H-h, Tang Q-m, Fang Z, Lu L-r, Ji J, Ouyang H-w. Sci. Rep. 2012;2 doi: 10.1038/srep00977. [DOI] [PMC free article] [PubMed] [Google Scholar]
- 47.Chen X, Yin Z, Chen JL, Liu HH, Shen WL, Fang Z, Zhu T, Ji J, Ouyang HW, Zou XH. Tissue Eng Part A. 2014;20:1583. doi: 10.1089/ten.TEA.2012.0656. [DOI] [PubMed] [Google Scholar]
- 48.Park A, Hogan MV, Kesturu GS, James R, Balian G, Chhabra AB. Tissue Eng Part A. 2010;16:2941. doi: 10.1089/ten.tea.2009.0710. [DOI] [PMC free article] [PubMed] [Google Scholar]
- 49.Ito Y, Toriuchi N, Yoshitaka T, Ueno-Kudoh H, Sato T, Yokoyama S, Nishida K, Akimoto T, Takahashi M, Miyaki S, Asahara H. Proceedings of the National Academy of Sciences. 2010;107:10538. doi: 10.1073/pnas.1000525107. [DOI] [PMC free article] [PubMed] [Google Scholar]
- 50.Anderson DM, Arredondo J, Hahn K, Valente G, Martin JF, Wilson-Rawls J, Rawls A. Dev Dyn. 2006;235:792. doi: 10.1002/dvdy.20671. [DOI] [PubMed] [Google Scholar]
- 51.Onizuka N, Ito Y, Inagawa M, Nakahara H, Takada S, Lotz M, Toyama Y, Asahara H. J Orthop Sci. 2014;19:172. doi: 10.1007/s00776-013-0485-z. [DOI] [PMC free article] [PubMed] [Google Scholar]
- 52.Liu H, Zhang C, Zhu S, Lu P, Zhu T, Gong X, Zhang Z, Hu J, Yin Z, Heng BC, Chen X, Ouyang HW. Stem Cells. 2015;33:443. doi: 10.1002/stem.1866. [DOI] [PubMed] [Google Scholar]
- 53.Otabe K, Nakahara H, Hasegawa A, Matsukawa T, Ayabe F, Onizuka N, Inui M, Takada S, Ito Y, Sekiya I, Muneta T, Lotz M, Asahara H. J Orthop Res. 2015;33:1. doi: 10.1002/jor.22750. [DOI] [PMC free article] [PubMed] [Google Scholar]
- 54.Miyabara S, Yuda Y, Kasashima Y, Kuwano A, Arai K. J Equine Sci. 2014;25:7. doi: 10.1294/jes.25.7. [DOI] [PMC free article] [PubMed] [Google Scholar]
- 55.Farhat YM, Al-Maliki AA, Chen T, Juneja SC, Schwarz EM, O'Keefe RJ, Awad HA. PLoS One. 2012;7:e51411. doi: 10.1371/journal.pone.0051411. [DOI] [PMC free article] [PubMed] [Google Scholar]
- 56.Lejard V, Blais F, Guerquin MJ, Bonnet A, Bonnin MA, Havis E, Malbouyres M, Bidaud CB, Maro G, Gilardi-Hebenstreit P, Rossert J, Ruggiero F, Duprez D. The Journal of biological chemistry. 2011;286:5855. doi: 10.1074/jbc.M110.153106. [DOI] [PMC free article] [PubMed] [Google Scholar]
- 57.Liu X, Wu H, Byrne M, Krane S, Jaenisch R. Proceedings of the National Academy of Sciences. 1997;94:1852. doi: 10.1073/pnas.94.5.1852. [DOI] [PMC free article] [PubMed] [Google Scholar]
- 58.Espira L, Lamoureux L, Jones SC, Gerard RD, Dixon IM, Czubryt MP. Journal of molecular and cellular cardiology. 2009;47:188. doi: 10.1016/j.yjmcc.2009.03.024. [DOI] [PubMed] [Google Scholar]
- 59.Léjard V, Brideau G, Blais F, Salingcarnboriboon R, Wagner G, Roehrl MH, Noda M, Duprez D, Houillier P, Rossert J. Journal of Biological Chemistry. 2007;282:17665. doi: 10.1074/jbc.M610113200. [DOI] [PubMed] [Google Scholar]
- 60.Liu W, Watson SS, Lan Y, Keene DR, Ovitt CE, Liu H, Schweitzer R, Jiang R. Molecular and cellular biology. 2010;30:4797. doi: 10.1128/MCB.00207-10. [DOI] [PMC free article] [PubMed] [Google Scholar]
- 61.Eriksen HA, Pajala A, Leppilahti J, Risteli J. Journal of Orthopaedic Research. 2002;20:1352. doi: 10.1016/S0736-0266(02)00064-5. [DOI] [PubMed] [Google Scholar]
- 62.Liu SH, Yang R-S, Al-Shaikh R, Lane JM. Clinical orthopaedics and related research. 1995;318:265. [PubMed] [Google Scholar]
- 63.Millar NL, Gilchrist DS, Akbar M, Reilly JH, Kerr SC, Campbell AL, Murrell GA, Liew FY, Kurowska-Stolarska M, McInnes IB. Nature communications. 2015;6 doi: 10.1038/ncomms7774. [DOI] [PMC free article] [PubMed] [Google Scholar]
- 64.Sharma P, Maffulli N. The Journal of Bone & Joint Surgery. 2005;87:187. doi: 10.2106/JBJS.D.01850. [DOI] [PubMed] [Google Scholar]
- 65.Sharma P, Maffulli N. Journal of Musculoskeletal and Neuronal Interactions. 2006;6:181. [PubMed] [Google Scholar]
- 66.Jelinsky SA, Archambault J, Li L, Seeherman H. Journal of Orthopaedic Research. 2010;28:289. doi: 10.1002/jor.20999. [DOI] [PubMed] [Google Scholar]
- 67.Hauser N, Paulsson M, Kale AA, DiCesare PE. FEBS letters. 1995;368:307. doi: 10.1016/0014-5793(95)00675-y. [DOI] [PubMed] [Google Scholar]
- 68.Södersten F, Ekman S, Schmitz M, Paulsson M, Zaucke F. Connective tissue research. 2006;47:85. doi: 10.1080/03008200600584124. [DOI] [PubMed] [Google Scholar]
- 69.Narouz-Ott L, Maurer P, Nitsche DP, Smyth N, Paulsson M. Journal of Biological Chemistry. 2000;275:37110. doi: 10.1074/jbc.M007223200. [DOI] [PubMed] [Google Scholar]
- 70.Barsby T, Bavin EP, Guest DJ. Tissue Engineering Part A. 2014;20:2604. doi: 10.1089/ten.tea.2013.0457. [DOI] [PMC free article] [PubMed] [Google Scholar]
- 71.Ni M, Rui YF, Tan Q, Liu Y, Xu LL, Chan KM, Wang Y, Li G. Biomaterials. 2013;34:2024. doi: 10.1016/j.biomaterials.2012.11.046. [DOI] [PubMed] [Google Scholar]
- 72.Ning L-J, Zhang Y-J, Zhang Y, Qing Q, Jiang Y-L, Yang JL, Luo J-C, Qin T-W. Biomaterials. 2015;52:539. doi: 10.1016/j.biomaterials.2015.02.061. [DOI] [PubMed] [Google Scholar]
- 73.Uquillas JA, Akkus O. Ann Biomed Eng. 2012;40:1641. doi: 10.1007/s10439-012-0528-1. [DOI] [PubMed] [Google Scholar]
- 74.Martin R, Farjanel J, Eichenberger D, Colige A, Kessler E, Hulmes DJ, Giraud-Guille MM. Journal of molecular biology. 2000;301:11. doi: 10.1006/jmbi.2000.3855. [DOI] [PubMed] [Google Scholar]
- 75.Papadopulos F, Spinelli M, Valente S, Foroni L, Orrico C, Alviano F, Pasquinelli G. Ultrastructural pathology. 2007;31:401. doi: 10.1080/01913120701719189. [DOI] [PubMed] [Google Scholar]
- 76.Burgess A, Vigneron S, Brioudes E, Labbe JC, Lorca T, Castro A. Proceedings of the National Academy of Sciences of the United States of America. 2010;107:12564. doi: 10.1073/pnas.0914191107. [DOI] [PMC free article] [PubMed] [Google Scholar]
- 77.Gavet O, Pines J. Developmental cell. 2010;18:533. doi: 10.1016/j.devcel.2010.02.013. [DOI] [PMC free article] [PubMed] [Google Scholar]
- 78.McCloy RA, Rogers S, Caldon CE, Lorca T, Castro A, Burgess A. Cell cycle (Georgetown, Tex.) 2014;13:1400. doi: 10.4161/cc.28401. [DOI] [PMC free article] [PubMed] [Google Scholar]
- 79.Potapova TA, Sivakumar S, Flynn JN, Li R, Gorbsky GJ. Molecular biology of the cell. 2011;22:1191. doi: 10.1091/mbc.E10-07-0599. [DOI] [PMC free article] [PubMed] [Google Scholar]
Associated Data
This section collects any data citations, data availability statements, or supplementary materials included in this article.


