Abstract
Siberia and Northwestern Russia are home to over 40 culturally and linguistically diverse indigenous ethnic groups, yet genetic variation and histories of peoples from this region are largely uncharacterized. We present deep whole-genome sequencing data (∼38×) from 28 individuals belonging to 14 distinct indigenous populations from that region. We combined these data sets with additional 32 modern-day and 46 ancient human genomes to reconstruct genetic histories of several indigenous Northern Eurasian populations. We found that Siberian and East Asian populations shared 38% of their ancestry with a 45,000-yr-old Ust’-Ishim individual who was previously believed to have no modern-day descendants. Western Siberians trace 57% of their ancestry to ancient North Eurasians, represented by the 24,000-yr-old Siberian Mal'ta boy MA-1. Eastern Siberian populations formed a distinct sublineage that separated from other East Asian populations ∼10,000 yr ago. In addition, we uncovered admixtures between Siberians and Eastern European hunter-gatherers from Samara, Karelia, Hungary, and Sweden (from 8000–6600 yr ago); Yamnaya people (5300–4700 yr ago); and modern-day Northeastern Europeans. Our results provide new insights into genetic histories of Siberian and Northeastern European populations and evidence of ancient gene flow from Siberia into Europe.
Siberia is a vast geographical region of Russia located to the east of Ural Mountains. Understanding population history of people traditionally occupying Siberia and the Trans-Uralic region (the territory to the west and east of the Ural Mountains) is of great historical interest and would shed light on origins of both modern-day Eurasians and populations of the New World. Recent studies demonstrated the potential of whole-genome sequencing for detecting genetic relationships between various European and Asian populations and identifying genetic links between modern and ancient inhabitants from these regions (Der Sarkissian et al. 2013; Lazaridis et al. 2014; Raghavan et al. 2014). However, large-scale population genetic mapping efforts such as the 1000 Genomes Project (The 1000 Genomes Project Consortium 2012) and HapMap (The International HapMap 3 Consortium 2010) have not surveyed genetic landscapes of populations from Russia.
Siberia has been inhabited by hominins for hundreds of thousands of years, with some of the known archeological sites being older than 260,000 yr (Waters et al. 1997). Neanderthals inhabited Europe and Siberia until ∼40,000 yr ago (40 kya) (Hublin 2009), and anatomically modern humans expanded to these regions 60–40 kya (Hublin 2012). Traces of habitation of anatomically modern humans in Siberia date to at least 45 kya, based on a bone recently discovered near an Ust’-Ishim settlement in Western Siberia (Fu et al. 2014). The Ust’-Ishim's genome provided evidence for ancient human and Neanderthal admixture that occurred ∼50–60 kya (Fu et al. 2014). Other ancient human sites in Siberia yielded ancient DNA from ancient North Eurasians (ANEs) (Lazaridis et al. 2014), including the Upper Paleolithic 24,000-yr-old Siberian Mal'ta boy MA-1 (Raghavan et al. 2014) and the 17,000-yr-old Siberian AG-2 (Raghavan et al. 2014). Analysis of these genomes revealed genetic contribution from the ANE people to the genetic makeup of Western Siberians, Europeans, and early indigenous Americans (Lazaridis et al. 2014; Raghavan et al. 2014).
Substantial changes in the Eurasian genetic landscape took place during the Bronze Age (around 5–3 kya), a period of major cultural changes involving large-scale population migrations and replacements (Allentoft et al. 2015). The Yamnaya culture, associated with late Proto-Indo-Europeans, emerged during this time period in the Southwestern Siberian Ural region and the Pontic steppe region of Southeastern Europe (Allentoft et al. 2015; Haak et al. 2015; Jones et al. 2015). Yamnaya steppe herders, who traced their origins to Eastern European and Caucasus hunter-gatherer groups, had largely replaced the Neolithic farming culture in Eastern Europe. As a result, the Bronze Age farmers throughout much of Europe had more hunter-gatherer ancestry compared with their predecessors (Haak et al. 2015). At the same time, early Western and Eastern Europeans came into contact during the Bronze Age. The Late Neolithic Corded Ware people from Germany traced ∼75% of their ancestry to the Yamnaya people (Haak et al. 2015). These migration events influenced the present-day population structures of both Europe and Siberia, but their details remain largely unclear. Little is known about the genetic makeup of Siberian indigenous groups and their genetic links to European and East Asian populations. Furthermore, previous studies have not estimated the genetic contribution of ancient Eurasians to the genomes of modern Siberian indigenous groups, particularly for the Western Siberian populations of Mansi, Khanty, and Nenets people.
Siberia is commonly subdivided into western and eastern regions. The territory of Western Siberia extends from the Trans-Uralic region in the west to the Yenisei River in the east. Western Siberian ethnic groups of Mansi, Khanty, and Nenets, as well as many other indigenous people from this region, speak languages that are broadly categorized as Uralic and are further subdivided into Ugric, Finno-Permic, and Samoyedic language groups (Supplemental Fig. S1). Western Siberians Khanty and Mansi, together with 13 million Hungarians in central Europe, are members of the Ugric language group. The language of Northwestern Siberian Nenets people belongs to the Samoyedic branch of Uralic languages, suggesting shared history between Nenets people and other Western Siberian populations. Despite the geographical separation, several European populations also speak languages that are related to Ugric languages spoken by Western Siberians. These populations include Komi, Karelians, Veps, Saami, and Finns, who traditionally occupy areas of Northern and Northeastern Europe. Their languages belong to Permic and Finno-Volgaic language groups and are distantly related to other Ugric languages (Supplemental Fig. S1).
Eastern Siberian groups settled in the Siberian taiga region between the Yenisei River in the west and Sea of Okhotsk in the east. Areas that were historically occupied by Evens, Evenks, and Yakuts account for the majority of the Eastern Siberian territory. Traditional territories of Altayan people are in the very center of Asia at the junction of the Siberian taiga, the steppes of Kazakhstan, and the semi-deserts of Mongolia. Kalmyks, who settled in the lower Volga region in Eastern Europe, migrated to these areas in the 17th century from Dzungaria, a region in northwestern China (Erdeniev 1985). Languages of the Eastern Siberian indigenous populations together with the Kalmyk and Altayan languages are broadly categorized as Altaic and are further subdivided into Mongolic, Tungusic, and Turkic groups (Supplemental Fig. S1).
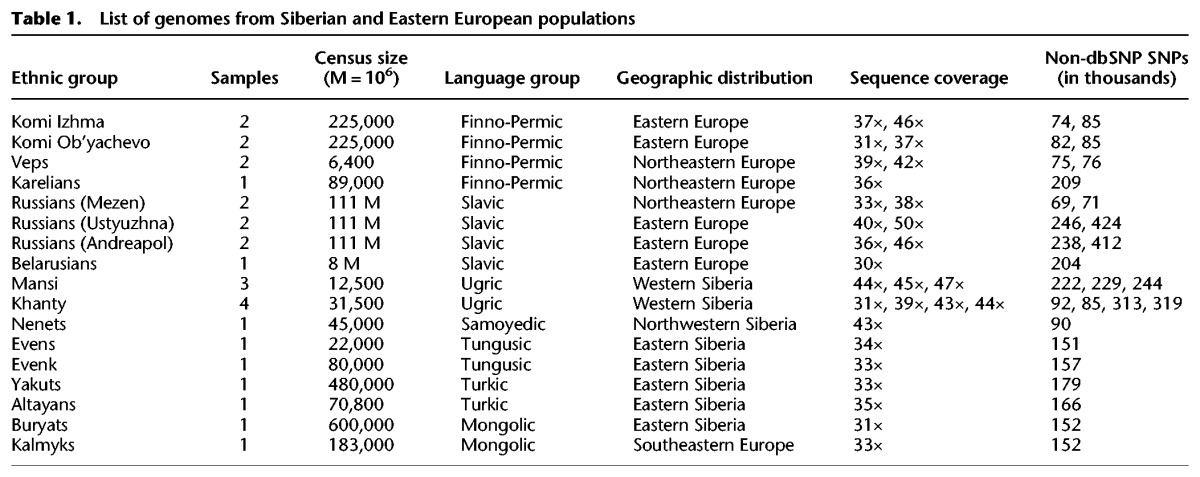
To further understand the genetic relationships and ancient history of indigenous Northeastern European and Siberian populations, spanning thousands to tens of thousands of years, we performed deep genome sequencing of 28 individuals (with an average sequence coverage depth of 38×), representing 14 major ethnic groups from Northeastern Europe and Siberia, including undersurveyed Western Siberian groups (Table 1), and compared them to 32 publicly available high-coverage modern genomes from 18 populations (Supplemental Table S2; Wong et al. 2013, 2014; Zhou et al. 2013; Jeong et al. 2014; Prufer et al. 2014), two hominin genomes, the Neanderthal (Prufer et al. 2014), and Denisova genomes (Meyer et al. 2012), as well as 46 publicly available ancient genomes from other studies (Supplemental Table S3).
Table 1.
List of genomes from Siberian and Eastern European populations
Results
An overview of population relationships
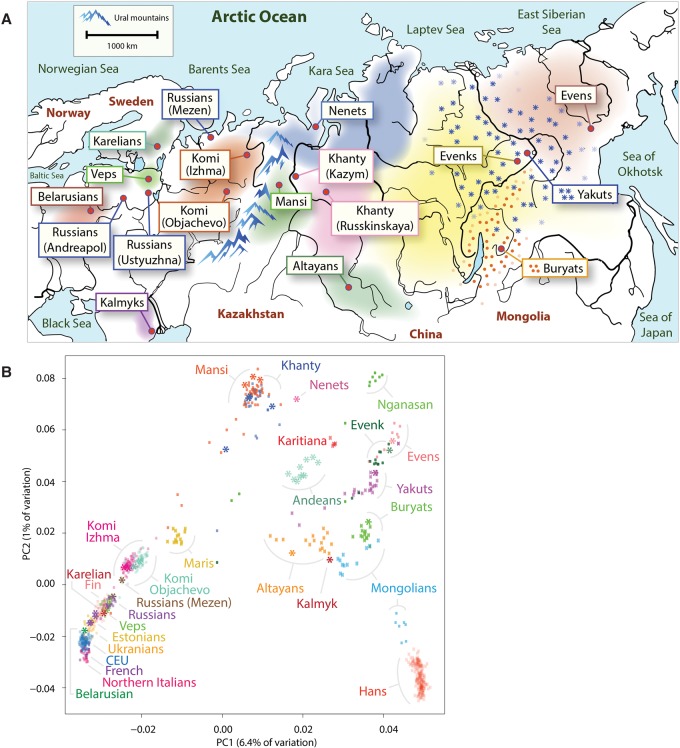
First, we sought to obtain a broad overview of population genetic relationships and to gain insight into the levels of genetic heterogeneity of the populations using principal component analysis (PCA). We combined both publicly available DNA microarray genotyping data from 892 present-day human individuals (Li et al. 2008; The 1000 Genomes Project Consortium 2012; Yunusbayev et al. 2012; Fedorova et al. 2013; Khrunin et al. 2013; Zhou et al. 2013; Raghavan et al. 2014), representing 27 diverse Asian, European, Siberian and Native American populations (Fig. 1B; Supplemental Fig. S2; Supplemental Table S1), and 82 individuals from Mansi (N = 45) and Khanty (N = 37) groups genotyped for the first time, using high-density SNP microarrays. To provide relative placement of samples that were a focus of this study, we projected their sequenced genomes onto the principal components. All the sequenced genomes clustered with genotyped samples from corresponding populations, confirming that the sequenced genomes were good representatives of these groups.
Figure 1.
Geographic and genetic affinities of European and Siberian populations. (A) Map of Siberia, Western Russia, and Eastern Europe shows geographic locations of individuals sequenced as part of this work. Colored areas of the map show geographical areas traditionally occupied by corresponding populations (Peoples of Russia 1994). The Ural Mountain range, a natural boundary between Europe and Siberia, is shown as blue peaks. Western Siberian ethnic groups that include Mansi, Khanty, and Nenets people inhabit the vast regions of taiga stretching from the Ural Mountains in Western Siberia to the Yenisei River in the Siberian East. Northeastern European populations, including Komi, Karelians, and Veps, occupy areas to the west of Ural Mountains. The Eastern Siberian populations, including Altayans, Yakuts, Buryats, Evens, and Evenks, occupy the Siberian taiga region between the Yenisei River in the west and Sea of Okhotsk in the east. Kalmyks migrated in the 17th century to the lower Volga region from a region in northwestern China. (B) Principal component analysis (PCA) of 892 modern-day humans from 27 populations mainly from Siberia and Europe. PCA was performed using a common set of 137,637 SNPs. Sequenced samples are shown using an asterisk. Samples genotyped using DNA microarrays are shown with dots.
The PCA plot captured major differentiation of populations along the first principal component, accounting for 6.4% of the genetic variation. The first principal component corresponds to the west-to-east gradient across Eurasia. The second principal component captured the spread of populations along the north-to-south latitudinal cline, especially among Siberians, capturing 1% of the genetic variation. The PCA plot reveals substantial genetic differentiation between Siberian groups. This suggests that Siberian populations harbor significant genetic diversity not represented by other populations (e.g., European populations, which show only very modest levels of population-specific variation).
Admixture events between Western and Eastern Siberians
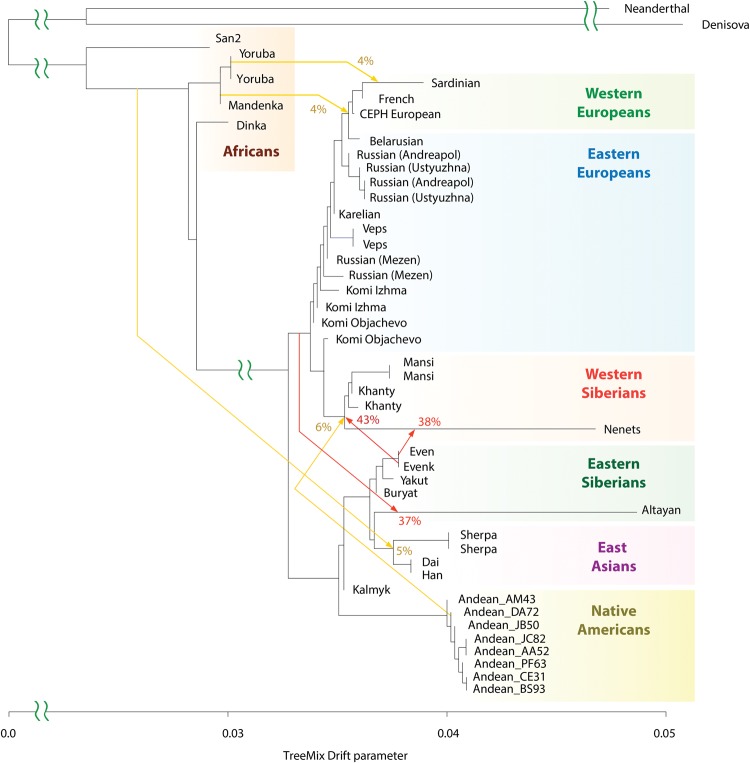
Next, we used TreeMix (Pickrell and Pritchard 2012) to construct a tree-based model of population genetic relationships and inter-population admixtures using a set of 30.1 million genome-wide autosomal SNPs inferred from the whole-genome sequencing data. The model placed European and Asian populations along the two early diverging branches (Fig. 2). Furthermore, the Western Siberian Mansi, Khanty, and Nenets groups formed an early diverging subclade with affinity to other Eastern European populations. Most Eastern Siberians, including the Even, Evenk, Buryat, and Yakut groups, formed a separate lineage more related to East Asian populations.
Figure 2.
Genetic relationships of modern-day Siberian, Asian, Native American, European, and African populations. Autosomal TreeMix admixture graph based on whole-genome sequencing data from 44 individuals primarily from Africa, Europe, Siberia, and America. The x-axis represents genetic drift, which is proportional to the effective population size Ne. Admixture events are shown with arrows, with admixture intensities indicated by percentages. Residuals are shown in Supplemental Figure S5.
The TreeMix model also revealed several important admixture events. In particular, we found that 43% (95% CI: 38%–47%) of the Western Siberian ancestry could be attributed to an ancient admixture, with the Eastern Siberian population most related to the modern-day Evenk people. The Northwestern Siberian Nenets people exhibited evidence of an additional admixture, with the Eastern Siberian population closely related to modern-day Evens. We estimated that 38% (95% CI: 31%–46%) of the Nenets’ ancestry could be attributed to this admixture event. To further confirm these predictions, we computed D-statistics (Durand et al. 2011; Patterson et al. 2012) to test for an excess of shared alleles between the Western Siberian and Eastern Siberian groups (Supplemental Figs. S7A–C, S8A–C, S18). In agreement with the TreeMix inference, we observed significant genetic affinity between the Mansi and Evenk, the Khanty and Evenk, and the Nenets and Even people based on the D-statistics tests (Supplemental Figs. S7A–C, 8A–C). These observations support the ancient admixture between ancestors of modern Western and Eastern Siberian populations.
Notably, TreeMix also inferred an admixture signal between common ancestors of the Mansi, Khanty, and Nenets and Native American Andean Highlanders, an indication of their shared genetic history. This event accounts for 6% (95% CI: 4%–8%) of the Western Siberian ancestry. As discussed below, this admixture can be explained by a genetic link of both Western Siberians and Native Americans to ANEs.
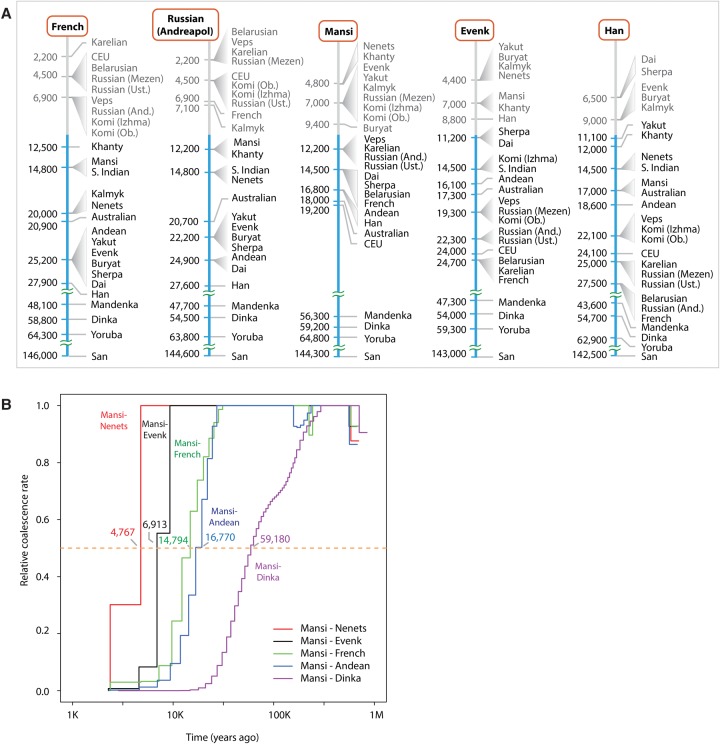
Phylogenetic trees provide simplified demographic models, lacking precise information about divergence times of ancestral lineages. The lengths of TreeMix branches are proportional to units of drift parameter (Pickrell and Pritchard 2012) and cannot be directly related to the time of population divergence. Furthermore, branch lengths can be affected by population bottlenecks, which further complicates the inference of population divergence time and limits interpretability of the model. In an attempt to provide more direct estimates of the divergence time between populations, we employed multiple sequentially Markovian coalescent (MSMC) analysis (Fig. 3A; Schiffels and Durbin 2014). We designated the time at which the relevant cross-coalescence rate between two populations becomes 0.5 as a proxy for their separation time (Fig. 3B). The MSMC method is particularly informative for events that are older than 10,000 yr, when each population is represented by only a single individual (Schiffels and Durbin 2014); estimates more recent than 10,000 yr ago are less precise, unless more individuals are included in the analysis.
Figure 3.
MSMC analysis of population separation times. (A) Separation times were calculated for each of the five reference individuals (French, Andreapol Russian, Mansi, Evenk, and Han). Reference populations are shown at the top (inside the orange rounded rectangles). Each reference population column shows MSMC separation time estimates between the reference population and other populations of interest. Populations of interest were sorted according to their separation time from diverging most recently (top) to the oldest (bottom). Separation times are shown on the left side of each graph. Populations with similar times were grouped together. (And) Andreapol; (Ust) Ustyuzhna; (Ob) Objachevo. MSMC separation times under 10,000 yr may be noisy, and therefore, such separation times and corresponding populations are shown in a gray-colored font. (B) MSMC cross-coalescence plots corresponding to divergence between Mansi and five other populations (Nenets, Evenks, French, Andean Highlanders, Dinka). The median separation value (y = 0.5; orange line) was used as a proxy for the population divergence time.
Our MSMC analysis suggested that the Mansi, Khanty, and Nenets separated relatively recently (4.8 kya), after the ancestral populations of Western Siberians experienced an admixture with an ancient group most related to the modern-day Evenk population (Fig. 2). This admixture can be dated to ∼6.8 kya based on the estimated separation time between the Mansi and Evenk populations. These time estimates are only approximate and should be interpreted with caution; however, the relative order of populations (Fig. 3A) is still informative for interpreting their relative genetic affinities. To further confirm these estimates, we performed a more computationally intensive, but more accurate eight-haplotype MSMC analysis using two individuals per population. The results from this analysis provided a similar estimate of 9.9 kya for the time of the Eastern Siberian admixture into Western Siberian populations (Supplemental Fig. S9). Therefore, the Eastern and Western Siberian populations likely came into contact within the last 5000–10,000 yr.
Relationships of modern-day Europeans and Siberians
The phylogenetic tree model placed almost all modern-day Europeans (except for Kalmyks, who migrated to Europe ∼400 yr ago) along a single branch, with the divergence pattern mimicking the east-to-west distribution of populations within Europe (Fig. 2). Confirming the observation from the PCA analysis (Fig. 1B) that Western and Eastern European populations were fairly close genetically, MSMC results showed that the separation times between the French and Eastern European populations fell in the range of 2.2 kya (French-Karelian) to 7 kya (French-Komi Objachevo). In contrast, the smallest separation time estimate between the French and Siberian populations was 12.5 kya (French-Khanty), exceeding the separation time between any two European populations by a wide margin.
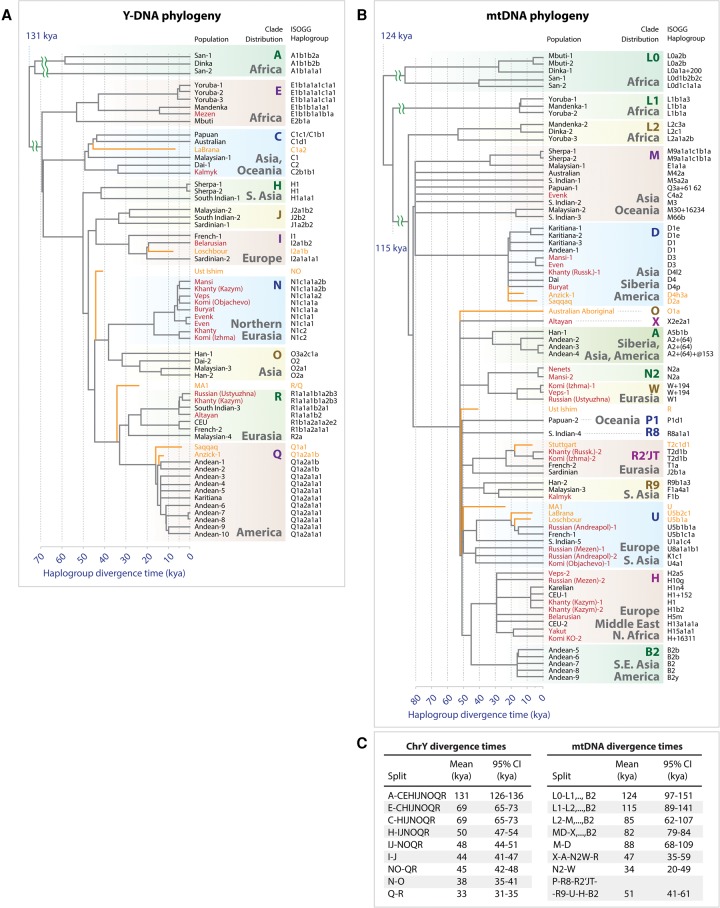
To provide additional support for our autosomal results, we analyzed SNPs within a portion of Y-Chromosome and estimated divergence times of population-specific haplogroups (Fig. 4A). Our Y-Chromosome analysis (Methods; section “Y-Chromosome and mtDNA Analyses” in Supplemental Information) showed evidence of gene flow from the Siberian populations into Eastern and Northern Europe. A Y-Chromosome clade, the N haplogroup, was linked to ancient Siberian populations (Fu et al. 2014). The N haplogroup is common in both modern Siberia and Eastern Europe (Malyarchuk et al. 2004; Lappalainen et al. 2008; Mirabal et al. 2009) but not among Western Europeans. We observed an expansion of N1c1 Y-Chromosome haplogroup among Siberian (Evens, Evenks, Mansi, Khanty) and Northeastern European populations (Veps and Komi) that occurred ∼5.3–7.1 kya. This suggests that the N1c1 haplogroup reached Europe only relatively recently and had limited spread among populations of Western Europe.
Figure 4.
Y-Chromosome and mtDNA phylogeny and haplogroup divergence times. (A) Y-Chromosome tree topology was calculated using maximum likelihood approach implemented in MEGA tool (Tamura et al. 2011) using 12,394 polymorphic sites within high-confidence regions defined by Poznik et al. (2013). The x-axis represents divergence time of haplogroups and is expressed in units of thousands of years ago (1 kya = 1000 yr ago). The tree was constructed using the data from 54 modern-day humans from 30 populations. Split times were calculated according to the number of derived alleles assigned to each branch (Methods), and splits were placed along the x-axis to reflect haplotype divergence time. Terminal branches end at X = 0 for modern-day individuals. Seven ancient individuals were placed on the haplotype tree according to the SNP-sharing patterns with high-confidence–derived allele SNVs assigned to each branch. Branches of ancient individuals (orange lines) terminate at times when each ancient individual lived. Haplogroups were assigned based on ISOGG Y-Chromosome SNP index and shown along the right side of the tree (International Society of Genetic Genealogy 2014). Individuals sequenced as part of this work are shown in red. (B) mtDNA phylogeny was constructed using MEGA tool in a similar fashion to the Y-Chromosome tree. The tree includes data from 70 individuals and 34 populations, as well as eight ancient genomes. (C) Divergence times of haplogroups from Y-Chromosome phylogeny (left) and mtDNA phylogeny (right). Diverging clades are shown on the left sides (“Split” columns). Confidence intervals were calculated using Poisson model.
Interestingly, the tree constructed from mtDNA haplotypes (Fig. 4B) did not show a similarly distinct clade shared among the Siberians and Northeastern Europeans that diverged 5–10 kya. We note, however, that the mtDNA tree has a greater diversity of haplogroups, which are sampled very sparsely across individuals that we sequenced.
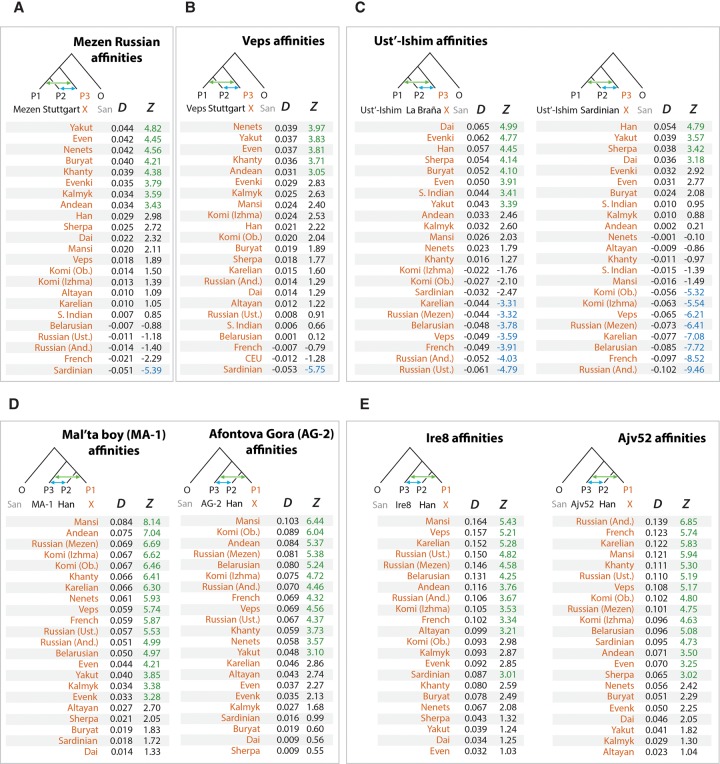
We further used D-statistics test to test for gene flows occurring during the last 7000 yr between the Western Siberian and Northeastern European populations (Fig. 5A,B; Supplemental Figs. S7G,K,L, S8G,K,L, S13A,B). In agreement with the N1c1 haplogroup expansion, Northeastern Europeans, including Mezen Russians, Veps, Karelians, and Komi, showed statistically significant admixture signals with Siberian groups such as the Nenets, Evens, Yakut, and Khanty. These admixtures were much weaker among more southern populations in Eastern Europe, such as Ustyuzhna and Andreapol Russians, as well as a Belarusian individual (Supplemental Figs. S7H–J, S8H–J), indicating that Siberian admixtures are particularly strong among Northeastern Europeans.
Figure 5.
Analysis of admixtures using D-statistics. Genetic affinities were determined using D-statistics test D(P1, P2, P3, O) as defined previously (Durand et al. 2011). (A) Mezen Russian affinities; (B) Veps affinities; (C) Ust’-Ishim affinities; (D) Mal'ta boy (MA-1) and Afontova Gora (AG-2) affinities; (E) Ire8 and Ajv52 affinities. The affinities of a variable population X (orange color) relative to other populations were calculated using ADMIXTOOLS (Patterson et al. 2012) and shown under the D column. Statistical significance of admixture was expressed as a z-score and shown under the Z column. A green font was used to highlight significant admixtures between P1 and P3 (Z > 3). A blue font was used to highlight significant admixture between P2 and P3 (Z < −3). African San was used as an outgroup in all tests. (And) Andreapol; (Ust) Ustyuzhna; (Ob) Objachevo. D-Statistics results using different outgroups (Chimp, Mandenka, Mbuti) are shown in Supplemental Figures S13 and S17.
Genetic affinity between Eastern Siberians and East Asians
Based on the TreeMix results, we observed that Eastern Siberians had a stronger genetic affinity to Native American and East Asian populations than to Europeans (Fig. 2). Eastern Siberian populations, such as Buryats, Yakuts, Evens, and Evenks, form a distinct sublineage after diverging from Han, Dai, and Sherpa, the East Asian populations (Fig. 2; Supplemental Figs. S3, S4). By use of MSMC, we estimated the separation time between Eastern Siberians and East Asian populations was between 8.8–11.2 kya (based on Evenk-Han and Evenk-Sherpa separation time estimates) (Fig. 3A). The existence of the Eastern Siberian autosomal clade, and its affinity to East Asian populations, was well supported by multiple TreeMix models (Figs. 2, 6, 7; Supplemental Fig. S3), as well as 100% of the bootstrap replicates (Fig. 6). Thus, our results support the separation of Eastern Siberian lineage from other East Asian groups, and we date this separation event to ∼10 kya.
Figure 6.
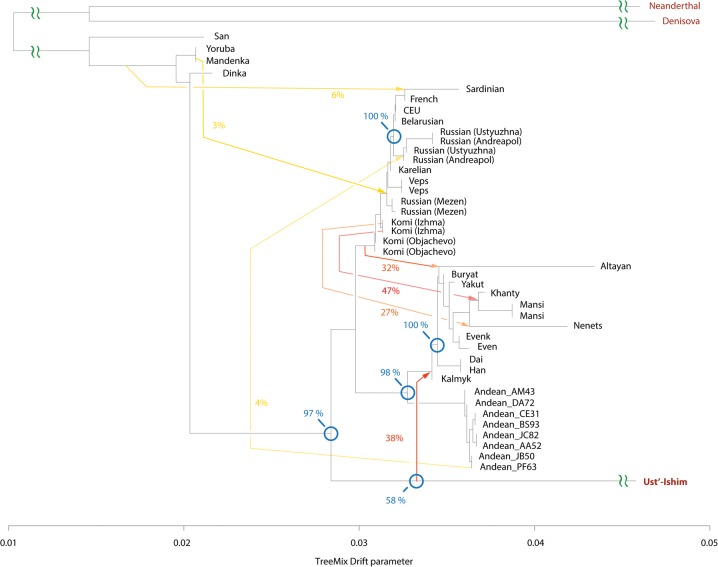
Genetic relationships of Ust’-Ishim and modern-day humans. TreeMix model with seven admixture events incorporates ancient Siberian Ust’-Ishim. Blue circles indicate branching events that were investigated using 100 bootstraps, and percentages of trees supporting the branch point are shown. Residuals are shown in Supplemental Figure S14.
Figure 7.
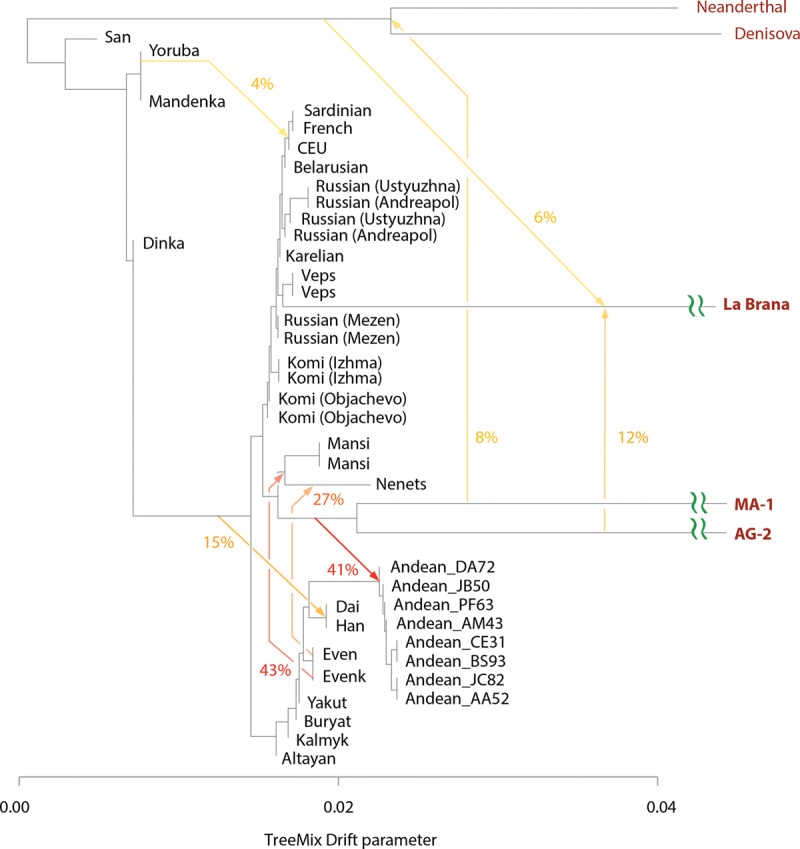
Genetic relationships with ancient North Eurasians MA-1 and AG-2. Autosomal TreeMix admixture graph that includes ancient 7000-yr old La Brana (Spain) and low-coverage genomes of ancient Siberians MA-1 and AG-2. Residual plot for this graph is shown in Supplemental Figure S16. TreeMix model indicated multiple admixture events: 41% admixture (95% CI: 36%–45%) from the ANE clade represented by MA-1 and AG-2 individuals into Native Americans represented by Andean Highlanders, 43% admixture (95% CI: 38%–47%) between population related to Evenk and a common ancestor of Western Siberians (Mansi and Nenets), and 26% (95% CI: 16%–37%) admixture between population related to Even and modern-day Nenets. Additionally, Western Siberians and ANE are grouped together, indicating their shared genetic history.
Kalmyks originated from northwestern China but later migrated to Southeastern Europe; thus, it would be illuminating to determine their genetic affinities to other populations, especially to other Siberian groups. To clarify the relationship of Kalmyks and their historical geographical neighbors in Siberia and East Asia, we performed additional D-statistics analysis. Both the Kalmyks and Altayans were moderately closer to other Eastern Siberians, including the Evens and Evenks (D-statistics = 0.13–0.146; Supplemental Figs. S7D,E, S8D,E), than to East Asians (D statistics = 0.11–0.125). However, unlike Kalmyks, Altayans additionally traced ∼37% (95% CI: 31%–43%) of their ancestry to another unknown population, which the model predicted to be related both to modern Europeans and Western Siberians (Fig. 2).
Links to ancient genomes
Genetic affinity between modern Siberians and Ust'-Ishim
To uncover ancient demographic events and reveal genetic links between present-day individuals and ancient ancestral populations, we compared 60 genomes from modern-day humans (Table 1; Supplemental Table S2) to 46 ancient genomes (Supplemental Table S3), including a 45,000-yr-old Siberian Ust’-Ishim individual (Fu et al. 2014), a 24,000-yr-old Siberian Mal'ta boy (MA-1), and a 17,000-yr-old Siberian individual (AG-2) from the Krasnoyarsk region (Raghavan et al. 2014).
Given that the bone from the Ust’-Ishim individual was found in Western Siberia, we reasoned that Ust’-Ishim might be related to modern Siberian populations. Indeed, this hypothesis was well supported by the TreeMix model (Fig. 6). We observed that the common ancestor of Siberians and East Asians traced 38% (95% CI: 28%–48%) of their ancestry to Ust’-Ishim's lineage (Fig. 6; Supplemental Fig. S14). In agreement with this, the D-statistics analysis (Fig. 5C; Supplemental Figs. S13C, S15) showed that Ust’-Ishim had higher genetic affinity with East Asians and Siberians, particularly Eastern Siberians, than with modern Europeans. This was also supported by the Y haplotype analysis. Previously, the ancient Siberian Ust’-Ishim (Fu et al. 2014) was thought to belong to the K2 Y-Chromosome clade, which is ancestral to haplogroup R (a Y-Chromosome clade extremely common in Europe), haplogroup Q (common among Native Americans and certain Siberians populations), haplogroup N (common in Siberia and Northeastern Europe), and haplogroup O (common in East Asia). However, we observed that Ust’-Ishim had a single derived SNP on Y-Chromosome specific to the NO branch (hg19 coordinate Chr Y 7,690,182) (Supplemental Fig. S12). This branch is associated with Siberians and some Northeastern European groups, as well as East Asians. Therefore, unlike previous claims, Ust’-Ishim's haplogroup most likely belongs to a more recent NO clade rather than to the more diverged K2 clade. Based on these lines of evidence, we conclude that Ust’-Ishim contributed more ancestry to the East Asian and Siberian populations than to modern Europeans or Native Americans.
Western Siberians are descendants of ANEs and Eastern Siberians
Our tree model grouped ANEs MA-1 and AG-2 with Western Siberians (Mansi and Nenets), suggesting a genetic link between ANEs and modern Western Siberians (Fig. 7). Furthermore, TreeMix estimated that 41% (95% CI: 36%–45%) of the ancestry of Andean Highlanders, the Native Americans, is attributable to the ANE lineage (Fig. 7; Supplemental Fig. S16). This is consistent with previous reports that Paleo-Americans trace ∼42% of their autosomal genome to an ancient Eurasian lineage related to MA-1 (Raghavan et al. 2014). We further tested these predictions using D-statistics by evaluating whether a modern individual shared significantly more derived alleles with MA-1 or AG-2 than with the East Asian Han individual (Fig. 5D; Supplemental Fig. S17A). Mansi, Khanty, Nenets, and Native Americans all had very strong ANE ancestry, demonstrated by their significant genetic affinities with MA-1 and AG-2. Therefore, Western Siberians share common ANE ancestry with Native Americans. The remaining ancestry of Western Siberians could be attributed to a population related to Eastern Siberians. The TreeMix model (Fig. 7) inferred that 43% of Mansi ancestry was derived from the admixture with a population related to Eastern Siberians Evenks and Evens, while 57% is attributable to the ANE ancestry. Therefore, genomes of Mansi people harbor significant ancestries from Siberian ANE people as well as Eastern Siberian populations in approximately equal proportions.
To examine Siberian-related ancestry among ancient Europeans, we analyzed SNP data from the Holocene Eastern European hunter-gatherers (Haak et al. 2015) from the Samara and Karelia regions in modern Russia and the Motala region in Sweden (6.6–8 kya), as well as more recent Bronze Age Yamnaya samples (4.7–5.3 kya). D-Statistics demonstrated strong admixtures between the Mansi and nearly all hunter-gatherers from Eastern Europe (Supplemental Fig. S21), particularly for the Samara and Karelia samples. Slightly weaker, but significant affinities were present between Eastern Siberian Even and Eastern European hunter-gatherers. As previously mentioned, the time of the split of Eastern and Western Siberian populations was estimated to be around 6.8–9.9 kya. The weaker affinity of Eastern Siberians and Eastern European hunter-gatherers could be attributed to the Eastern Siberian ancestry of Mansi, which permeated into ancient European populations through Mansi-related admixture. Yamnaya samples also showed statistically significant admixtures with Mansi and Evens, but slightly weaker compared with Samara HG, which indicates a dilution of Eastern hunter-gatherer ancestry component of Yamnaya culture samples. The ANE-related ancestry among Eastern European hunter-gatherers could thus be attributed to gene flows between population ancestral to Mansi and Eastern European hunter-gatherers that occurred before 8 kya, as demonstrated by the strong genetic affinity between Mansi and Samara and Karelia hunter-gatherers from 6–8 kya.
Apart from Eastern European hunter-gatherers, Siberians also shared part of their ancestry with Pitted Ware Culture (PWC) 5,000-yr-old hunter-gatherers from Sweden Ire8 and Ajv52 (Skoglund et al. 2012). Ajv52 and particularly Ire8 had strong admixture signals with Western Siberians Mansi (Fig. 5E; Supplemental Fig. S17B), suggesting that like the closely related Yamnaya culture, they had strong ANE ancestries likely due to admixtures with Mansi-related population.
Shared ancestry between Eastern Siberians and ancient human of the Saqqaq culture
Our data also showed evidence of Eastern Siberian ancestry within the genome of a 4000-yr-old Saqqaq individual (Rasmussen et al. 2010) from Greenland. The tree model with Saqqaq genome showed that Saqqaq was related to both East Asians and Eastern Siberians, and 12% of its ancestry was attributable to a population related to modern-day Evens (Supplemental Figs. S19, S20). The detected gene flow was strongly supported by the D-statistics (Supplemental Figs. S7F, S8F). In addition, 18% of American Andeans' ancestry came from Evens (Supplemental Fig. S19). This, together with the substantial gene flow from an ancestor of Evens and Evenks to Altayans, suggests that the signal from Evens to Saqqaq can be a result of ancient admixture happened between the ancestor of Siberians (Eastern Siberians) and early migrants to the Americas.
Discussion
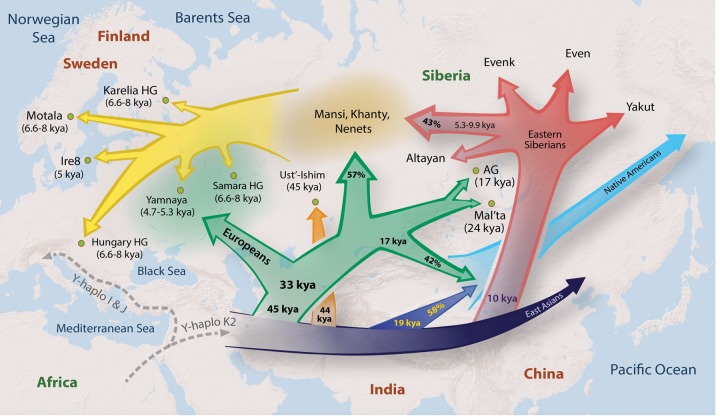
Genomes of indigenous Siberians harbor evidence of many important ancient events that shaped population history and peopling of Eurasia and the New World. Siberia is home to more than 30 ethnic groups that were thus far undersurveyed in population genetic studies. In this work, we examined the genetic history of several Siberian and Eastern European populations and analyzed their genetic links to ancient and modern populations. We summarized our findings in the form of a synthetic geographical dispersion model (Fig. 8), which describes how populations and genetic variation likely spread across Northern Eurasia.
Figure 8.
Geographical dispersion model. The approximate model of gene flows reflecting divergence of primary clades in Europe, East Asia, and Siberia with approximate divergence times based on Chromosome Y, MSMC, TreeMix, and D-statistics analyses. Percentages represent proportions of ancestry contributed to each lineage from other lineages. The common ancestors of Mansi, Khanty, and Nenets had derived 57% of their ancestry from an ANE population, related to MA-1, AG-2, and Native Americans and 43% from the admixture with a population related to Evens and Evenks. Native Americans trace 42% of their ancestry to ANE and 58% to a common ancestor of Eastern Siberians and East Asians. In the figure, 45 kya represents the split between Y-Chromosome clades QR and NO; 33 kya represents the split between Y-Chromosome Q and R clades and mtDNA N2 and W clades; 17 kya represents Mansi-Andean separation time; 44 kya represents the split of Ust’-Ishim's haplogroup from NO clade; 19 kya represents Han-Andean separation time; 10 kya represents Han-Eastern Siberian separation time; and 5.3–9.9 kya represents Evenk-Mansi MSMC separation time (6.8–9.9 kya) and expansion of N1c1 Y-haplogroup (5.3–7.1 kya). In this figure, Europeans represent a collective term for the following populations from this study: Komi, Veps, Karelians, Russians, and Belarussians.
Most of the modern and ancient Eurasian genomes sequenced and analyzed to date were collected across Northern and Western Europe, the Eurasian Steppe region, and Southern Siberia (Skoglund et al. 2012; Fu et al. 2014; Gamba et al. 2014; Lazaridis et al. 2014; Raghavan et al. 2014; Allentoft et al. 2015; Haak et al. 2015). In contrast, our samples were collected in the taiga region of Siberia and European Russia. We observed genetic affinities between modern and ancient individuals from these geographically distinct groups, hinting of large-scale population movements across Siberia, Asia, and Europe that shaped the genetic makeup of the Northeastern European and Siberian populations.
By using data from undersurveyed Siberian and Northeastern European populations, we both confirmed previously reported observations and showed important new links between modern and ancient inhabitants of Eurasia. We revealed that Eastern Siberian populations formed a distinct sublineage that separated from other East Asian populations ∼8.8–11.2 kya. We also identified admixture events between Siberians and Eastern European hunter-gatherers from Samara, Karelia, Hungary, and Sweden (from 6.6–8 kya); Yamnaya people (4.7–5.3 kya); and modern-day Northeastern Europeans, demonstrating genetic contribution of Siberian populations to ancient and modern populations in Eastern Europe.
Our analyses demonstrated that both East Asian and Siberian populations shared a significant amount of ancestry (38%) attributable to the ancient Siberian Ust’-Ishim individual, thus pointing to very ancient origins of indigenous Siberians. D-Statistics tests also suggested stronger affinity of Ust’-Ishim to both Eastern and Western Siberians (Fig. 5C; Supplemental Figs. S13C, S15) than to modern Europeans. Another line of evidence pointing to affinity of both East Asians and Eastern Siberians with Ust’-Ishim was provided by the Y-Chromosome haplogroup analysis (Fig. 4A; Supplemental Fig. S12). We showed that Ust’-Ishim's Y-Chromosome haplogroup belonged to NO clade, and its divergence from NO lineage predated the split of Y-Chromosome haplogroup N (particularly common in Siberia and Northeastern Europe) and haplogroup O (the most common Y-Chromosome haplogroup among Eastern and Southern Asian populations). These new relationships were uncovered largely due to the inclusion of the Western and Eastern Siberian genomes, including Mansi, Khanty, Nenets, Evens, Buryat, and other Siberian individuals. Therefore, the new findings described here provide a more accurate interpretation of patterns observed in the original Ust’-Ishim study (Fu et al. 2014).
A particularly surprising finding was the genetic link between 24,000-yr-old Siberian Mal'ta boy, Native Americans, and the Western Siberians Mansi, Khanty, and Nenets. This finding demonstrates a strong genetic link between Western Siberians and Native Americans due to their common ANE ancestry. We estimate that 57% of Western Siberian Mansi and Khanty ancestry was related to the ANE lineage represented by MA-1 and AG-2 ancient individuals. The other important finding was that the remaining 43% of Western Siberian ancestry was related to Eastern Siberian populations, suggesting admixtures between Eastern Siberian groups most related to Evens and Evenks and the common ancestors of Western Siberians (Fig. 2). This is particularly interesting in the context of ancestral relationships of modern Northeastern European populations. Lazaridis et al. (2014) modeled the ancestry of Eastern Europeans such as Mordovians, Finns, Russians, Saami, and Chuvashs but could not completely explain their genetic makeup by a mixture of three early European groups: the ancient northern Eurasians (represented by MA-1), the West European hunter-gatherers (represented by Loschbour), and the early European farmers (represented by Stuttgart). This was proposed to be due to a greater relatedness of Eastern Europeans to East Asians, compared with other European groups. However, our analyses of genetic relationships of Northeastern European populations such as Mezen Russians, Komi, Karelians, and Veps suggested that the unexplained ancestral components among modern Europeans likely resulted from their affinity with both Western and Eastern Siberian populations.
Our findings also showed that Western Siberians Mansi and Khanty and ancient Eastern European populations (Yamnaya and the PWC people) shared a significant amount of ANE-related ancestry. The genetic affinity of ancient Eastern Europeans with Eastern Siberians is relatively weaker (Fig. 5E; Supplemental Figs. S21, S24). Therefore, we propose that the Western Siberian admixture into Northeastern Europeans likely began before the Yamnaya culture period (5.3–4.7 kya), since the admixtures with Mansi are also very strong among hunter-gatherers from Northeastern Europe from 6.6–8 kya (Karelia HG, Samara HG, and to lesser degree Neolithic Motala HG and Hungary Gamba HG) (Supplemental Fig. S21F–Q) that predated the Yamnaya people. Mansi did not share the Late Upper Palaeolithic Caucasus HG ancestry with the Yamnaya people (Supplemental Fig. S25), suggesting that it is unlikely that Mansi have descended from the Yamnaya people. Therefore, Siberian admixtures into Northeastern Europe likely began prior to 6.6 kya, coinciding with the expansion of Y-Chromosome haplogroup N1c1 among Siberians and Northeastern Europeans (7.1–4.9 kya). Since haplogroup N likely originated in Asia (Shi et al. 2013) and currently achieves its highest frequency among Siberian populations, its presence among Eastern Europeans likely reflects ancient gene flows from Siberia into Northeastern Europe.
Our results also provide insights for ongoing anthropological debates about the origin of indigenous populations in the Uralic region. Uralic people had been considered as mixed groups descended from the longtime admixture between Europeans and Asians. An alternative theory hypothesized that Uralic people formed a genetic lineage that was distinct from the European and Asian clades (Bunak 1956). This idea was based on extensive anthropological research on ethnic groups across Northern Uralic territories, where unusual anthropological complexes were observed (Cheboksarov and Trofimova 1941; Bunak 1956, 1965). To date, this hypothesis has not been rejected or confirmed. Our model of gene flows during the last 50,000 yr in Europe, East Asia, and Siberia (Fig. 8) provides support for Bunak's hypothesis since Western Siberians were associated with a distinct ancient lineage, possibly related to ANE people. At the same time, our models suggest a more complex scenario that included admixture with ancient Eastern Siberians who came into contact with proto Western Siberians ∼7–9 kya.
In summary, our work established ancient genetic links of Siberian, European, and East Asian populations across the last 45,000 yr. Although we understand that the picture of the characterized genomic relationships of populations both from Siberia and Eastern Europe is still sparse, we anticipate that the novel genetic links uncovered by our study will provide further basis for both genetic and linguistic studies of Siberian and Eastern European populations.
Methods
Whole-genome sequencing
We performed deep sequencing of 28 individuals, representing 14 ethnic groups from Siberia and Eastern Europe. To maximize the quality of the population data, we obtained DNA samples that are informative for deep population history of individuals from geographical locations traditionally occupied by the corresponding indigenous populations and without self-reported genetic admixture for at least three generations. Our samples cover major populations from Siberia and Eastern Europe, representing speakers of primary linguistic groups from these regions (Table 1; Fig. 1).
Blood samples were collected with informed consent under the IRB-equivalent approval from the Institute of Molecular Genetics, Russian Academy of Sciences. Samples were further de-identified and analyzed under IRB approval (HS-13-00594) from the University of Southern California. DNA was isolated from peripheral leukocytes according to standard techniques using proteinase K treatment and phenol–chloroform extraction (Milligan 1998). All DNA samples were sequenced on the Illumina platform (HiSeq and X10) to high-depth of at least 30× (based on uniquely mapped reads) with the average sequence coverage depth of 38×. All genomes were analyzed using the same set of computational tools (Novoalign and GATK) (McKenna et al. 2010) and filtering criteria. We used alignments with mapQ scores of 60 or greater for calling SNPs in all the analyses. The Ti/Tv ratios of these samples are listed in Supplemental Table S5. In addition, as not many genomic data sets from the two Western Siberian populations Mansi and Khanty were available, we genotyped samples from these two populations (45 and 37 individuals respectively) using high-density SNP microarrays to ascertain the population relationships and sample quality of whole-genome sequencing data.
Principal component analysis
To obtain a broad overview of the population genetic relationships, we performed PCA using PLINK (Purcell et al. 2007) and EIGENSOFT (Patterson et al. 2006; Price et al. 2006). We compared 892 present-day humans (The 1000 Genomes Project Consortium 2012; Li et al. 2008; Yunusbayev et al. 2012; Fedorova et al. 2013; Khrunin et al. 2013; Zhou et al. 2013; Raghavan et al. 2014) from 27 Asian, European, Siberian, and Native American populations using a common set of 137,639 autosomal SNP loci (Fig. 1B; Supplemental Fig. S2; Supplemental Table S1). This analysis included the 82 new samples from the Mansi (N = 45) and Khanty (N = 37) groups that were genotyped across 713,599 SNPs using Illumina microarrays.
Genomes from other studies
To examine the genetic relationships of Siberian and Eastern European populations relative to other populations in the world, we integrated publicly available raw sequencing data from 32 high-coverage modern genomes representing 18 populations (Supplemental Table S2; Wong et al. 2013, 2014; Zhou et al. 2013; Jeong et al. 2014; Prufer et al. 2014), ancient genomes (Supplemental Table S3), and variant calls from the two hominin genomes, the Neanderthal (Prufer et al. 2014) and Denisova individuals (Meyer et al. 2012) in our analysis. We sought to minimize potential biases stemming from the use of different sequencing platforms, different read mapping tools, different SNP calling tools, and downstream variant filters. Therefore, all genomes (except for the Denisova, Neanderthal, and genotyped samples) were reanalyzed starting from raw sequencing reads using the same set of tools, parameters, and filtering criteria as the other genomes in this study. The genotype quality and concordance with the original study are listed in Supplemental Table S4.
TreeMix
We constructed autosomal TreeMix (Pickrell and Pritchard 2012) admixture graphs using a set of 30,090,159 genome-wide autosomal SNPs. TreeMix models demographic scenarios in the form of a bifurcating tree, allowing for inferring admixture events between individuals and populations to provide insights into hidden demographic events of the past.
D-Statistics tests
To investigate the relationship between populations of interest and provide statistical support for the admixture events inferred by TreeMix, we performed D-statistics tests in the form of D (P1, P2, P3, O) using ADMIXTOOLS (Patterson et al. 2012) release 1.1. ADMIXTOOLS uses the following notation: D(W,X,Y,Z). Our parameters correspond to the ADMIXTOOLS parameters in the following way: O = W, P1 = Z, P2 = Y, P3 = X. In this test, the null hypothesis is that the tree topology (((P1, P2), P3), O) is correct and there is no gene flow between P3 and either P1 or P2, or any populations related to them. The D-statistics test can be used to evaluate if the data are inconsistent with the null hypothesis.
The MSMC analysis
To estimate separation time between populations, we ran MSMC (Schiffels and Durbin 2014) on either four or eight haplotypes; i.e., two haplotypes from each of the two populations or four haplotypes from each of the two populations. Five samples (French, Russian, Mansi, Evenki, and Han) were used as reference populations, and their separation times to other populations were computed. For each population analyzed, we reported the median divergence time estimate relative to each of the five reference populations. For the mutation rate and years per generation, we used 1.25 × 10⁻⁸ per bp per year and 30 yr as in Schiffels and Durbin (2014).
Analysis of SNV and haplogroup on the Y-Chromosome and mitochondrial DNA can be found in the Supplemental Materials and Supplemental Figures S10–S12.
Data access
All sequencing data from the individuals that were sequenced as part of this study have been submitted to the NCBI Sequence Read Archive (SRA; https://www.ncbi.nlm.nih.gov/sra/) under BioProject accession number PRJNA267856, and SNP calls from sequencing data from this study have been submitted to dbSNP under batch ID 1062637 (https://www.ncbi.nlm.nih.gov/projects/SNP/). Genotyping data from this study have been submitted to the NCBI Gene Expression Omnibus (GEO; https://www.ncbi.nlm.nih.gov/geo/) under accession number GSE70063.
Supplementary Material
Acknowledgments
We thank A. Sidow, J. Pickrell, C. Jeong, M. Rasmussen, P. Ralph, M. Ogneva, and E. Lam for the insightful discussions and advice on the data analysis; V. Rabinovich, D. Gerasimova, and R. Kuchin for their help with collecting Mansi and Khanty samples; M. Crawford, R. David, D. Van Den Berg, S. Tyndale, C. Nicolet, J. Herstein, J. Nguyen, P. Martinez, T. Michurina, G. Enikolopov, and Illumina for their help with DNA sequencing; Z. Albertyn and C. Hercus for their help with Novoalign; R. Ronen, V. Bafna, W.L. Ping, T.Y. Ying, and T. K. Yong for facilitating exchange of sequencing data; S. Kim and J. Genovese for legal support; and P. Thomas for insightful discussions. J.N. thanks the National Institutes of Health (grant R01 HG007089). S.L. thanks grants from the Russian Foundation for Basic Research (grant 13-04-00588) and the Programs “Molecular and Cell Biology” of the Russian Academy of Sciences. A.K. thanks grants from the Russian Foundation for Basic Research (grant 16-04-00635).
Footnotes
[Supplemental material is available for this article.]
Article published online before print. Article, supplemental material, and publication date are at http://www.genome.org/cgi/doi/10.1101/gr.202945.115.
References
- The 1000 Genomes Project Consortium. 2012. An integrated map of genetic variation from 1,092 human genomes. Nature 491: 56–65. [DOI] [PMC free article] [PubMed] [Google Scholar]
- Allentoft ME, Sikora M, Sjögren KG, Rasmussen S, Rasmussen M, Stenderup J, Damgaard PB, Schroeder H, Ahlström T, Vinner L, et al. 2015. Population genomics of Bronze Age Eurasia. Nature 522: 167–172. [DOI] [PubMed] [Google Scholar]
- Bunak VV. 1956. Human races and ways of their formation. Sov Ethnogr 1: 86–105 (in Russian). [Google Scholar]
- Bunak VV. 1965. Problems of the genesis of races. In The origin and ethnic history of Russian people (ed. Bunak VV), pp. 174–190. Nauka, Moscow (in Russian). [Google Scholar]
- Cheboksarov NN, Trofimova TA. 1941. Anthropological survey of Mansi. Short Reports of Institute of History of Material Culture 9: 28–36. [Google Scholar]
- Der Sarkissian C, Balanovsky O, Brandt G, Khartanovich V, Buzhilova A, Koshel S, Zaporozhchenko V, Gronenborn D, Moiseyev V, Kolpakov E, et al. 2013. Ancient DNA reveals prehistoric gene-flow from Siberia in the complex human population history of North East Europe. PLoS Genet 9: e1003296. [DOI] [PMC free article] [PubMed] [Google Scholar]
- Durand EY, Patterson N, Reich D, Slatkin M. 2011. Testing for ancient admixture between closely related populations. Mol Biol Evol 28: 2239–2252. [DOI] [PMC free article] [PubMed] [Google Scholar]
- Erdeniev UE. 1985. Kalmyks. Nauka, Moscow. [Google Scholar]
- Fedorova SA, Reidla M, Metspalu E, Metspalu M, Rootsi S, Tambets K, Trofimova N, Zhadanov SI, Hooshiar Kashani B, Olivieri A, et al. 2013. Autosomal and uniparental portraits of the native populations of Sakha (Yakutia): implications for the peopling of Northeast Eurasia. BMC Evol Biol 13: 127. [DOI] [PMC free article] [PubMed] [Google Scholar]
- Fu Q, Li H, Moorjani P, Jay F, Slepchenko SM, Bondarev AA, Johnson PL, Aximu-Petri A, Prufer K, de Filippo C, et al. 2014. Genome sequence of a 45,000-year-old modern human from western Siberia. Nature 514: 445–449. [DOI] [PMC free article] [PubMed] [Google Scholar]
- Gamba C, Jones ER, Teasdale MD, McLaughlin RL, Gonzalez-Fortes G, Mattiangeli V, Domboróczki L, Ko˝vári I, Pap I, Anders A, et al. 2014. Genome flux and stasis in a five millennium transect of European prehistory. Nat Commun 5: 5257. [DOI] [PMC free article] [PubMed] [Google Scholar]
- Haak W, Lazaridis I, Patterson N, Rohland N, Mallick S, Llamas B, Brandt G, Nordenfelt S, Harney E, Stewardson K, et al. 2015. Massive migration from the steppe was a source for Indo-European languages in Europe. Nature 522: 207–211. [DOI] [PMC free article] [PubMed] [Google Scholar]
- Hublin JJ. 2009. Out of Africa: modern human origins special feature: the origin of Neandertals. Proc Natl Acad Sci 106: 16022–16027. [DOI] [PMC free article] [PubMed] [Google Scholar]
- Hublin JJ. 2012. The earliest modern human colonization of Europe. Proc Natl Acad Sci 109: 13471–13472. [DOI] [PMC free article] [PubMed] [Google Scholar]
- The International HapMap 3 Consortium. 2010. Integrating common and rare genetic variation in diverse human populations. Nature 467: 52–58. [DOI] [PMC free article] [PubMed] [Google Scholar]
- International Society of Genetic Genealogy. 2014. Y-DNA Haplogroup Tree 2014, Version: 9.76, Date: 29 August 2014, http://www.isogg.org/tree/.
- Jeong C, Alkorta-Aranburu G, Basnyat B, Neupane M, Witonsky DB, Pritchard JK, Beall CM, Di Rienzo A. 2014. Admixture facilitates genetic adaptations to high altitude in Tibet. Nat Commun 5: 3281. [DOI] [PMC free article] [PubMed] [Google Scholar]
- Jones ER, Gonzalez-Fortes G, Connell S, Siska V, Eriksson A, Martiniano R, McLaughlin RL, Gallego Llorente M, Cassidy LM, Gamba C, et al. 2015. Upper Palaeolithic genomes reveal deep roots of modern Eurasians. Nat Commun 6: 8912. [DOI] [PMC free article] [PubMed] [Google Scholar]
- Khrunin AV, Khokhrin DV, Filippova IN, Esko T, Nelis M, Bebyakova NA, Bolotova NL, Klovins J, Nikitina-Zake L, Rehnstrom K, et al. 2013. A genome-wide analysis of populations from European Russia reveals a new pole of genetic diversity in northern Europe. PLoS One 8: e58552. [DOI] [PMC free article] [PubMed] [Google Scholar]
- Lappalainen T, Laitinen V, Salmela E, Andersen P, Huoponen K, Savontaus ML, Lahermo P. 2008. Migration waves to the Baltic Sea region. Ann Hum Genet 72(Pt 3): 337–348. [DOI] [PubMed] [Google Scholar]
- Lazaridis I, Patterson N, Mittnik A, Renaud G, Mallick S, Kirsanow K, Sudmant PH, Schraiber JG, Castellano S, Lipson M, et al. 2014. Ancient human genomes suggest three ancestral populations for present-day Europeans. Nature 513: 409–413. [DOI] [PMC free article] [PubMed] [Google Scholar]
- Li JZ, Absher DM, Tang H, Southwick AM, Casto AM, Ramachandran S, Cann HM, Barsh GS, Feldman M, Cavalli-Sforza LL, et al. 2008. Worldwide human relationships inferred from genome-wide patterns of variation. Science 319: 1100–1104. [DOI] [PubMed] [Google Scholar]
- Malyarchuk B, Derenko M, Grzybowski T, Lunkina A, Czarny J, Rychkov S, Morozova I, Denisova G, Miscicka-Sliwka D. 2004. Differentiation of mitochondrial DNA and Y chromosomes in Russian populations. Hum Biol 76: 877–900. [DOI] [PubMed] [Google Scholar]
- McKenna A, Hanna M, Banks E, Sivachenko A, Cibulskis K, Kernytsky A, Garimella K, Altshuler D, Gabriel S, Daly M, et al. 2010. The Genome Analysis Toolkit: a MapReduce framework for analyzing next-generation DNA sequencing data. Genome Res 20: 1297–1303. [DOI] [PMC free article] [PubMed] [Google Scholar]
- Meyer M, Kircher M, Gansauge MT, Li H, Racimo F, Mallick S, Schraiber JG, Jay F, Prufer K, de Filippo C, et al. 2012. A high-coverage genome sequence from an archaic Denisovan individual. Science 338: 222–226. [DOI] [PMC free article] [PubMed] [Google Scholar]
- Milligan BG. 1998. Total DNA isolation. In Molecular genetic analysis of populations (ed. Hoelzel AR), pp. 29–60. Oxford University Press, Oxford. [Google Scholar]
- Mirabal S, Regueiro M, Cadenas AM, Cavalli-Sforza LL, Underhill PA, Verbenko DA, Limborska SA, Herrera RJ. 2009. Y-Chromosome distribution within the geo-linguistic landscape of northwestern Russia. Eur J Hum Genet 17: 1260–1273. [DOI] [PMC free article] [PubMed] [Google Scholar]
- Patterson N, Price AL, Reich D. 2006. Population structure and eigenanalysis. PLoS Genet 2: e190. [DOI] [PMC free article] [PubMed] [Google Scholar]
- Patterson N, Moorjani P, Luo Y, Mallick S, Rohland N, Zhan Y, Genschoreck T, Webster T, Reich D. 2012. Ancient admixture in human history. Genetics 192: 1065–1093. [DOI] [PMC free article] [PubMed] [Google Scholar]
- Peoples of Russia. 1994. Encyclopaedia (ed. Tishkov VA), 479 pages. Bol'shaya Sovetskaya Entsyklopediya, Moscow (in Russian). [Google Scholar]
- Pickrell JK, Pritchard JK. 2012. Inference of population splits and mixtures from genome-wide allele frequency data. PLoS Genet 8: e1002967. [DOI] [PMC free article] [PubMed] [Google Scholar]
- Poznik GD, Henn BM, Yee MC, Sliwerska E, Euskirchen GM, Lin AA, Snyder M, Quintana-Murci L, Kidd JM, Underhill PA, et al. 2013. Sequencing Y chromosomes resolves discrepancy in time to common ancestor of males versus females. Science 341: 562–565. [DOI] [PMC free article] [PubMed] [Google Scholar]
- Price AL, Patterson NJ, Plenge RM, Weinblatt ME, Shadick NA, Reich D. 2006. Principal components analysis corrects for stratification in genome-wide association studies. Nat Genet 38: 904–909. [DOI] [PubMed] [Google Scholar]
- Prufer K, Racimo F, Patterson N, Jay F, Sankararaman S, Sawyer S, Heinze A, Renaud G, Sudmant PH, de Filippo C, et al. 2014. The complete genome sequence of a Neanderthal from the Altai Mountains. Nature 505: 43–49. [DOI] [PMC free article] [PubMed] [Google Scholar]
- Purcell S, Neale B, Todd-Brown K, Thomas L, Ferreira MA, Bender D, Maller J, Sklar P, de Bakker PI, Daly MJ, et al. 2007. PLINK: a tool set for whole-genome association and population-based linkage analyses. Am J Hum Genet 81: 559–575. [DOI] [PMC free article] [PubMed] [Google Scholar]
- Raghavan M, Skoglund P, Graf KE, Metspalu M, Albrechtsen A, Moltke I, Rasmussen S, Stafford TW Jr, Orlando L, Metspalu E, et al. 2014. Upper Palaeolithic Siberian genome reveals dual ancestry of Native Americans. Nature 505: 87–91. [DOI] [PMC free article] [PubMed] [Google Scholar]
- Rasmussen M, Li Y, Lindgreen S, Pedersen JS, Albrechtsen A, Moltke I, Metspalu M, Metspalu E, Kivisild T, Gupta R, et al. 2010. Ancient human genome sequence of an extinct Palaeo-Eskimo. Nature 463: 757–762. [DOI] [PMC free article] [PubMed] [Google Scholar]
- Schiffels S, Durbin R. 2014. Inferring human population size and separation history from multiple genome sequences. Nat Genet 46: 919–925. [DOI] [PMC free article] [PubMed] [Google Scholar]
- Shi H, Qi X, Zhong H, Peng Y, Zhang X, Ma RZ, Su B. 2013. Genetic evidence of an East Asian origin and paleolithic northward migration of Y-chromosome haplogroup N. PLoS One 8: e66102. [DOI] [PMC free article] [PubMed] [Google Scholar]
- Skoglund P, Malmstrom H, Raghavan M, Stora J, Hall P, Willerslev E, Gilbert MT, Gotherstrom A, Jakobsson M. 2012. Origins and genetic legacy of Neolithic farmers and hunter-gatherers in Europe. Science 336: 466–469. [DOI] [PubMed] [Google Scholar]
- Tamura K, Peterson D, Peterson N, Stecher G, Nei M, Kumar S. 2011. MEGA5: molecular evolutionary genetics analysis using maximum likelihood, evolutionary distance, and maximum parsimony methods. Mol Biol Evol 28: 2731–2739. [DOI] [PMC free article] [PubMed] [Google Scholar]
- Waters MR, Forman SL, Pierson JM. 1997. Diring Yuriakh: a lower paleolithic site in central Siberia. Science 275: 1281–1284. [DOI] [PubMed] [Google Scholar]
- Wong LP, Ong RT, Poh WT, Liu X, Chen P, Li R, Lam KK, Pillai NE, Sim KS, Xu H, et al. 2013. Deep whole-genome sequencing of 100 southeast Asian Malays. Am J Hum Genet 92: 52–66. [DOI] [PMC free article] [PubMed] [Google Scholar]
- Wong LP, Lai JK, Saw WY, Ong RT, Cheng AY, Pillai NE, Liu X, Xu W, Chen P, Foo JN, et al. 2014. Insights into the genetic structure and diversity of 38 South Asian Indians from deep whole-genome sequencing. PLoS Genet 10: e1004377. [DOI] [PMC free article] [PubMed] [Google Scholar]
- Yunusbayev B, Metspalu M, Jarve M, Kutuev I, Rootsi S, Metspalu E, Behar DM, Varendi K, Sahakyan H, Khusainova R, et al. 2012. The Caucasus as an asymmetric semipermeable barrier to ancient human migrations. Mol Biol Evol 29: 359–365. [DOI] [PubMed] [Google Scholar]
- Zhou D, Udpa N, Ronen R, Stobdan T, Liang J, Appenzeller O, Zhao HW, Yin Y, Du Y, Guo L, et al. 2013. Whole-genome sequencing uncovers the genetic basis of chronic mountain sickness in Andean highlanders. Am J Hum Genet 93: 452–462. [DOI] [PMC free article] [PubMed] [Google Scholar]
Associated Data
This section collects any data citations, data availability statements, or supplementary materials included in this article.


