

Abstract
Background
Considered the leading cause of developmental disabilities worldwide, fetal alcohol spectrum disorders (FASD) are a global health problem. To take advantage of neural plasticity, early identification of affected infants is critical. The cardiac orienting response (COR) has been shown to be sensitive to the effects of prenatal alcohol exposure and is an inexpensive, easy to administer assessment tool. The purpose of this study was to evaluate the CORs effectiveness in assessing individual risk of developmental delay.
Methods
As part of an ongoing longitudinal cohort study in Ukraine, live born infants of women with some to heavy amounts of alcohol consumption in pregnancy were recruited and compared to infants of women who consumed low or no alcohol. At 6 and 12-months, infants were evaluated with the Bayley Scales of Infant Development, II. CORs were also collected during a habituation/dishabituation learning paradigm. Using a supervised logistic regression classifier, we compared the predictive utility of the COR indices to that of the 6-month Bayley scores for identification of developmental delay based on 12-month Bayley scores. Heart rate collected at each second (Standard COR) was compared to key features (Key COR) extracted from the response.
Results
Negative predictive values (NPV) were 85% for Standard COR, 82% for Key COR, and 77% for the Bayley, and positive predictive value (PPV) were 66% for Standard COR, 62% for Key COR, and 43% for the Bayley.
Conclusions
Predictive analysis based on the COR resulted in better NPV and PPV than the 6-month Bayley score. As the resources required to obtain a Bayley score are substantially more than in a COR-based paradigm, the findings are suggestive of its utility as an early scalable screening tool based on the COR. Further work is needed to test its long term predictive accuracy.
Keywords: Fetal Alcohol Spectrum Disorders, Prenatal Alcohol, Cardiac Orienting, Pregnancy, Alcohol
Introduction
Early identification of infants who will demonstrate neurobehavioral deficits due to prenatal alcohol exposure (PAE) is of critical importance worldwide as early intervention has been demonstrated to improve various developmental outcomes (Reid et al. 2015) and may reduce lifetime health costs associated with PAE (Lupton et al. 2004) by taking advantage of early neural plasticity (Fox et al. 2010). The vast majority of children who have experienced this early brain insult lie somewhere on a continuum of disruption to their neurobehavioral functioning, and this range of outcomes has led to the use of the term fetal alcohol spectrum of disorders (FASD) to characterize the impact of PAE (Warren et al. 2011). Physical indicators associated with fetal alcohol syndrome (FAS), the most severe end of the spectrum, however, are often minimal or absent (Mattson et al. 1998; Kable, O'Connor, et al. 2015), and the alcohol-related functional deficits associated with PAE may not be readily identifiable for years (see Riley et al. 2011 for a comprehensive review). Estimates of the quantity of exposure to alcohol at given intervals during pregnancy have also not proven to be effective in delineating those who are in need of habilitative care as children with similar levels of PAE need not be similarly affected (Abel 1998; Goodlett et al. 2005). Children affected by PAE are often not recognized as affected by PAE until long after infancy, when the child begins to struggle with performing in school (Senturias 2014).
Early detection of prenatal alcohol-affected individuals has been limited by the lack of standardized tests that adequately capture important aspects of alcohol-related neurobehavioral impairments in the infancy and preschool periods (Jacobson 1998; Olson et al. 2007; Taylor et al. 2015). Assessment in infancy, when habilitative care may have its greatest impact (Fox et al. 2010), is particularly problematic in that standardized tests at this stage of development are recognized as only coarse predictors of later neurocognitive performance (Bornstein & Krasnegor 1989; Colombo 1993). As a result, early identification of neurodevelopmental impairment remains challenging.
In addition to the difficulties associated with the tools currently available for assessment of infants, there is a need to increase the scope and proliferation of the application of infant assessments in populations around the globe. However, to do this would require an inordinate amount of financial and physical resources. Such standardized developmental assessments require highly trained professionals and re-standardization every time an instrument is implemented within a different cultural context. The process of adapting measurement tools across cultural contexts on a wide spread basis, in addition to gathering and distributing the necessary personnel and materials, referred to as scaling up, has become an important parameter in making global health decisions about resources. To put it more succinctly, existing tools do not scale well. As recently noted by O'Connor et al. in reference to a South African population, many women lack access to physicians in their communities and among those available, there is a severe shortage of physicians trained in diagnosing FASD. She recommended training community workers to assist in the delivery of health care to compensate for these shortages (O'Connor et al. 2014). In recognition of the scarcity of clinical resources worldwide, to affect health on a global scale, special attention must be paid to the issue of a particular method's scalability or its associated benefits and costs.
Specialized infant assessment protocols utilized in the context of research environments have been more successful in capturing the early impact of PAE (Burden et al. 2005; Jacobson et al. 2008; Kable & Coles 2004). These tools focus on aspects of early classical conditioning using eye blink reflexes (Jacobson et al. 2008) or information processing skills (Burden et al. 2005; Kable & Coles 2004) that are known to be mediated by prefrontal cortical (PFC) activity. In older children, PFC has been found to be differentially impacted by PAE in that prenatal alcohol exposure effects persist after controlling for the impact on whole brain volume (Kable, O'Connor, et al. 2015). In addition, later executive functioning skills, which are mediated by PFC, have been found to be important in differentiating individuals who are prenatal alcohol-affected from typically developing children and those with other psychiatric conditions (Mattson et al. 2013).
Of the assessment procedures previously discussed, one of the methods involves eliciting cardiac orienting responses (CORs) (Sokolov et al. 2002). CORs are characterized by a specific pattern of heart rate deceleration in the presence of novel stimuli and are the result of the heart gating oxygen to the central nervous system. They can be elicited through electrical stimulation of the PFC in animal models (Powell et al. 1994), suggesting they may provide an early index of the efficiency of prefrontal cortical functioning to gate energy resources between basic attention and arousal systems. Behaviorally, these markers identify the infant's neurophysiological encoding and memory of environmental events with specific aspects of their attention behavior associated with specific features of the COR (Richards 1995).
CORs have previously been shown to be sensitive to the impact of PAE in human and animal models of exposure (Hunt & Phillips 2004; Kable & Coles 2004; Kable, Coles, et al. 2015; Morasch & Hunt 2009) and can be obtained inexpensively with limited examiner expertise required. They are relatively easy to collect on a large scale, as they are based completely on an electrocardiogram (ECG) recording during the presentation of an auditory or visual stimulus. Increasingly, affordable and accurate wearable sensors are continuously being developed to monitor ECG and are being advanced rapidly as important tools in the health field (Kang et al. 2015; Jeong et al. 2014; Kim et al. 2011). The development of these sensing platforms will only increase the ease with which CORs can be collected, making the COR an ideal candidate for efficient and effective screening in infancy when elicited during standard information processing paradigms (Colombo 1993).
While previous work has established that such CORs collected during information processing tasks are predictive of future developmental status (18-month Bayley scores (O'Connor 1980) and 5 year Stanford-Binet IQs (O'Connor et al. 1984)) and are sensitive to the impact of PAE on human infants (Kable & Coles 2004; Kable, Coles, et al. 2015) previous work with these responses has focused primarily on group-level comparisons rather than developing these tools for application to individuals. Previous methods of screening for individual risk have focused on school-aged children impacted by heavy prenatal alcohol exposure (Mattson et al. 2010; Mattson et al. 2013) but the results are only applicable to children who are 5 years of age and older.
Our interest is in the development of a concise early screening tool aimed at providing medical practitioners with an accessible method for managing risks associated with PAE as early as possible and on a global scale. The goal of this early screening tool is not necessarily for diagnostic purposes, but rather to identify infants at risk who could then be further investigated by appropriate clinical assessment to identify the individual's habilitative care needs. Developing such an early screening tool would not only aid in identifying prenatal alcohol-affected individuals earlier in life, but could potentially also increase the impact of the limited medical infrastructure available in resource-poor settings and in disadvantaged populations. This would allow for more resources within these settings to be devoted to providing targeted interventions to those infants who are identified as being high-risk rather than attempting to provide care to all alcohol-exposed infants.
In what follows, we explore the development and testing of an individual predictive model of prenatal alcohol-related neurobehavioral impairment in infancy based on a COR habituation/dishabituation paradigm using a sample of children enrolled in a prospective cohort study conducted in Ukraine. Specifically, we examine how well one can predict developmental delay on the Bayley Scales of Infant Development II (BSID-II) (Bayley 1993) exam at 12-months, comparing combinations of visual and auditory CORs obtained at 6-months with and without maternal prenatal alcohol exposure information included in the modeling. Additionally, we contrast these models of prediction to a reference point: those obtained from using 6-month developmental performance on the BSID-II as a predictor of 12-month developmental performance on the same test.
Materials and Methods
As part of the Collaborative Initiative on Fetal Alcohol Spectrum Disorders (CIFASD), a longitudinal cohort study of pregnant women who reported no to low alcohol consumption prenatally or some to heavy amounts of alcohol during pregnancy was conducted in Ukraine between 2008 and 2015. At one of the study sites, the offspring of a subset of these women were evaluated at 6 and 12-months of age with a habituation/dishabituation learning paradigm using visual and auditory stimuli and measurement of the COR. In each paradigm, baseline heart rate (HR) was collected for 30 seconds prior to stimulus onset and by sampling HR for 12 seconds post-stimulus onset for each trial. These same infants were also evaluated using the BSID-II at 6 and 12-months of age.
Recruitment and Interview Procedures
Between April of 2008 and August of 2012, women were screened for enrollment into the parent study based on their alcohol intake. A trained nurse interviewer screened all women for alcohol use during pregnancy at the first prenatal appointment. The women who were asked to participate in the some to heavy PAE group reported at least one or more of the following during the month around conception or in the most recent month: (a) weekly heavy episodic or binge drinking (5 or more), (b) five or more episodes of 3-4 standard drinks, or (c) 10 episodes of 1-2 standard drinks. The comparison or no to low PAE group screening criteria was defined as having all three of the following: (a) no binge episodes, (b) minimal (<2 drinks on 1 occasion) or no alcohol in the month around conception, and (c) no continued drinking in pregnancy. For each some to heavy PAE woman enrolled, a comparison woman who met the no to low PAE criteria was also sought, with a 1:1 recruitment ratio. All women agreeing to enroll gave written informed consent, and all women were given information about the risks of alcohol consumption during pregnancy.
A structured interview was conducted with all participants at enrollment and again in the third trimester. The interview asked about demographics, lifestyle, and substance use in pregnancy, including maternal and paternal alcohol and tobacco consumption. Day-by-day alcohol quantity and type consumed in the week around conception and in the two weeks before enrollment was assessed using a timeline follow-back procedure. Ounces of absolute alcohol per day (ozAA/day) and per drinking day (ozAA/drinking day) at each time point were computed from the amount, type, and frequency of alcohol intake reported by the mother resulting in four summary measures of prenatal alcohol exposure. The ozAA/drinking day variables were used to capture episodic or binge drinking behaviors.
The study was approved by the Institutional Review Boards at the University of California San Diego, La Jolla, CA, USA, and the Lviv National Medical University, Lviv, Ukraine.
Infant Neurophysiology Assessment
Mothers and infants were seen again at the study site for assessment when their infants were approximately 6 and 12-months of age. Visual and auditory stimuli were presented using a fixed-trial habituation/dishabituation paradigm to elicit CORs in infants that were approximately 6-months of age. Habituation trials involved repeated presentation of a stimulus, allowing for the assessment of initial stimulus encoding. In dishabituation trials, a similar but different stimulus was presented to determine if the infant could differentiate the novel stimulus, allowing for an assessment of memory of the initial stimulus. Mothers were allowed to passively observe the testing procedure. All stimuli were digitized via the STIM stimulus presentation software; the Physiology System software performed the data collection, and the IBI Analysis System software performed the conversion to heart rate. All of these packages are available from the James Long Company.
The standard auditory stimuli consisted of alternating 400-Hz and 1000-Hz pure tones presented contiguously for 2 seconds (2-s) each with a 5-ms controlled linear rise and fall time for each tone. The novel auditory stimulus consisted of alternating 700-Hz and 1000-Hz pure tones. The standard visual stimuli consisted of chromatic Caucasian faces of a baby, while the novel visual stimulus was that of a woman. The standard stimulus was presented for a total of 12-s followed by an inter-stimulus interval of 12-s until 10 repetitions were completed. The novel stimulus was then presented under similar conditions (12-s with 12-s ISI) for five trials. The total duration of the habituation/dishabituation procedure was approximately 12 minutes for each stimulus type.
Cardiac responses to the stimuli were monitored throughout the session using an ECG amplifier connected to a data acquisition computer that was triggered by the stimulus presentation software. A 30-s baseline period was collected prior to initial stimulus onset. Infant state after each presentation of stimulus was rated, with data collected during state 1: Deep Sleep or state 7: Vigorous Crying being excluded from analysis. The first three trials of the habituation and dishabituation trials were used for analysis as significant diminution of the COR occurs by the fourth trial of exposure (Kable & Coles 2004; O'Connor 1980).
Infant Standardized Developmental Assessment
In this study, a Russian translation of the BSID-II was selected as it is a well standardized assessment tool that currently is more reliable than the third edition (Moore et al. 2012). Measuring both psychomotor and mental development, it provides two standardized scores: a Psychomotor Development Index (PDI) and a Mental Development Index (MDI). Ukrainian child psychologists, who were trained and supervised by the authors, were blinded to the mothers’ group status and administered the 30 to 45 minute examination. Children were tested individually in a private office while seated in their caregiver's laps. Norms based on a standardized United States census sample provided by the manufacturer of the test were used to convert raw scores to standardized scores as no norms were available for the Ukrainian population.
Data Collection and Handling
All relevant infant neurophysiological, neurobehavioral, and maternal interview data were collected and stored at the testing site in Ukraine. These data were then transmitted electronically to Emory University, Atlanta, Georgia and the University of California San Diego, La Jolla, California for storage and analysis.
Data Analysis
The analysis was framed as a classification problem, where the population of infants was represented as belonging to two different classes, delayed and normal. This designation reflected whether or not an infant was delayed at 12-months, as measured by the BSID-II: MDI score. For our analysis, we defined delayed as a scaled score of less than or equal to 85, which is consistent with the test developers’ designation for mild developmental delay (Bayley 1993) and is a threshold (1 standard deviation below the mean) often used for identifying infants and toddlers in need of early interventions services (McManus et al. 2014). To assess the predictive utility of the 6-month COR, an infant's COR was represented by a grouping of features. In general, these features were either the averaged HR in a given second post-stimulus onset or the results of key features of the COR determined by specific calculations of the HR relative to stimulus onset.
As the purpose of this analysis was to explore the development of an individual predictive model for later impairment built on scalable features, we established different groupings of features allowing us to compare our classification performance across different feature groups, including non-scalable measures of maternal drinking patterns. This allowed us to assess the potential tradeoffs associated with using only scalable features. In addition, we also analyzed the performance of the 6-month BSID-II as a predictor of 12-month BSID-II performance, providing an altogether separate method for comparison, and serving as a baseline or reference point against which we evaluated performance of our predictive models.
Feature Groupings
Table 1 outlines the three groupings of features used in our analysis, the first two of which were considered scalable as they were completely determined by a COR. The first group highlighted in blue is the Standard COR, and consists of the HR obtained at one second intervals during the habituation and dishabituation trials the 6-month COR across both auditory and visual paradigms which is then averaged over three separate trials.
Table 1.
Feature groupings table, explaining the different groupings of features used in classification.
| Standard OR | Key-Features OR | Maternal Drinking | |||
|---|---|---|---|---|---|
| Average Habituation (Audio) | Average habituation time series for an audio stimulus, averaged over 3 trials | Average Trough | Average heart rate during 2-7 post-stimulus onset | Drinks per Day at Conception | Absolute ounces of alcohol per day at time of conception |
| Average Dishabituation (Audio) | Average dishabituation time series for an audio stimulus, averaged over 3 trials | Post-STIM Latency | Time point where response reaches 2 BPM below post-stimulus onset | Drinks per Drinking Day at Conception | Absolute ounces of alcohol per drinking day at time of conception |
| Average Habituation (Visual) | Average habituation time series for a visual stimulus, averaged over 3 trials | Latency | Time point where response reaches 2 BPM below baseline heart rate | 1st Trimester Drinks per Day | Absolute ounces of alcohol per day during the 1st trimester |
| Average Dishabituation (Visual) | Average dishabituation time series for a visual stimulus, averaged over 3 trials | Average Change | Difference between average heart rate and baseline heart rate | 1st Trimester Drinks per Drinking Day | Absolute ounces of alcohol per drinking day during the 1st trimester |
OR= Orienting Responses
The second group highlighted in orange is the Key-Features COR, and represents features extracted from the raw COR time series, all having been previously discussed in the literature as being physiologically meaningful (Kable, Coles, et al. 2015). These features were calculated from the Standard COR, and represent clinically relevant summary statistics of the COR. The average trough was calculated as the average value during the interval between 2 and 7-s post-stimulus onset. This interval typically includes the peak deceleration in heart rate in response to the stimulus, and provides an index of sustained attention to the stimuli with more deceleration in HR indicating greater interest. Latency of the COR is the time point where the response reaches 2 beats per minute below the baseline heart reate, and Post-STIM Latency is the time point where the response reaches 2 beats per minute below post-stimulus onset. Finally, the average change in HR was computed by subtracting the average HR during the trough period from the average baseline HR. Also included in both Standard and Key-Features COR feature groups, was a baseline HR (not shown in table) to normalize for individual differences (Manning & Dubois 1962).
To assess the comparable effectiveness of these scalable features, a third feature group was included, highlighted in yellow, which included indices of maternal drinking habits. This group was composed of the four alcohol consumption variables described above and represented maternal alcohol consumption at the time of conception and in the most recent two weeks prior to initial enrollment into the study. Included in all feature groups above was the infant's adjusted gestational age at delivery (not shown in table).
In addition to the three feature groupings described above, two additional groups were formed by including indices of maternal drinking with either the Standard or Key-Features CORs, allowing us to see how much would be lost in only using scalable features as compared to a feature group composed of both scalable and non-scalable features. To build the predictive model, a supervised, weighted logistic regression model was fitted using the different feature groupings described above.
Synthetically Expanding the Training Set
As is common in machine learning in medical applications (Kononenko 2001), our dataset suffered from two problems: class imbalance, and small sample sizes. To address the class imbalance, we oversampled the minority (delayed) class using the widely used Synthetic Minority Over-sampling Technique (SMOTE) (Chawla & Bowyer 2002) which creates “synthetic” samples. Each additional synthetic sample was not directly obtained from a measured infant but instead was synthetically generated from samples that were the most representative of the delayed class. Traditionally, this technique is used in conjunction with under-sampling the majority (normal) class, but this was not done for this analysis due to our overall small sample sizes. In addition, the actual classifier used was “weighted,” ensuring additional emphasis was placed on the minority class.
To address the small sample sizes, techniques were used to prevent over-fitting and to de-correlate features in our representation. To prevent over-fitting, a logistic regression classifier was used with an L1 penalty, to encourage sparsity in the solution by penalizing model complexity (Bishop 2006). To prevent feature correlation as well as reduce feature dimension, correlation and further curb overfitting, we first applied a principle component analysis and then a linear discriminant analysis (Hastie et al. 2009). In addition, a 5-fold cross-fold validation was used after introducing the synthetic samples to ensure model robustness.
Classifier Performance Metrics
In the setting described above where we have small sample sizes and imbalanced classes, accuracy is no longer the best performance metric to use in assessing the strength of a prediction procedure. In our case, by simply always predicting “not delayed”, the prediction would be correct over 80% of the time. In these types of settings, more suitable performance metrics capture the classifier's trade-off between false positives (type I errors) and false negatives (type II errors). We assessed classifier performance using four measures:
-
(1)
A cross-validated Receiver Operating Characteristic (ROC) curve which captured how the model traded off between type-I and type-II errors.
-
(2)
An Area Under the Curve (AUC) score for each ROC curve which captured its “total coverage” in this space, where 1 (100%) was the maximum value. These were then averaged and an average AUC score was computed for the average ROC curve.
-
(3)
An average confusion matrix which showed the average true-negative, false-positive, false-negative, and true-positive counts. An appropriately labeled confusion matrix is shown in Figure 1.
-
(4)
The PPV and NPV were also calculated, where PPV represented the proportion of delayed infants that were actually true positives and NPV represented the proportion of not delayed infants that were actually true negatives.
Figure 1.

Labeled confusion matrix.
NVP= Negative Predictive Value; TN= True Negative; FN= False Negative; TP= True Positive; FP= False Positive
Of particular importance for our application was the NPV, as this specifies a model's ability to not misclassify delayed infants as normal, perhaps causing them to miss out on habilitative care as early as possible.
Results
The sample selected for this analysis consisted of infants who had at least completed both visual and/or audio COR paradigm at 6-months of age and a 12-month BSID-II exam. Out of the 228 infants for whom we had a 12-month Bayley score, 104 were excluded for not having also completed either the visual or auditory COR paradigm at 6-months. The population subsequently analyzed consisted of 124 infants who had completed both the visual and/or auditory COR paradigm at 6-months and a 12-month BSID-II exam, in effect collapsing across all groups in order to assess individual differences. Differential attrition was previously analyzed in this population (Coles et al. 2015). Characteristics of the final sample used for the analysis by infant 12-month BSID-II score category are shown in Table 2.
Table 2.
Maternal and infant characteristics of the sample by BSID-II score at 12-months of age, Ukraine 2008-2012. For the smoking status and education variables, frequencies (percentages) are given and p-values are reported from Fisher's Exact test; for all other variables, means (standard deviations) are given and p-values are from the Mann-Whitney U test.
| Bayley Score at 12-months | >85 (N=98) | <=85 (N=26) | p-value |
|---|---|---|---|
| Maternal age (years) - mean (SD) | 27.08 (5.38) | 24.54 (5.37) | 0.027* |
| Gestational age at enrollment (weeks) – mean (SD) | 18.58 (6.68) | 20.2484(4.89) | 0.107 |
| Gestational age delivery (weeks) – mean (SD) | 39.38 (1.69) | 40 (1.10) | 0.183 |
| Smoking status – n (%) | |||
| Never smoked | 57 (58.2) | 14 (53.8) | 0.878 |
| Past smoker (quit before pregnancy) | 10 (10.2) | 3 (11.5) | |
| Past smoker (quit after realized pregnant) | 19 (19.4) | 8 (30.8) | |
| Current smoker | 12 (12.2) | 1 (3.8) | |
| Education – n (%) | 4 (4.1) | 3 (11.5) | |
| <high school | 41 (41.8) | 17 (65.4) | 0.009** |
| high school | 53 (54.5) | 6 (23.1) | |
| some college or higher | |||
| Absolute ounces of alcohol per day at time of conception – mean (SD) | 0.30 (0.44) | 0.433 (0.72) | 0.690 |
| Absolute ounces of alcohol per drinking day at time of conception – mean (SD) | 0.88 (1.15) | 0.83 (1.09) | 0.906 |
| Absolute ounces of alcohol per day in 2 weeks prior to enrollment – mean (SD) | 0.01 (0.03) | 0.02 (0.04) | 0.106 |
| Absolute ounces of alcohol per drinking day in 2 weeks prior to enrollment – mean (SD) | 0.06 (0.21) | 0.16 (0.36) | 0.101 |
| Infant age at 6-month Bayley (months) – mean (SD) | 6.52 (1.10) | 6.90 (1.29) | 0.215 |
| Infant age at 12-month Bayley (months) – mean (SD) | 13.62 (2.14) | 13.30 (2.23) | 0.334 |
SD= Standard Deviation; One asterisk denotes p≤0.05; two asterisks denote p≤0.01.
6-Month Bayley
The left panel of Figure 2 shows the normalized histogram and kernel density estimates of BSIDII scores at 12-months for both delayed and not delayed populations. It is clear that relatively low counts skewed the estimate, and led to considerable overlap in the scores. The right panel shows a scatter plot at 6 and 12-months for both delayed and not delayed infants, overlaid with a confusion matrix, assessing the ability of the BSID-II at 6-months to predict performance at 12-months. The vertical line separates delayed from not delayed on the 6-month BSID-II, and the horizontal line separates delayed from not delayed on the 12-month BSID-II. This separates the scatter plot into four different labeled regions. Also overlaid are the actual counts for the analyzed population, from which a positive predictive value of 43% and negative predictive value of 77% were calculated, serving as a baseline for later comparison.
Figure 2.

Left – Normalized histogram of Bayley Scores at 12-months for Normal and Delayed infants with estimated distributions and actual counts overlaid. Right – Scatter plot of Bayley Scores at 6 and 12-months. Vertical line separates the Delayed from Normal on the 6-month Bayley. Horizontal line separates the Delayed from Normal on the 12-month Bayley. Also overlaid are the actual counts, from which Positive Predictive Value (PPV) and Negative Predictive Value (NPV) are calculated.
MDI= Mental Development Index; NVP= Negative Predictive Value; PPV= Positive Predictive Value
Cardiac Orienting Response
Figure 3 and Figure 4 show the various aspects of the 6-month COR in response to an auditory and visual stimulus respectively, for both normal and delayed infants. All graphs are shown with their respective standard errors. The top right panel shows the group averages across the three habituation trials. Although the overall deceleration in the delayed group was less, there is significant overlap between the distributions.
Figure 3.

6-Month Habituation COR (Audio). Left – Trials 1-3 for Normal infants. Middle: Trials 1-3 for Delayed infants. Right – Average habituation for Normal vs. Delayed infants.
COR= Cardiac Orienting Responses
Figure 4.

6-Month Dishabituation COR (Visual). Left – Trials 1-3 for Normal infants. Middle: Trials 1-3 for Delayed infants. Right – Average dishabituation for Normal vs. Delayed.
COR= Cardiac Orienting Responses
Classification Performance
Figure 5 provides a comparison of the performance of the first three feature groupings. The left panel shows the classifier's performance using the standard COR where the average habituation and dishabituation under visual and audio stimuli were used, with an average AUC score of 81%, a NPV of 85% and a PPV of 66%. The middle panel shows the classifier's performance using the Key-Features COR where the average trough, latency, post-stim latency, and average change features were extracted from the Standard OR, with an average AUC score of 81%, a NPV of 82% and a PPV of 62%. The right panel shows the classifier's performance using indices of maternal drinking, with an average AUC score of 68%, a NPV of 75% and a PPV of 49%.
Figure 5.

Visualizing classifier performance through ROC curves (top) and confusion matrix (bottom). Left– Classification using Standard OR. Middle – Classification using Key-Features OR. Right – Classification using indices of maternal drinking.
OR= Orienting Responses; ROC= Receiver Operating Characteristic
Figure 6 provides a comparison of the performance of the last two feature groups. The left panel shows the classifier's performance using the Standard COR in addition to indices of maternal drinking, with an average AUC score of 84%, a NPV of 87% and a PPV of 65%. The right panel shows the classifier's performance using the Key-Features COR in addition to indices of maternal drinking, with an average AUC score of 80%, a NPV of 80% and a PPV of 62%.
Figure 6.
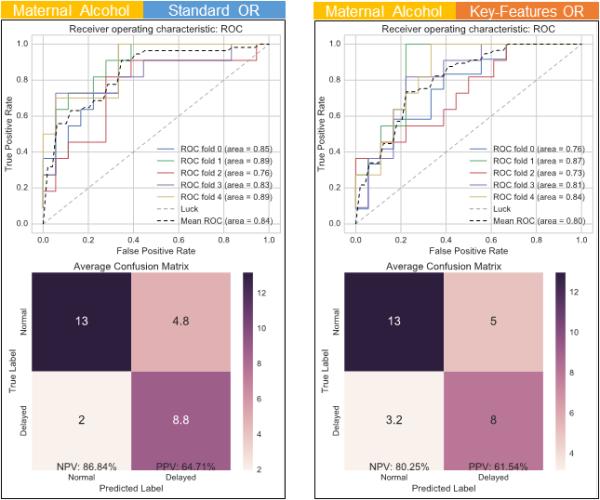
Comparing performance of different sets of feature groups. As above, ROC curves (top) and confusion matrix (bottom) are provided for each case. Left – Classification using both indices of maternal drinking and the Standard OR. Right – Classification using both indices of maternal drinking and the Key-Features OR.
OR= Orienting Responses; ROC= Receiver Operating Characteristic
Table 3 summarizes our classification results across different feature groups and shows an additional row for the 6-month BSID-II, bolding the highest scores.
Table 3.
Classification summary table, showing AUC (Area Under the Curve), NPV (Negative Predictive Value), and PPV (Positive Predictive Value) for each of the feature groupings described in Figure 3, with highest scores bolded.
| Feature Groupings | AUC | NPV | PPV |
|---|---|---|---|
| Standard OR | 81 | 85 | 66 |
| Key-Features OR | 81 | 82 | 62 |
| Maternal Alcohol | 68 | 75 | 49 |
| Maternal Alcohol + Standard OR | 84 | 87 | 65 |
| Maternal Alcohol + Key-Features OR | 80 | 80 | 62 |
| 6-Month Bayley | -- | 77 | 43 |
OR = Orienting Responses; AUC = Area Under the Curve); NPV= Negative Predictive Value; PPV= Positive Predictive Value
Discussion
Identifying prenatal alcohol-affected individuals as early as possible is an important public health priority. Doing so requires focusing on both improving identification in younger populations, as well as considering issues pertaining to method scalability. This study addressed this problem by assessing the performance of a 6-month COR paradigm as a predictor of 12-month developmental delay as measured on a widely accepted measure of developmental status. We evaluated the performance of classification methods trained on different groupings of scalable features built around the COR paradigm, comparing its effectiveness with and without the inclusion of non-scalable features indicative of maternal prenatal drinking habits.
Predictive analysis based solely on the COR resulted in good NPV but poor PPV. The levels obtained by both models of the COR exceeded levels obtained by the 6-month BSID-II MDI score alone, which only had NPV in the fair range and PPV in the poor or failed range. As the resources required to generate a BSID-II MDI score are considerably more than those required in a COR-based paradigm and the predictive utility was improved with COR, these results suggest that the COR paradigm may be a more efficient method of identifying individuals with neurodevelopmental impairment.
Comparison of the Standard COR to the Key-Features COR in which the latter served as a summary measure, being composed of features previously shown to be sensitive to prenatal alcohol exposure, indicated comparable results with the Key-Features COR having slightly improved performance. As the Key-Features COR is a essentially a function of the Standard COR in that is is extracted from it, it allows us to use much less information to represent an infant. A concern would be that such models might come at a large cost in terms of prediction but our results indicated that this is not the case. The results support the various clinical interpretations of the COR previously used (Kable & Coles 2004), as well as suggests improved scalability, as comparable predictive performance was achieved with much less data.
Indices of maternal alcohol consumption were relatively poor at identifying infants who were mildly delayed at 12-months of age and when included in models using indices of the COR, only minor improvements in prediction were obtained. This suggests that simply identifying levels of maternal alcohol consumption will not be sufficient to adequately identify children with alcohol-related neurodevelopmental impairment. This result should not be surprising as a large portion of infants who are prenatally exposed to alcohol do not exhibit deficits and the reliability and validity of self-report of maternal alcohol consumption during pregnancy has problematic (Bax et al., 2015).
Much of the literature on the design and assessment of the usefulness of large-scale screening tools focus on assessing 1) the ease and cost of administration of the screening tool, 2) the benefit and cost of early intervention in the screened population, and 3) cost of follow-up testing (Maxim et al. 2014; Lin & Williamson 2012; Berwick 1985). Common to all is an attempt at assessing the various types of “cost”. For example, the material and bodily cost of intervening at a certain time vs. that of potentially “missing out” on that early opportunity. Critical to how one compares these various notions, are measures of performance such as PPV and NPV (Maxim et al. 2014). Above we have shown that a 6-month cardiac measure can do better than a 6-month developmental assessment score (BSID-II MDI). The most promising results of our analysis, however, shows that a COR-based paradigm can perform quite well at excluding infants from risk, as measured by its NPV: when someone is excluded from future risk (declared not at risk, or normal, at 6-months), there is a very high probability that the infant will indeed score in the normal range at 12-months.
We suggest that for the population of PAE infants, this is a very desirable property to have in this type of large scale risk stratification tool, where several follow up early interventions exist that are relatively “low-cost” and have potentially very high-reward by reducing life time healthcare costs and improving developmental outcomes. Using the COR to declare an infant at 6-months of age as being at risk for later delay would serve to trigger further follow-up testing and perhaps candidacy for traditional early intervention services and more novel interventions such as nutritional supplementation (Wozniak et al. 2015). In a screening paradigm intended to identify at-risk infants as young as possible, misclassifying an infant at 6-months as being at risk for later delay (a type I error, meaning the infant will subsequently test normal) comes at a much lower ultimate detriment to the infant than the opposite. In other words, a missed opportunity for early intervention can have a high adverse impact on an alcohol-affected child; whereas providing follow-up testing and interventions for those who screen false positive would be expected to have little to no negative effects for that child. Future work should focus on attempting to carefully elucidate and model the various notions of costs, attempting to create an “optimal” screening tool for a PAE population.
As our results are focused primarily on early and scalable identification, an immediate comparison can be made to the early work of O'Connor et al. (O'Connor 1980) where they used an auditory COR paradigm at 4 months to predict performance on an 18 month Bayley exam, examining differences between preterm and full term infants. While their findings were that female and not male responsiveness to novelty at 4 months was a strong predictor of 18-month mental performance, here we did not examine gender specific differences, instead collapsing across all groups to determine a robust characterization of later delay regardless of infant gender. In addition, our analysis used both auditory and visual stimuli and employed modern statistical analysis techniques, achieving better performance than using either one alone. Indeed, in many respects, this work can be considered a continuation and an extension of this early work.
Another ready-made comparison is the work of Mattson et al. in developing and testing a neurobehavioral profile of FASD (Mattson et al. 2010; Mattson & Riley 2011; Mattson et al. 2013). Their results in older children (from 6-12 years of age) yielded a classification accuracy of near 73% for both PAE and control groups and were based on the inclusion of many neuropsychological variables. In this study, we were able to show similar performance in much younger children, but were limited to predicting only their 12-month BSID-II MDI score. Our results are a natural first step towards developing screening tools comparable to those that Mattson developed for older children, but relevant for application in younger populations and on a larger scale.
Some limitations of the present work are the increased risk of over-fitting to the given population. Steps were taken to mitigate these effects, but future work will focus on improving the sample size, improving the underlying classification model, and testing its performance across different clinical populations, helping to ensure its ability to generalize. An additional possible weakness of this study is due to recruitment and retention issues in the original sample, which may have altered the sample in the retained population. As previously described (Coles 2015), greater percentages of women classified as high risk drinkers did not return for the follow-up portion of the study, suggesting that the sample was not a random representative sample of the original cohort, and the lack of representativeness may have some how attenuated our findings.
As the 12-month Bayley is a relatively coarse predictor of later performance and not the best outcome measure to evaluate the predicitive validity of the COR, the focus of future work should be to assess the long-term predictive validity of a COR paradigm across different measures of intellectual functioning obtained in the preschool school and school-age periods of development. Additionally, as CORs are not necessarily specific to PAE, it is important not to suggest that this will be a way of identifying that prenatal alcohol-exposure has occurred. Instead, it should be considered a way of identifying that there is neurodevelopmental impairment of which one potential cause is prenatal alcohol exposure.
The results described herein are indeed promising and suggestive of the usefulness of the COR as a concise and scalable early screening tool for identification of aspects of the neurobehavioral profile of fetal alcohol spectrum disorders that historically have been unobtainable until later in childhood. Further research is needed to refine and validate the long term predictive validity of the COR paradigm to determine if it is an appropriate tool to improve access to early intervention services for children negatively impacted by prenatal alcohol exposure.
Supplementary Material
Acknowledgements
This research was funded by support from NIH Research Grant #U01AA014835 and Diversity Supplement 3U01-AA014835-1251, funded by the National Institute on Alcohol Abuse and Alcoholism (NIAAA) and the NIH Office of Dietary Supplements (ODS) – Christina Chambers, PI. All cardiac orienting response (COR) work was done in conjunction with the Collaborative Initiative on Fetal Alcohol Spectrum Disorders (CIFASD), which is funded by grants from the National Institute on Alcohol Abuse and Alcoholism (NIAAA). Additional information about CIFASD can be found at www.cifasd.org. Additional support was provided by USDA Agricultural Research Service intramural projects (5306-51530-019- 00D). The USDA is an equal opportunity provider and employer. Finally, the authors would like to thank the Ukrainian families who participated in this research and the wonderful staff of the Rivne Oblast Medical Diagnostic Center and the OMNI-Net Center.
Footnotes
Conflict of interest statement: The authors declare that there are no conflicts of interest.
References
- Abel EL. Fetal Alcohol Abuse Syndrome. Plenum Press; New York: 1998. [Google Scholar]
- Bax AC, Geurts CD, Balachova TN. Improving Recognition of Children Affected by Prenatal Alcohol Exposure: Detection of Exposure in Pediatric Care. Curr. Dev. Disord. Reports. 2015;2:165–174. doi: 10.1007/s40474-015-0057-3. Available at: https://www.ncbi.nlm.nih.gov/pubmed/26317063. [DOI] [PMC free article] [PubMed] [Google Scholar]
- Bayley N. Bayley Scales of Infant Development. (2nd Ed.) 1993 [Google Scholar]
- Berwick DM. Screening in health fairs. A critical review of benefits, risks, and costs. JAMA : the journal of the American Medical Association. 1985;254(11):1492–1498. doi: 10.1001/jama.254.11.1492. [DOI] [PubMed] [Google Scholar]
- Bishop C. Pattern recognition and machine learning. 2006 Available at: http://www.library.wisc.edu/selectedtocs/bg0137.pdf.
- Bornstein MH, Krasnegor N. Stability and Continuity in Mental Development: Behavioral and Biological Perspectives. Psychology Press; Hillsdale, N.J.: 1989. [Google Scholar]
- Burden MJ, Jacobson SW, Jacobson JL. Relation of prenatal alcohol exposure to cognitive processing speed and efficiency in childhood. Alcoholism, clinical and experimental research. 2005;29(8):1473–83. doi: 10.1097/01.alc.0000175036.34076.a0. Available at: http://www.ncbi.nlm.nih.gov/pubmed/16131856. [DOI] [PubMed] [Google Scholar]
- Chawla N, Bowyer K. SMOTE: Synthetic Minority Over-sampling Technique Nitesh. Journal of Artificial Intelligence Research. 2002;16:321–357. Available at: http://arxiv.org/abs/1106.1813. [Google Scholar]
- Coles CD, Kable JA, Keen CL, Jones KL, Wertelecki W, Granovska IV, Pashtepa AO, Chambers CD. Dose and Timing of Prenatal Alcohol Exposure and Maternal Nutritional Supplements: Developmental Effects on 6-Month-Old Infants. Maternal and Child Health Journal. 2015 doi: 10.1007/s10995-015-1779-x. Available at: http://link.springer.com/10.1007/s10995-015-1779-x. [DOI] [PMC free article] [PubMed]
- Colombo J. Infant Cognition: Predicting Later Intellectual Functioning. Sage Publications; Newbury Park: 1993. [Google Scholar]
- Fox SE, Levitt P, Nelson C. a. How the timing and quality of early experiences influence the development of brain architecture. Child development. 2010;81(1):28–40. doi: 10.1111/j.1467-8624.2009.01380.x. Available at: http://www.ncbi.nlm.nih.gov/pubmed/20331653. [DOI] [PMC free article] [PubMed] [Google Scholar]
- Goodlett CR, Horn KH, Zhou FC. Alcohol teratogenesis: mechanisms of damage and strategies for intervention. Experimental biology and medicine (Maywood, N.J.) 2005;230(6):394–406. doi: 10.1177/15353702-0323006-07. Available at: http://www.ncbi.nlm.nih.gov/pubmed/15956769. [DOI] [PubMed] [Google Scholar]
- Hastie T, Tibshirani R, Friedman J. The Elements of Statistical Learning. Springer New York; New York, NY: 2009. Available at: http://link.springer.com/10.1007/978-0-387-84858-7. [Google Scholar]
- Hunt PS, Phillips JS. Postnatal binge ethanol exposure affects habituation of the cardiac orienting response to an olfactory stimulus in preweanling rats. Alcoholism: Clinical and Experimental Research. 2004;28(1):123–30. doi: 10.1097/01.ALC.0000108650.02216.1A. Available at: http://www.ncbi.nlm.nih.gov/pubmed/14745310. [DOI] [PubMed] [Google Scholar]
- Jacobson SW, Stanton ME, Molteno CD, Burden MJ, Fuller DS, Hoyme HE, Robinson LK, Khaole N, Jacobson JL. Impaired eyeblink conditioning in children with fetal alcohol syndrome. Alcoholism: Clinical and Experimental Research. 2008;32(2):365–72. doi: 10.1111/j.1530-0277.2007.00585.x. Available at: http://doi.wiley.com/10.1111/j.1530-0277.2007.00585.x. [DOI] [PubMed] [Google Scholar]
- Jacobson SW. Specificity of neurobehavioral outcomes associated with prenatal alcohol exposure. Alcoholism, clinical and experimental research. 1998;22(2):313–20. doi: 10.1111/j.1530-0277.1998.tb03654.x. Available at: http://www.ncbi.nlm.nih.gov/pubmed/9581634. [DOI] [PubMed] [Google Scholar]
- Jeong J-W, Kim MK, Cheng H, Yeo W-H, Huang X, Liu Y, Zhang Y, Huang Y, Rogers JA. Capacitive epidermal electronics for electrically safe, long-term electrophysiological measurements. Advanced healthcare materials. 2014;3(5):642–8. doi: 10.1002/adhm.201300334. Available at: http://www.ncbi.nlm.nih.gov/pubmed/24132942. [DOI] [PubMed] [Google Scholar]
- Kable JA, O'Connor MJ, Olson HC, Paley B, Mattson SN, Anderson SM, Riley EP. Neurobehavioral Disorder Associated with Prenatal Alcohol Exposure (ND-PAE): Proposed DSM-5 Diagnosis. Child psychiatry and human development. 2015;47(2):335–346. doi: 10.1007/s10578-015-0566-7. Available at: http://www.ncbi.nlm.nih.gov/pubmed/26202432. [DOI] [PubMed] [Google Scholar]
- Kable JA, Coles CD, Keen CL, Uriu-Adams JY, Jones KL, Yevtushok L, Kulikovsky Y, Wertelecki W, Pedersen TL, Chambers CD. The impact of micronutrient supplementation in alcohol-exposed pregnancies on information processing skills in Ukrainian infants. Alcohol. 2015;49(7):647–656. doi: 10.1016/j.alcohol.2015.08.005. Available at: http://linkinghub.elsevier.com/retrieve/pii/S0741832915202832. [DOI] [PMC free article] [PubMed] [Google Scholar]
- Kable JA, Coles CD. The Impact of Prenatal Alcohol Exposure on Neurophysiological Encoding of Environmental Events at Six Months. Alcoholism: Clinical and Experimental Research. 2004;28(3):489–496. doi: 10.1097/01.alc.0000117837.66107.64. Available at: http://doi.wiley.com/10.1097/01.ALC.0000117837.66107.64. [DOI] [PubMed] [Google Scholar]
- Kang DY, Kim Y-S, Ornelas G, Sinha M, Naidu K, Coleman TP. Scalable Microfabrication Procedures for Adhesive-Integrated Flexible and Stretchable Electronic Sensors. Sensors (Basel, Switzerland) 2015;15(9):23459–76. doi: 10.3390/s150923459. Available at: http://www.ncbi.nlm.nih.gov/pubmed/26389915. [DOI] [PMC free article] [PubMed] [Google Scholar]
- Kim D-H, Lu N, Ma R, Kim Y-S, Kim R-H, Wang S, Wu J, Won SM, Tao H, Islam A, Yu KJ, Kim T, Chowdhury R, Ying M, Xu L, Li M, Chung H-J, Keum H, McCormick M, Liu P, Zhang Y-W, Omenetto FG, Huang Y, Coleman T, Rogers JA. Epidermal electronics. Science (New York, N.Y.) 2011;333(6044):838–43. doi: 10.1126/science.1206157. Available at: http://www.ncbi.nlm.nih.gov/pubmed/21836009. [DOI] [PubMed] [Google Scholar]
- Kononenko I. Machine learning for medical diagnosis: History, state of the art and perspective. Artificial Intelligence in Medicine. 2001;23(1):89–109. doi: 10.1016/s0933-3657(01)00077-x. Available at: http://ovidsp.ovid.com/ovidweb.cgi?T=JS&PAGE=reference&D=emed5&NEWS=N&AN=2001260608. [DOI] [PubMed] [Google Scholar]
- Lin H-M, Williamson JM. Design Considerations for a Two-stage Study with a Continuous Outcome and a Rare Exposure. Journal of Biometrics & Biostatistics. 2012;03(04) Available at: http://www.omicsonline.org/2155-6180/2155-6180-3-144.digital/2155-6180-3-144.html. [Google Scholar]
- Lupton C, Burd L, Harwood R. Cost of fetal alcohol spectrum disorders. American journal of medical genetics. Part C, Seminars in medical genetics. 2004;127C(1):42–50. doi: 10.1002/ajmg.c.30015. Available at: http://www.ncbi.nlm.nih.gov/pubmed/15095471. [DOI] [PubMed] [Google Scholar]
- Manning WH, Dubois PH. Correlational Methods In Research On Human Learning. Perceptual and Motor Skills. 1962;15(2):287–321. Available at: http://www.amsciepub.com/doi/abs/10.2466/pms.1962.15.2.287. [Google Scholar]
- Mattson SN, Roesch SC, Glass L, Deweese BN, Coles CD, Kable JA, May PA, Kalberg WO, Sowell ER, Adnams CM, Jones KL, Riley EP. Further Development of a Neurobehavioral Profile of Fetal Alcohol Spectrum Disorders. Alcoholism: Clinical and Experimental Research. 2013;37(3):517–528. doi: 10.1111/j.1530-0277.2012.01952.x. Available at: http://doi.wiley.com/10.1111/j.1530-0277.2012.01952.x. [DOI] [PMC free article] [PubMed] [Google Scholar]
- Mattson SN, Riley EP, Gramling L, Delis DC, Jones KL. Neuropsychological comparison of alcohol-exposed children with or without physical features of fetal alcohol syndrome. Neuropsychology. 1998;12(1):146–153. doi: 10.1037//0894-4105.12.1.146. [DOI] [PubMed] [Google Scholar]
- Mattson SN, Roesch SC, Fagerlund A, Autti-Rämö I, Jones KL, May P. a., Adnams CM, Konovalova V, Riley EP, Collaborative Initiative on Fetal Alcohol Spectrum Disorders (CIFASD) Toward a neurobehavioral profile of fetal alcohol spectrum disorders. Alcoholism: Clinical and Experimental Research. 2010;34(9):1640–50. doi: 10.1111/j.1530-0277.2010.01250.x. Available at: http://www.ncbi.nlm.nih.gov/pubmed/20569243. [DOI] [PMC free article] [PubMed] [Google Scholar]
- Mattson SN, Riley EP. The quest for a neurobehavioral profile of heavy prenatal alcohol exposure. Alcohol research & health : the journal of the National Institute on Alcohol Abuse and Alcoholism. 2011;34(1):51–5. Available at: http://www.pubmedcentral.nih.gov/articlerender.fcgi?artid=3860545&tool=pmcentrez&r endertype=abstract. [PMC free article] [PubMed] [Google Scholar]
- Maxim DL, Niebo R, Utell MJ. Screening tests: a review with examples. Inhalation toxicology. 2014;26(13):811–28. doi: 10.3109/08958378.2014.955932. Available at: http://www.pubmedcentral.nih.gov/articlerender.fcgi?artid=4389712&tool=pmcentrez&rendertype=abstract. [DOI] [PMC free article] [PubMed] [Google Scholar]
- McManus BM, Magnusson D, Rosenberg S. Restricting state part C eligibility policy is associated with lower early intervention utilization. Maternal and child health journal. 2014;18(4):1031–7. doi: 10.1007/s10995-013-1332-8. Available at: http://www.ncbi.nlm.nih.gov/pubmed/23929559. [DOI] [PubMed] [Google Scholar]
- Moore T, Johnson S, Haider S, Hennessy E, Marlow N. Relationship between test scores using the second and third editions of the Bayley Scales in extremely preterm children. The Journal of pediatrics. 2012;160(4):553–8. doi: 10.1016/j.jpeds.2011.09.047. Available at: http://www.ncbi.nlm.nih.gov/pubmed/22048046. [DOI] [PubMed] [Google Scholar]
- Morasch KC, Hunt PS. Persistent deficits in heart rate response habituation following neonatal binge ethanol exposure. Alcoholism: Clinical and Experimental Research. 2009;33(9):1596–604. doi: 10.1111/j.1530-0277.2009.00991.x. Available at: http://www.ncbi.nlm.nih.gov/pubmed/19519718. [DOI] [PMC free article] [PubMed] [Google Scholar]
- O'Connor MJ. A comparison of preterm and full-term infants on auditory discrimination at four months and on Bayley Scales of Infant Development at eighteen months. Child development. 1980;51(1):81–8. Available at: http://www.ncbi.nlm.nih.gov/pubmed/7363752. [PubMed] [Google Scholar]
- O'Connor MJ, Rotheram-Borus MJ, Tomlinson M, Bill C, LeRoux IM, Stewart J. Screening for fetal alcohol spectrum disorders by nonmedical community workers. Journal of population therapeutics and clinical pharmacology = Journal de la thérapeutique des populations et de la pharamcologie clinique. 2014;21(3):e442–52. Available at: http://ovidsp.ovid.com/ovidweb.cgi?T=JS&PAGE=reference&D=prem&NEWS=N&AN=25658901. [PMC free article] [PubMed] [Google Scholar]
- O'Connor MJ, Cohen S, Parmelee AH. Infant auditory discrimination in preterm and full-term infants as a predictor of 5-year intelligence. Developmental Psychology. 1984;20(1):159–165. Available at: http://doi.apa.org/getdoi.cfm?doi=10.1037/0012-1649.20.1.159. [Google Scholar]
- Olson HC, Jirikowic T, Kartin D, Astley S. Responding to the Challenge of Early Intervention for Fetal Alcohol Spectrum Disorders. Infants & Young Children. 2007;20(2):172–189. Available at: http://content.wkhealth.com/linkback/openurl?sid=WKPTLP:landingpage&an=00001163-200704000-00009. [Google Scholar]
- Powell DA, Watsom K, Maxwell B. Involvement of subdivisions of the medial prefrontal cortex in learned cardiac adjustments in rabbits. Behavioral Neuroscience. 1994;108:294–307. doi: 10.1037//0735-7044.108.2.294. Available at: http://www.ncbi.nlm.nih.gov/pubmed/8037873. [DOI] [PubMed] [Google Scholar]
- Reid N, Dawe S, Shelton D, Harnett P, Warner J, Armstrong E, LeGros K, O'Callaghan F. Systematic Review of Fetal Alcohol Spectrum Disorder Interventions Across the Life Span. Alcoholism, clinical and experimental research. 2015;39(12):2283–95. doi: 10.1111/acer.12903. Available at: http://www.ncbi.nlm.nih.gov/pubmed/26578111. [DOI] [PubMed] [Google Scholar]
- Richards JE. Infant cognitive psychophysiology: Normal development and implications for abnormal developmental outcomes. Advances in Clinical Child Psychology. 1995;17:77–107. [Google Scholar]
- Riley EP, Infante MA, Warren KR. Fetal Alcohol Spectrum Disorders: An Overview. Neuropsychology Review. 2011;21(2):73–80. doi: 10.1007/s11065-011-9166-x. Available at: http://link.springer.com/10.1007/s11065-011-9166-x. [DOI] [PMC free article] [PubMed] [Google Scholar]
- Senturias YSN. Fetal alcohol spectrum disorders: an overview for pediatric and adolescent care providers. Current problems in pediatric and adolescent health care. 2014;44(4):74–81. doi: 10.1016/j.cppeds.2013.12.012. Available at: http://www.ncbi.nlm.nih.gov/pubmed/24810409. [DOI] [PubMed] [Google Scholar]
- Sokolov EN, Spinks JA, Näätänen R, Lyytinen H. The Orienting Response in Information Processing. 2002 Available at: http://books.google.com/books?id=ELBmEOoKX6cC&pgis=1.
- Taylor PA, Jacobson SW, van der Kouwe A, Molteno CD, Chen G, Wintermark P, Alhamud A, Jacobson JL, Meintjes EM. A DTI-based tractography study of effects on brain structure associated with prenatal alcohol exposure in newborns. Human brain mapping. 2015;36(1):170–86. doi: 10.1002/hbm.22620. Available at: http://www.ncbi.nlm.nih.gov/pubmed/25182535. [DOI] [PMC free article] [PubMed] [Google Scholar]
- Warren KR, Hewitt BG, Thomas JD. Fetal alcohol spectrum disorders: research challenges and opportunities. Alcohol research & health : the journal of the National Institute on Alcohol Abuse and Alcoholism. 2011;34(1):4–14. Available at: http://www.ncbi.nlm.nih.gov/pubmed/23580035. [PMC free article] [PubMed] [Google Scholar]
- Wozniak JR, Fuglestad AJ, Eckerle JK, Fink BA, Hoecker HL, Boys CJ, Radke JP, Kroupina MG, Miller NC, Brearley AM, Zeisel SH, Georgieff MK. Choline supplementation in children with fetal alcohol spectrum disorders: a randomized, double-blind, placebo-controlled trial. American Journal of Clinical Nutrition. 2015;102(5):1113–1125. doi: 10.3945/ajcn.114.099168. Available at: http://ajcn.nutrition.org/cgi/doi/10.3945/ajcn.114.099168. [DOI] [PMC free article] [PubMed] [Google Scholar]
Associated Data
This section collects any data citations, data availability statements, or supplementary materials included in this article.