Abstract
Mechanisms responsible for progression of nonalcoholic fatty liver disease (NAFLD) to steatohepatitis (NASH) remain poorly defined. To examine the potential contribution of adipose tissue to NAFLD progression, we performed a complete transcriptomic analysis using RNA sequencing (RNA-Seq) on intra-abdominal adipose tissue (IAT) from severely obese adolescents [Mage 16.9 ± 0.4 yr, body mass index (BMI) z-score 2.7 ± 0.1] undergoing bariatric surgery and liver biopsy categorized into three groups: no steatosis (normal, n = 8), steatosis only (n = 13), or NASH (n = 10) by liver histology. Age, body weight, and BMI did not differ among groups, but subjects with NASH were more insulin resistant (increased homeostatic model assessment/insulin resistance, P < 0.05 vs. other groups). RNA-Seq revealed 175 up- and 492 downregulated mRNA transcripts (≥±1.5-fold, false discovery rate <0.10) in IAT between NASH vs. Normal, with “mitochondrial dysfunction, P = 4.19E-7” being the top regulated canonical pathway identified by Ingenuity Pathway Analysis; only 19 mRNA transcripts were up- and 148 downregulated when comparing Steatosis vs. Normal, with suppression of “EIF2 signaling, P = 1.79E-27” being the top regulated pathway indicating increased cellular stress. A comparison of IAT between NASH vs. Steatosis found 515 up- and 175 downregulated genes, with “antigen presentation, P = 6.03E-18” being the top regulated canonical pathway and “inflammatory response” the top diseases and disorders function. Unique transcriptomic differences exist in IAT from severely obese adolescents with distinct stages of NAFLD, providing an important resource for identifying potential novel therapeutic targets for childhood NASH.
Keywords: RNA-Seq, childhood obesity, transcriptome, inflammation, visceral adipose tissue, gene expression
nonalcoholic fatty liver disease (NAFLD) is a progressive liver pathology brought on by sedentary lifestyle and overnutrition that ranges from simple hepatic steatosis to nonalcoholic steatohepatitis (NASH) and cirrhosis. Progression to NASH is the most rapidly increasing indication for liver transplantation in the United States (39) and is associated with increased liver-related, cardiovascular, and all-cause mortality (3). Particularly alarming is that the prevalence of NAFLD in adolescents mirrors that of adults, approaching 10% of the general population and over one-third of individuals with obesity (30). Strikingly, case-study reports indicate that adolescent NAFLD is progressive and the liver phenotype may advance to NASH with fibrosis or cirrhosis in adolescence or early adulthood (12, 20). In addition, a report by Feldstein et al. (7) found that the 20 yr survival rate free of liver transplant for children with NAFLD was ∼80% compared with 99% in the reference population. Unfortunately, mechanisms underlying the progression in NAFLD severity to NASH remain unclear, and even less is known about this progression in adolescents.
There is increasing evidence that adipocyte cross talk with liver may provide a mechanistic link with NAFLD phenotype (reviewed in Refs. 4, 26). Adipose-to-liver interaction may be particularly relevant to intra-abdominal adipose tissue (IAT) depots, as the IAT venous drainage terminates at the portal vein, leading to an increased hepatic exposure to cytokines and metabolites originating in the IAT compared with those more diluted in the larger volume systemic circulation. Indeed, in obese adults with NAFLD, nonesterified fatty acids (NEFA) from adipose tissue lipolysis contribute significantly to hepatic triacylglycerol (TAG) accumulation (6). Others have also related omental adipose tissue macrophage infiltration directly to the severity of hepatic fibro-inflammatory lesions (5). Insulin resistance was identified as an underlying factor in each of these studies (5, 6) and is well appreciated to be an underlying and causal factor in NASH etiology (23, 25, 28, 38). Though little is known regarding the contribution of IAT phenotype to NAFLD severity in adolescents, the nearly universal association between adolescent NAFLD, dyslipidemia, and insulin resistance (18, 31) suggests a likely link. Interestingly, physiological insulin resistance occurs during pubertal maturation (Tanner stages 2–4) (21), which, when considered on a background of obesity, may contribute to the alarming prevalence and progressiveness of NAFLD in adolescents.
The aim of the current investigation was to examine the relationship between the IAT transcriptome in obese adolescents undergoing bariatric surgery with staging of NAFLD severity based on biopsy-confirmed liver phenotype. We hypothesized that IAT transcriptomic differences would be apparent between subjects with normal liver (Normal), simple hepatic steatosis (Steatosis: hepatocellular lipid accumulation in the absence of inflammation and fibrosis), and NASH (steatosis, immune cell infiltration, fibrosis, ballooning degeneration).
METHODS
Study population.
The study population consisted of 31 adolescents undergoing bariatric surgery with mean age 16.9 ± 0.4 yr, mean body mass index (BMI) 52.7 ± 2.0 kg/m2, and BMI z-score 2.7 ± 0.1. This group was 80.6% female, 74.2% white, and non-Hispanic. Preoperative clinical data and blood samples were collected within 30 days of operation at in-person visits by trained study personnel using standardized methodology. Height and weight were measured by trained study personnel using standardized protocols. BMI was calculated as weight (kg)/height (m)2. Blood samples were collected in serum separator tubes and centrifuged to harvest sera, which were then frozen at −20°C prior to transfer to −80°C within 24 h.
Liver histology.
Liver biopsies were obtained per routine clinical protocol by core needle technique after induction of anesthesia and before the bariatric surgery procedure. Location of the needle biopsy (left or right lobe) was at the discretion of the surgical team. Liver biopsy specimens were stained with hematoxylin-eosin and Masson's trichrome stains, and reviewed and scored by an experienced hepatopathologist (L. Miles), masked to clinical characteristics of the patients, using the validated NASH Clinical Research Network scoring system (11). The NAFLD activity score (range 0–8) was calculated and fibrosis staged. Liver biopsies were further categorized as NASH based on the aggregate presence and degree of the individual histologic features of fatty liver disease (steatosis inflammation, ballooning degeneration, fibrosis) or as bland steatosis without inflammation (2). If there was no evidence of abnormal steatosis or NASH, the biopsy was designated as Normal.
Adipose tissue samples.
IAT specimens were collected from adolescents undergoing laparoscopic bariatric surgery for clinical treatment of severe obesity. Specimens were obtained from omentum, snap-frozen in liquid nitrogen within 2 min, and then transferred to −80°C storage within an hour. Adolescents provided informed consent, and caregivers provided informed written permission for their adolescent's participation in the Cincinnati Children's Institutional Review Board-approved Pediatric Obesity Tissue Repository protocol. All experimental procedures described herein were approved by the University of Missouri Institutional Review Board.
Serum measures.
Glucose, total cholesterol, NEFA, and triglycerides were measured from fasting serum samples with commercially available assays according to the manufacturer's guidelines. Serum cytokines were determined using human-specific multiplex cytokine/chemokine and adipokine immunoassays (EMD Millipore Milliplex, cat no. HCYTOMAG-60K and HADK1MAG-61K/HADK2MAG-61K; Billerica, MA) on a MAGPIX instrument (Luminex Technologies; Luminex, Austin, TX) according to the manufacturer's instructions.
Adipocyte sizing.
Hematoxylin and eosin-stained paraffin-fixed sections of IAT were used to determine adipocyte size. For quantification, serial sections were photographed (3–5 fields of view and 300–500 total adipocytes per subject) with an Olympus BX43 light microscope and Olympus SC 100 camera via the ×10 objective. Adipocyte cross-sectional area was obtained from perimeter tracings of all adipocytes within a field of view using ImageJ software [National Institutes of Health, (NIH) Bethesda, MD].
Adipose tissue RNA extraction.
RNA isolation was performed as previously reported (32). Briefly, 200 mg of tissue was used to isolate RNA with a modified QiAzol/Chloroform method. RNA purity and concentrations were determined with a NanoDrop 1000 spectrophotometer (Thermo Scientific). Samples were diluted to 100 ng/μl and sent to the University of Missouri-Columbia DNA Core for RNA sequencing preparation.
RNA sequencing.
RNA integrity for all samples was confirmed using a BioAnalyzer 2100 automated electrophoresis system (Bio-Rad, Hercules, CA) preceding cDNA library construction. RNA sequencing (RNA-Seq) preparation, including cDNA library construction, was carried out at the University of Missouri DNA Core following manufacturer's protocol using the Illumina TruSeq RNA sample preparation kit v2. Poly-A containing mRNA was isolated from 2 μg of total RNA, RNA fragmentation was carried out, and double-stranded cDNA was produced from fragmented RNA. Identifier adaptors were ligated to the ends for identification purposes. The final construct of each purified library was evaluated with the BioAnalyzer 2100 automated electrophoresis system, quantified, and diluted in accordance with Illumina's protocol for HiSeq 2000. RNA-Seq data acquisition was carried out at the University of Missouri DNA Core, and following this, adaptor sequences were trimmed. NextGENe v1.92 (SoftGenetics, State College, PA) was used, and the resulting sequences were aligned to the National Center for Biotechnology Information's (NCBI) human mRNA reference file.
RNA-Seq data analysis.
The decision making process for RNA-Seq data analysis was as follows. Within each condition, reads per million (RPM) means were calculated for each biological replicate (n = 6 normal, n = 8 steatosis, and n = 8 NASH). An initial filter was applied to the mean number of reads (RPM) to identify mRNAs for each condition that were greater than zero. Reads per kilobase per million reads (RPKM) mean values were then calculated for each mRNA in normal, steatosis, and NASH conditions. All transcript group means with a RPKM value < 2.0 were removed from further analyses. IAT RPKM values were subsequently used to generate differential gene expression patterns, and a t-test for Steatosis/Normal, NASH/Normal, and NASH/Steatosis fold-change values ≥± 1.5-fold was performed. Between-group differences were found to exist on per-gene basis between-groups after retaining all mRNAs with false discovery rates (FDR) < 0.10 as previously reported (10, 16, 17, 24, 32). Differentially expressed transcripts (both up- and downregulated) that met these thresholds were entered into Ingenuity Pathway Analysis (IPA; Ingenuity Systems, Redwood, CA) for examination of the top up- and downregulated genes and the corresponding top pathway networks. Additionally, the Gene Ontology (GO) Consortium database was used to generate transcript lists of relevant biological processes, cellular components, and molecular functions. DAVID bioinformatics resource 6.7 was used to further provide in-depth understanding of the biological, cellular, and molecular themes in our gene set (8a).
Quantitative RT-PCR.
The mRNA expression of a panel of genes identified as differentially expressed by RNA-Seq analysis were confirmed by quantitative (q)RT-PCR. cDNA library was synthesized using a commercially available kit (Promega). qRT-PCR was performed using an ABI 7500 Fast Sequence Detection System (Applied Biosystems, Carlsbad, CA) using Fast SYBR Green Master Mix (Applied Biosystems). Results were quantified by the ddCT method relative to the housekeeping gene GAPDH. Primer pairs are listed in Table 1.
Table 1.
Forward and reverse primer sequences for quantitative RT-PCR
| Forward | Reverse | |
|---|---|---|
| CD68 | ATGGCGGTGGAGTACAATGTGT | AGAATGATGCTCGAGTTGCTGC |
| LEP | ATTTCACACACGCAGTCAGTCTC | TCACGTTTCTGGAAGGCATAC |
| TGFB1 | AAATTGAGGGCTTTCGCCTTA | GAACCCGTTGATGTCCACTTG |
| IL1B | AACAGGCTGCTCTGGGATTCTCTT | TCATTTCACTGGCGAGCTCAGGTA |
| MCP1 | GCTCATAGCAGCCACCTTCATTC | GGACACTTGCTGCTGGTGATTC |
| CD206 | AAGGCGGTGACCTCACAAG | AAAGTCCAATTCCTCGATGGTG |
| CD86 | AGCACAGACACACGGATGAGT | TTCAGAGGAGCAGCACCAGAG |
| CD163 | AGCATGGAAGCGGTCTCTGTGATT | AGCTGACTCATTCCCACGACAAGA |
| LTB | ACTTCTCTGGTGACCTTG | TTCTGAAACCCAGTCCTC |
| SELL | CAAGAGAAGTATGAATGACCC | TCAGGTAGAAATCTTCCCAG |
| AZGP1 | ACAGAAATCACAGTCAATGG | TCCAAGTCTACTCAAGACAG |
| FCER2 | TGAAATCTCAGGACTTGGAG | TCTTTCCAGCAAATCTGAAG |
| CD209 | CAGCTCGTCGTAATCAAAAG | TTAGATCTGAAAGTCCCATCC |
| CASP8 | CTACAGGGTCATGCTCTATC | ATTTGGAGATTTCCTCTTGC |
| CA3 | AGATAGGACATGAGAATGGC | ATGGGTCAAACTTTGTGAAG |
| HADH | CATACCTCATGGAAGCAATC | TCAATGTCTTCTTTGGATGC |
| GAPDH | AACAGCCTCAAGATCAGCAA | CAGTCTGGGTGGCAGTGAT |
Statistical analysis.
With the exception of RNA-Seq analysis described above, all other analytical procedures were performed with SPSS 20.0 (IBM). A one-way ANOVA was used to determine if statistical significance (alpha level < 0.05) was present for subject characteristics, serum measures, and adipocyte area. When a main effect (P < 0.05) was observed, a Fisher's least significant difference post hoc test was used to identify individual group differences.
RESULTS
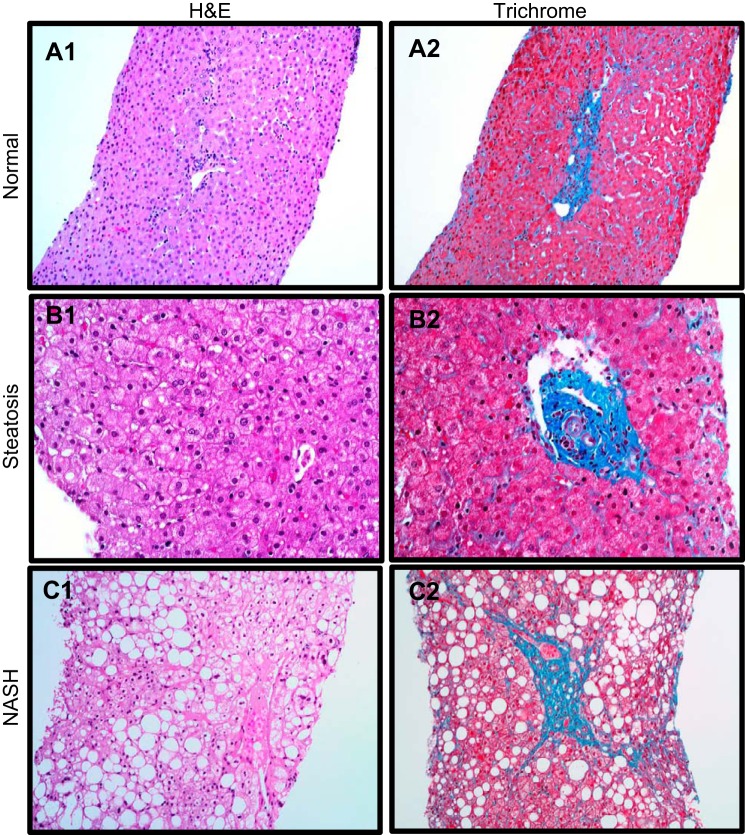
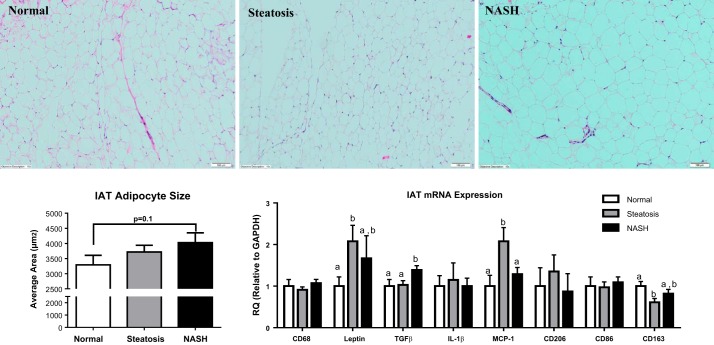
Specimens from 31 adolescents who underwent bariatric surgery were included in these analyses and were stratified based on histological determination of liver phenotype into to following groups: Normal (n = 8), Steatosis (n = 13), or NASH (n = 10) (Fig. 1). Subject characteristics are presented in Table 2. Age, body weight, and BMI did not differ among groups, but patients with NASH were more insulin resistant (increased homeostatic model assessment/insulin resistance, P < 0.05 vs. other groups) and were hypertriglyceridemic (Table 2). IAT from patients with NASH trended to have larger adipocytes (+25% vs. Normal, P = 0.1; Fig. 2). No differences in CD68+ crown-like structures were observed between groups (data not shown). Patients with Normal liver phenotype had elevated serum interleukin (IL) 1-β vs. Steatosis and NASH (Table 3). Leptin was elevated in Steatosis vs. the other groups (Table 3), whereas macrophage inflammatory protein (MIP)-1α and nerve growth factor (NGF) were elevated in NASH (Table 3). Finally, a trend was observed for adolescents with NASH to have higher serum TNF-α and MCP-1 and lower serum adiponectin (P = 0.1 vs. Normal, Table 3).
Fig. 1.
Representative liver hematoxylin and eosin (H&E) (left) and trichrome (right) from the pediatric patient cohort examined in the current investigation stratified into Normal (A1-2), Steatosis (B1-2), and NASH (C1-2) liver phenotypes.
Table 2.
Subject characteristics
| Normal (n = 8) | Steatosis (n = 13) | NASH (n = 10) | |
|---|---|---|---|
| Height, m | 1.61 ± 0.03 | 1.68 ± 0.02 | 1.67 ± 0.06 |
| Sex, M/F | 1/7 | 4/9 | 3/7 |
| Body weight, kg | 136.0 ± 10.5 | 148.0 ± 11.8 | 154.2 ± 13.6 |
| Age at surgery, yr | 16.4 ± 0.9 | 17.1 ± 0.6 | 17.2 ± 0.4 |
| BMI | 51.9 ± 2.9 | 51.8 ± 3.6 | 54.7 ± 3.4 |
| BMI z-score | 2.6 ± 0.1 | 2.7 ± 0.1 | 2.8 ± 0.1 |
| NAS | 0 ± 0.0a | 1.5 ± 0.2b | 4.7 ± 0.4c |
| Insulin, pg/ml | 164.2 ± 48.2 | 255.6 ± 42.0 | 566.9 ± 186.9 |
| Glucose, mg/dl | 78.9 ± 3.2 | 82.4 ± 2.6 | 95.4 ± 10.4 |
| HOMA-IR | 0.8 ± 0.3a | 1.3 ± 0.2a | 3.4 ± 1.0b |
| Total cholesterol, mg/dl | 121.3 ± 4.8 | 124.9 ± 3.5 | 126.7 ± 3.2 |
| NEFA, mmol/l | 0.36 ± 0.09 | 0.36 ± 0.06 | 0.44 ± 0.08 |
| Triglycerides, mg/dl | 57.3 ± 5.4a | 77.7 ± 8.7a,b | 109.7 ± 17.9b |
Values are means ± SE. Different letter superscripts are significantly different (P < 0.05).
BMI, body mass index; NAS, nonalcoholic fatty liver disease (NAFLD) activity score; HOMA-IR, homeostatic model assessment/insulin resistance; NEFA, nonesterified fatty acids.
Fig. 2.
Intra-abdominal adipose tissue (IAT) morphology and mRNA expression by quantitative RT-PCR. A: representative H&E stain of IAT from patients with normal liver, hepatic steatosis, and NASH. B: quantitative analysis of IAT adipocyte size representing the mean of 300–500 adipocytes per subject. C: mRNA expression in IAT of key inflammatory genes. Different letter superscripts denote significant differences (P < 0.05) between groups.
Table 3.
Serum cytokines and adipokines
| Cytokine | Serum Concentration | ANOVA | Pairwise t-Test (P value) | ||||
|---|---|---|---|---|---|---|---|
| Normal | Steatosis | NASH | P Value | Normal vs. Steatosis | Steatosis vs. NASH | Normal vs. NASH | |
| Adiponectin, ng/ml | 363.9 ± 61.4 | 316.7 ± 25.2 | 254.6 ± 30.7 | 0.18 | |||
| Adipsin, ng/ml | 123.3 ± 23.6 | 182.2 ± 60.2 | 271.0 ± 80.2 | 0.13 | |||
| EGF, pg/ml | 77.0 ± 23.1 | 75.2 ± 18.1 | 74.8 ± 18.0 | 0.99 | |||
| Eotaxin, pg/ml | 69.9 ± 19.2 | 79.3 ± 13.2 | 100.0 ± 21.2 | 0.51 | |||
| FGF2, pg/ml | 28.0 ± 4.3 | 23.2 ± 2.8 | 28.1 ± 3.5 | 0.48 | |||
| Fractalkine, pg/ml | 117.8 ± 60.4 | 23.5 ± 9.2 | 91.7 ± 51.4 | 0.19 | |||
| G-CSF, pg/ml | 62.3 ± 9.6 | 48.3 ± 7.3 | 58.2 ± 9.5 | 0.50 | |||
| GM-CSF, pg/ml | 11.7 ± 2.0 | 9.9 ± 1.1 | 11.3 ± 1.5 | 0.65 | |||
| GRO, pg/ml | 742.9 ± 161.5 | 521.9 ± 57.3 | 428.9 ± 43.6 | 0.06 | |||
| HGF, pg/ml | 672.0 ± 112.5 | 739.2 ± 128.6 | 544.3 ± 66.8 | 0.46 | |||
| IFN-a2, pg/ml | 14.4 ± 4.9 | 13.6 ± 3.2 | 16.5 ± 4.7 | 0.87 | |||
| IL-10, pg/ml | 13.8 ± 9.1 | 3.9 ± 1.9 | 8.9 ± 3.9 | 0.34 | |||
| IL-12P40, pg/ml | 35.9 ± 21.0 | 12.3 ± 6.6 | 32.3 ± 11.1 | 0.29 | |||
| IL-12P70, pg/ml | 5.6 ± 2.5 | 2.9 ± 0.9 | 2.5 ± 0.7 | 0.28 | |||
| IL-13, pg/ml | 7.1 ± 5.4 | 2.6 ± 1.5 | 14.1 ± 8.6 | 0.31 | |||
| IL-15, pg/ml | 5.0 ± 3.3 | 1.8 ± 1.2 | 4.2 ± 1.7 | 0.46 | |||
| IL-17a, pg/ml | 8.5 ± 3.6 | 2.8 ± 0.6 | 10.2 ± 6.1 | 0.33 | |||
| IL-1a, pg/ml | 27.6 ± 15.1 | 4.5 ± 2.1 | 40.5 ± 25.5 | 0.24 | |||
| IL-1β, pg/ml | 8.9 ± 4.4 | 0.7 ± 0.1 | 1.0 ± 0.2 | 0.01* | 0.006 | 0.921 | 0.012 |
| IL-1ra, pg/ml | 26.7 ± 4.6 | 32.2 ± 4.2 | 57.0 ± 12.9 | 0.06 | |||
| IL-2, pg/ml | 14.0 ± 8.1 | 1.8 ± 1.1 | 4.8 ± 2.1 | 0.08 | |||
| IL-3, pg/ml | 0.9 ± 0.5 | 0.3 ± 0.2 | 0.8 ± 0.4 | 0.38 | |||
| IL-4, pg/ml | 17.5 ± 11.8 | 4.0 ± 2.1 | 39.2 ± 22.4 | 0.18 | |||
| IL-5, pg/ml | 0.6 ± 0.2 | 0.5 ± 0.2 | 3.0 ± 2.3 | 0.34 | |||
| IL-6, pg/ml | 6.9 ± 2.6 | 3.3 ± 0.5 | 3.5 ± 0.8 | 0.14 | |||
| IL-7, pg/ml | 16.8 ± 11.6 | 4.8 ± 1.7 | 9.2 ± 3.0 | 0.30 | |||
| IL-8, pg/ml | 7.2 ± 1.3 | 4.8 ± 0.3 | 10.2 ± 1.7 | 0.01* | 0.155 | 0.002 | 0.097 |
| IL-9, pg/ml | 2.2 ± 1.2 | 1.1 ± 0.4 | 2.4 ± 0.9 | 0.39 | |||
| Interferon-γ, pg/ml | 18.5 ± 10.1 | 5.5 ± 1.6 | 51.7 ± 38.5 | 0.32 | |||
| IP-10, pg/ml | 282.0 ± 39.2 | 357.2 ± 25.9 | 410.0 ± 46.1 | 0.12 | |||
| Leptin, ng/ml | 73.4 ± 11.5a | 106.7 ± 8.9b | 74.0 ± 10.0a | 0.04* | 0.045 | 0.023 | 0.967 |
| Lipocalin, ng/ml | 10.3 ± 14.2 | 335.5 ± 81.0 | 21.6 ± 81.9 | 0.14 | |||
| MCP-1, pg/ml | 376.3 ± 60.0 | 444.3 ± 52.2 | 532.3 ± 40.3 | 0.16 | |||
| MCP-3, pg/ml | 15.2 ± 8.9 | 3.6 ± 1.2 | 27.4 ± 16.1 | 0.22 | |||
| MDC, pg/ml | 2032.1 ± 271.3 | 2309.8 ± 182.0 | 3079.8 ± 503.1 | 0.12 | |||
| MIP-1α, pg/ml | 5.5 ± 2.6 | 3.7 ± 1.0 | 532.3 ± 40.3 | 0.03* | 0.542 | 0.011 | 0.095 |
| MIP-1β, pg/ml | 31.0 ± 6.4 | 35.1 ± 3.4 | 54.9 ± 13.2 | 0.13 | |||
| NGF, pg/ml | 5.5 ± 1.1 | 4.8 ± 0.6 | 8.7 ± 1.2 | 0.02* | 0.613 | 0.005 | 0.045 |
| PAI-1, ng/ml | 27.6 ± 3.1 | 21.7 ± 2.3 | 23.7 ± 2.7 | 0.31 | |||
| Resistin, ng/ml | 26.8 ± 2.7 | 30.2 ± 2.3 | 29.7 ± 3.3 | 0.69 | |||
| TGF-α, pg/ml | 1.8 ± 0.4 | 3.1 ± 0.7 | 2.1 ± 0.5 | 0.27 | |||
| TNF-α, pg/ml | 9.6 ± 0.8 | 10.6 ± 1.1 | 15.4 ± 3.4 | 0.19 | |||
| TNF-β, pg/ml | 9.6 ± 0.8 | 2.5 ± 1.2 | 20.6 ± 13.5 | 0.28 | |||
| VEGF, pg/ml | 190.7 ± 60.9 | 75.4 ± 18.6 | 141.3 ± 33.8 | 0.10 | |||
Cytokines/adipokines with a significant ANOVA main effect (P < 0.05) were analyzed by a pairwise t-test with pooled SD to identify individual group differences.
Significant ANOVA main effect. Boldface indicates significant (P < 0.05) post hoc pairwise comparisons.
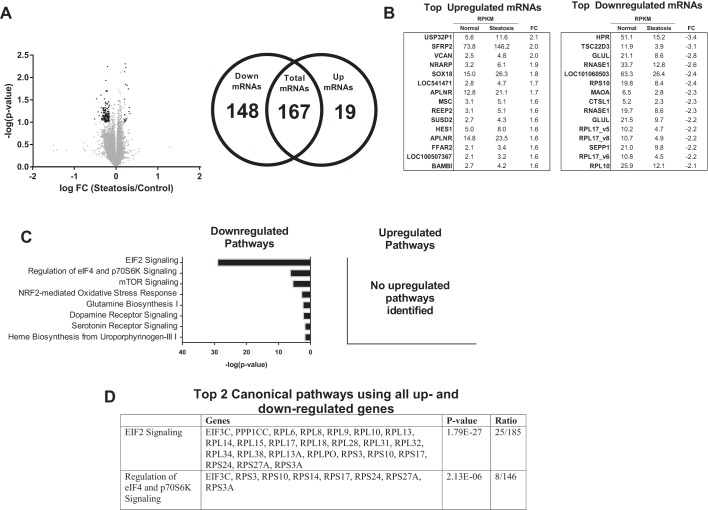
On average, 34.1 million total sequencing reads were recorded for each IAT sample, and the mean number of total reads that matched successfully to the NCBI human mRNA reference file was 25.4 million (∼75%). The IAT transcriptome was stratified based on liver phenotype. Differently expressed transcripts (≥ ± 1.5-fold, FDR < 0.10) were identified in Steatosis vs. Normal (167 total transcripts, 19 up- and 148 downregulated), NASH vs. Steatosis (690 total, 515 up- and 175 downregulated), and NASH vs. Normal (667 total, 175 up- and 492 downregulated). For convenience, the results of each comparison are presented separately (Figs. 3 and 4, Steatosis vs. Normal; Figs. 5 and 6, NASH vs. Steatosis; Figs. 7 and 8, NASH vs. Normal).
Fig. 3.
Transcriptome analysis of IAT in patients with Steatosis vs. Normal liver phenotype. A: 14,121 transcripts were initially identified [gray dots; reads per million (RPM) > 0, reads per kilobase per million reads (RPKM) > 2]; 167 were determined to be statistically differentially regulated [black dots; >1.5-fold difference, false discovery rate (FDR) < 0.10], of which 19 were significantly upregulated and 148 significantly downregulated. B: top 15 individual up- and downregulated transcripts between Normal and Steatosis. C: top 8 downregulated pathways identified by Ingenuity Pathway Analysis (IPA), no upregulated pathways were identified. D: top 2 canonical pathways identified by IPA using all up- and downregulated genes. FC, fold-change.
Fig. 4.
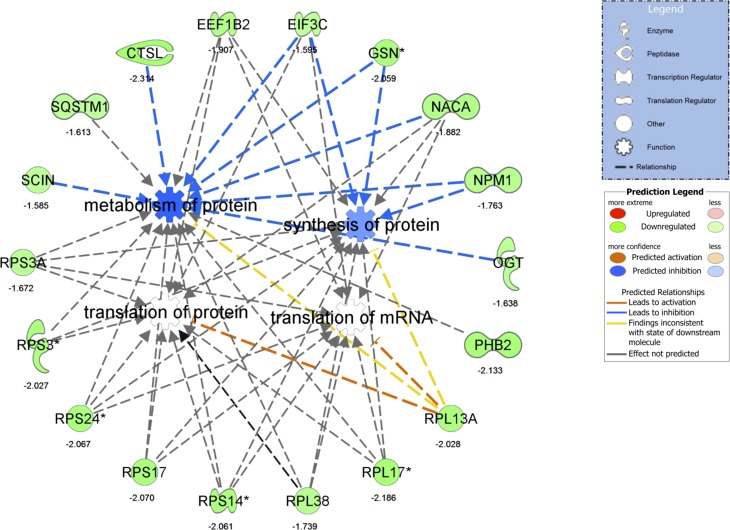
Differentially regulated IPA network in Steatosis vs. Normal of “translation of mRNA,” “translation of protein,” “synthesis of protein,” and “metabolism of protein.” For convenience, fold-change differences of individual genes are provided below each gene. *Multiple identifiers in the original dataset map to a single gene.
Fig. 5.
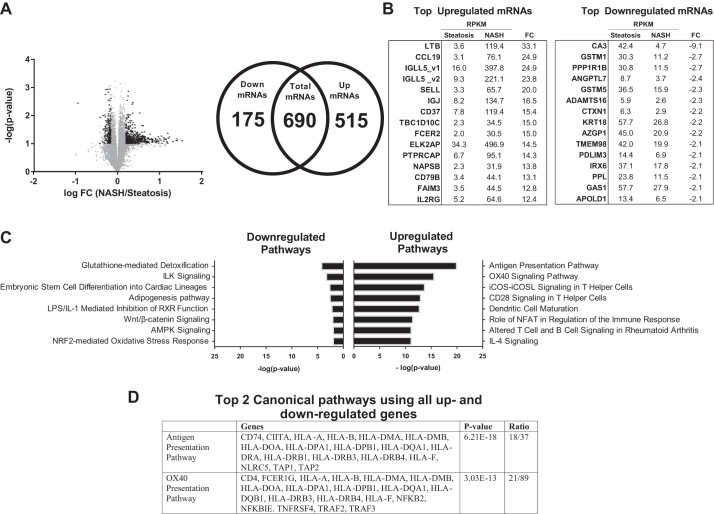
Transcriptome analysis of IAT in patients with nonalcoholic steatohepatitis (NASH) vs. Steatosis liver phenotype. A: 14,040 transcripts were initially identified (gray dots; RPM > 0, RPKM > 2); 690 were determined to be statistically differentially regulated (black dots; >1.5-fold difference, FDR < 0.10), of which 515 were significantly upregulated and 175 significantly downregulated. B: top 15 individual up- and downregulated transcripts between NASH and Steatosis. C: top 8 up- and downregulated pathways identified by IPA. D: top 2 canonical pathways identified by IPA using all up- and downregulated genes. FC, fold-change.
Fig. 6.
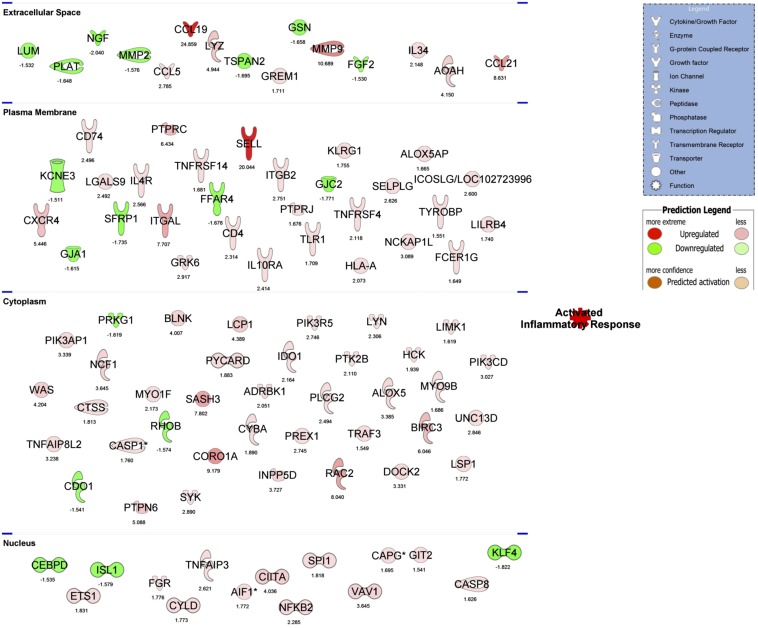
The top regulated IPA network of “activated inflammatory response” in NASH vs. Steatosis. For convenience, differentially regulated genes are separated by their subcellular component and FC differences are below each gene. *Multiple identifiers in the original dataset map to a single gene.
Fig. 7.
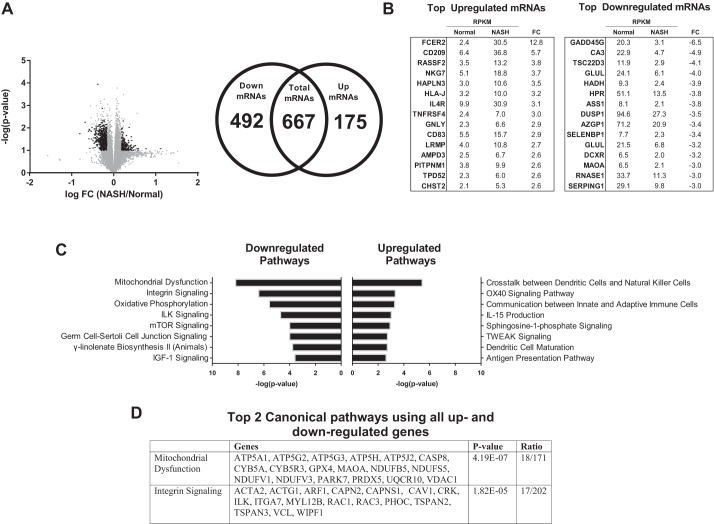
Transcriptome analysis of IAT in patients with NASH vs. Normal liver phenotype. A: 13,943 transcripts were initially identified (grey dots; RPM > 0, RPKM > 2). 667 were determined to be statistically differentially regulated (black dots; >1.5-fold difference, FDR < 0.10), of which 175 were significantly upregulated and 492 significantly downregulated. B: top 15 individual up- and downregulated transcripts between NASH and Normal. C: top 8 up- and downregulated pathways identified by IPA. D: top 2 canonical pathways identified by IPA using all up- and downregulated genes.
Fig. 8.
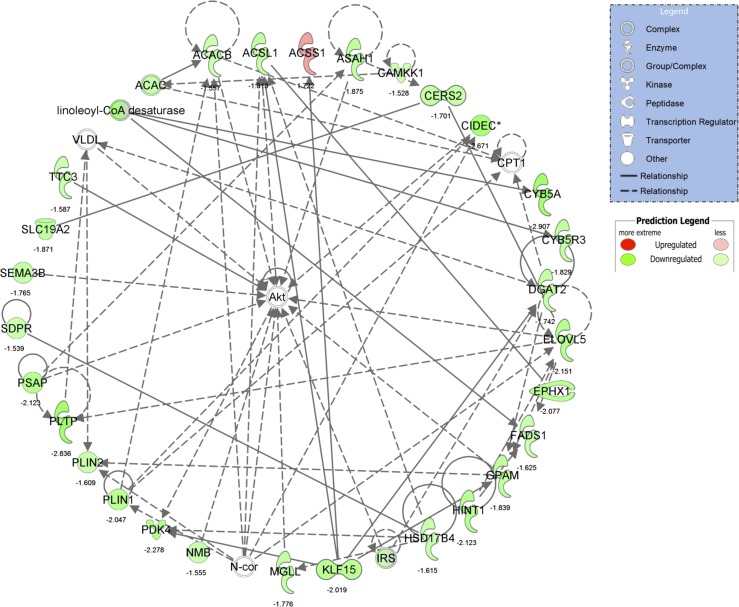
The top regulated IPA network identified in NASH vs Normal of “lipid metabolism, molecular transport, small molecule biochemistry.” For convenience, fold-change differences of individual genes are provided below each gene. *Multiple identifiers in the original dataset map to a single gene.
Steatosis vs. Normal.
A total of 167 differentially expressed transcripts (19 up- and 148 downregulated) were identified in IAT from Steatosis vs. Normal (Fig. 3A). The top up- and downregulated mRNAs are presented in Fig. 3B. IPA identified “EIF2 signaling” and “regulation of eIF4 and p70S6K signaling” as the top downregulated pathways (Fig. 3C) using all downregulated transcripts and the top regulated canonical pathways using all differentially regulated genes (Fig. 3D). No significantly upregulated pathways were identified (Fig. 3C). GO categories revealed a significant downregulation in “translational elongation,” “cytosolic ribosome,” and “structural constituent of ribosome” (Table 4). These processes were driven by significant reductions in expression of 21 ribosomal proteins, the eukaryotic translation initiation factor 3 subunit C (eIF3C), and protein phosphatase 1 catalytic subunit gamma isoform (PPICC). These transcriptional data are suggestive of a relative decrease in IAT protein synthesis in Steatosis vs. Normal (Fig. 4).
Table 4.
Top 3 DAVID GO functional annotation charts comparing each liver condition (Steatosis vs. Normal, NASH vs. Steatosis, NASH vs. Normal) constructed using all upregulated and downregulated mRNAs in IAT
| Upregulated GO Categories |
Downregulated GO Categories |
|||
|---|---|---|---|---|
| GO Category | Top Function | mRNAs Involved | Top Function | mRNAs Involved |
| Steatosis vs. Normal | ||||
| Biological process | none identified | No upregulated networks identified | translational elongation | EEF1B2, RPL28, RPL31, RPL34, RPL38, RPL6, RPL8, RPL9, RPS14, RPS24, RPLPO, RPL32 |
| Cellular component | none identified | No upregulated networks identified | cytosolic ribosome | RPL28, RPL31, RPL34, RPL38, RPL6, RPL8, RPS14, RPS24, RPLPO, RPL32 |
| Molecular function | none identified | No upregulated networks identified | structural constituent of ribosome | RPL28, RPL31, RPL34, RPL38, RPL6, RPL8, RPS14, RPS24, RPLPO, RPL32 |
| NASH vs. Steatosis | ||||
| Biological process | immune response | OAS2, CD209, CD79B, CD83, FAIM3, FCER1G, GPR183, GPSM3, GCH1, ARHGDIB, SP100, ST6GAL1, WAS, ACP5, APOBEC3F, CNPY3, CCL19, CCL21, CCL5, CXCR4, CITA, C1QA, CIQB, CIQC, CFP, GZMA, IGJ, ICOSLG, INPP5D, ITGAL, IRF8, IL18BP, LILRB1, LILRB4, LST1, LAT2, LY86, LCP1, LCP2, LTB, HLA-B, HLA-F, HLA-H, HLA-J, HLA-DMA, HLA-DOA, HLA-DRB1, NCF1, NCF4, SEMA4D, TLR1, TFEB, TAP1, TAP2, TNFRSF14, UNC13D, ETS1 | vasculature development | APOL D1, FGF2, ENPEP, HEY1, HAND2, MMP2, PRRX2, PLAT, RHOB, TCF21 |
| Cellular component | plasma membrane | ABCB7, ADAP1, BMF, CD163L1, CD209, CD33, CD37, CD52, CD53, CD79B, CD83, CDC42SE1, CDC42SE2, EVL, FAIM3, FCER1G, GPR160, GPR183, NCKAP1L, NFAM1, RAB7L1, RASGRP2, RASA4, ARHGAP4, ARHGEF1, SHKBP1, ADCY7, ADRBK1, AIF1, CSK, CASP8, CXCR4, CSF2RB, CYTH1, DGKD, DGKZ, DEF6, DOK3, EVI2B, FERMT3, FLOT2, FNBP1, GZMA, GNG7, ITGAL, ITGAX, ITGB2, ICAM3, IL10RA, KLB1, LILRB1, LILRB4, LAT2, LY86, LCP1, LAPTM5, HLA-B, HLA-F, HLA-H, HLA-J, HLA-DMA, HLA-DOA, HLA-DRB1, MYO7A, NKG7, NCF1, NCF4, OPN3, PREX1, PIK3AP1, PLEK, PLEKHA2, PLEKHO1, PARP14, PAQR8, PPP1R16B, PTPRCAP, PTPRE, PTPREJ, P2RY13, RGS19, SELL, SEMA4D, SPINT2, SIGLEC1, GFRA2, SLC2A1, SLC2A3, SYNGR2, SYT15, TLR1, TAP1, TAP2, TNFRSF14, TNFRSF 25, VAMP1 | extracellular region | ADAMTS1, ADAMTS16, SPARCL1, AZGP1, ANGPTL7, APOLD1, CPE, CXORF36, CRISPLD2, DEFB132, FGF2, FBLN1, GSN, GPC6, SSC5D, IGFBP5, LUM, MMP2, MXRA5, NGF, NTNG1, OLFML3, PLAT, SFRP1, SFRP2, SERPINI1 |
| Molecular function | GTPase regulator activity | ACAP1, ADAP1, CDC42SE1, FGD2, FGD3, GIT2, GPSM3, GMIP, IQGAP2, RASGRP2, RASA4, RIN3, ARHGDIB, ARHGAP15, ARHGAP25, ARHGAP27, ARHGAP30, ARHGAP4, ARHGAP9, ARHGEF1, ARHGEF18, SH3BP1, WAS, CYTH1, CYTH4, DOCK10, DOCK2, DOCK8, MYO9B, PREX1, RABEP2, SIPA1 | glutathione transferase activity | GSTM1, GSTM2, GSTM3, GSTM5 |
| NASH vs. Normal | ||||
| Biological process | dephosphorylation | ACP5, DUSP5, PTPN1, PTPRE, SYNJ1 | negative regulation of cell proliferation | ADAMTS1, CD164, KLF4, SMARCA2, AZGP1, ANG, ASPH, CDKN1C, CDKN2C, FGF2, GPNMB, IGFBP3, ILK, NME1, NUPR1, NPM1, PMP22, PPARG, PTPRF, TENC1 |
| Cellular component | intrinsic and integral to membrane | ATP13A2, CD163L1, CD209, CD83, GPR137, GM2A, LFNG, TAPBP, ACP5, APLNR, BTN3A1, BT3A2, C19ORF28, CYBASC3, CYB561D1, FAM118A, FLOT2, FFAR2, FZD8, BAMBI, ITPR1, ITM2C, ICAM2, LPCAT1, MP EG1, NKG7, NCF4, NUP50, PCNXL3, PPAPDC1B, PTDSS1, PLA2G4C, PCSK7, PPP1R16B, PTPRE, RNF122, SLC12A6, SLC2A3, SLC37A1, VAMP1 | cytosol | AGPAT2, PFKFB3, ARF1, BCAP31, BAD, PARK7, TPI1, ACACB, ACSL1, ADH1A, CTNNB1, CHMP2A, CYB5R3, EIF3B, EIF3C, EIF4H, FASN, GSN, GLUL, GPT, GPX4, GYG2, GUK1, HSPD1, HSP90AA1, HK2, LDHA, KARS, MOCS2, NME1, NFKBIA, NPM1, PRDX6, PPARG, RAC1, RPL31, RPL9, RPS20, RPS24, RPLPO, SQSTM1, SDPR, YWHAE, BANF1, SNRPD2, SORBS1, SDCBP, VCL |
| Molecular function | lipid binding | DGKZ, FFAR2, HIP1R, ITPR1, NCF4, PLA2G4C, PTGDS, PRKD2 | glycosaminoglycan, polysaccharide, and pattern binding | ADAMTS1, ANG, CYR61, DCN, FGF2, GPNMB, LTBP4, PRELP, VEGFA |
Gene Ontology (GO) biological process, cellular component, molecular function, and KEGG themes enriched in intra-abdominal adipose tissue (IAT) and were annotated by GO themes using FunNet. Underlined transcripts were downregulated.
NASH vs. Steatosis.
A total of 690 differentially expressed transcripts (515 up- and 175 downregulated) were identified in IAT from NASH vs. Steatosis (Fig. 5A). The top up- and downregulated mRNAs are presented in Fig. 5B. A hallmark feature of NASH is hepatic infiltration of proinflammatory immune cells. Interestingly, comparison of IAT in NASH vs. Steatosis revealed a significant increase in inflammatory processes in IAT as well. All eight significantly upregulated IPA pathways were related to proinflammatory signaling and immune-cell infiltration, while the top downregulated pathway was “glutathione-mediated detoxification” (Fig. 5C). “Antigen presentation” and “OX40 presentation” were identified as the top regulated canonical pathways, which included a number of major histocompatibility complex (human leukocyte antigen) genes and known proinflammatory intracellular mediators such as NFKB2, NFKBIE, and TNFRS4 (Figs. 5D and 6). In addition, GO identified “immune response” as the top upregulated biological process and “plasma membrane” as the top upregulated cellular component, which included an increase in many immune cell surface markers (e.g., CD163L1, CD209, ITGAL, ITGAX, etc.), adhesion molecules (ICAM3), and proinflammatory receptors (e.g., TLR1, TNFR) (Table 4). GO further revealed a significant downregulation in processes necessary for AT expansion and remodeling. “Vascular development” and “extracellular region” were significantly downregulated and included key growth (ADAMTS1, ADAMTS16, IGFBP5, NGF, FGF2) and remodeling (MMP2, PLAT) genes (Table 4). These data suggest increased inflammatory poise of the IAT in NASH vs. Steatosis.
NASH vs. Normal.
A total of 667 differentially expressed transcripts (175 up- and 492 downregulated) were identified in IAT from NASH vs. Normal (Fig. 7A). The 15 most up- and downregulated mRNAs are presented in Fig. 7B. Similar to NASH vs. Steatosis, the top upregulated IPA pathways indicate considerable IAT immune cell infiltration and inflammation in NASH vs Normal (e.g., “cross talk between dendritic cells and natural killer cells,” “OX40 signaling,” etc.; Fig. 7C). Interestingly, the top downregulated pathways could be broadly placed into one of two categories: mitochondrial dysfunction (“mitochondrial dysfunction,” “oxidative phosphorylation”) and cell growth and remodeling (“integrin signaling,” “ILK signaling,” “mTOR signaling,” “germ cell-Sertolli cell junction signaling,” and “IGF-1 signaling”). The downregulation of these growth and remodeling pathways was driven by reduced gene expression of cytoskeletal structure (ACTA2, ACTG1, TUBA1A, MYH14) and reorganization (RHOC, MYL12B, RAC1, RAC3), protein turnover (EIF3B, EIF3C, EIF4A1, EIF4G2, RPS17, RPS20, RPS24, CAPN2, CAPNS1), integrin signal transduction (ILK), and growth factor signal transduction (VEGFA, IRS1, IRS2). In addition, the top differentially expressed IPA network was “lipid metabolism, molecular transport, small molecule biochemistry” (Fig. 8, IPA score = 44), which, interestingly, centers on Akt and implicates aberrant insulin signaling in IAT in NASH vs. Normal. This network includes significant downregulation of genes associated with lipid storage (PLIN1, PLIN2) and lipid metabolism (ACSL1, ACACB, EVOLV5, FADS1, etc.).
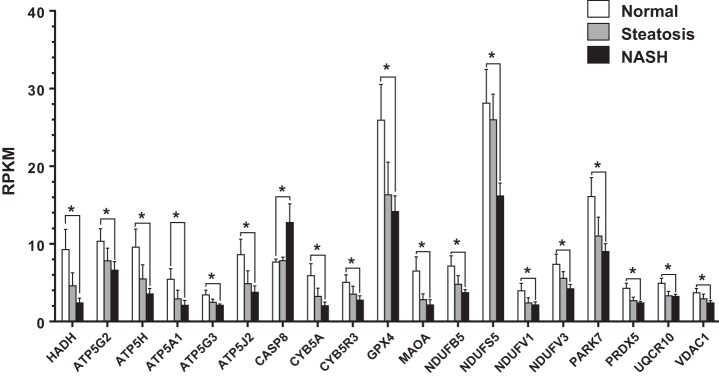
In addition to reduced cellular growth and remodeling, “mitochondrial dysfunction” was the top regulated canonical pathway (Fig. 7D) and was driven by reduced expression of electron transport system (ETS) genes, including four from complex I (NDUFB5, NDUFS5, NDUFV1, NDUFV3), three from complex III (CYB5A, CYB5R3, UQCR10), and five from complex V (ATP5A1, ATP5G2, ATP5G3, ATP5H, ATP5J2). In addition, there was decreased expression of antioxidant enzymes (GPX4, PARK7, PRDX5), which is intriguing considering that complex I and III are major sources of mitochondrial reactive oxygen species generation. Finally, Casp8 expression, which mediates extracellular initiated/mitochondrial-dependent apoptosis (1, 14, 36), was elevated in NASH vs. Normal.
The reduced expression of mitochondrial genes in NASH vs. Normal was also observed, though to a lesser extent, in Steatosis vs. Normal, suggesting a progressive loss in IAT mitochondrial function as the liver phenotype traverses the spectrum from normal to steatosis to NASH (Fig. 9). Contrarily, CASP8 expression only became differentially regulated in NASH. This suggests that IAT apoptotic processes may be associated not with NAFLD per se but rather the transition to NASH.
Fig. 9.
RPKM of transcripts in IAT related to mitochondrial dysfunction across liver phenotypes. NASH vs. Normal comparisons were identified as statistically significant by IPA analysis (*P < 0.05, FDR < 0.10).
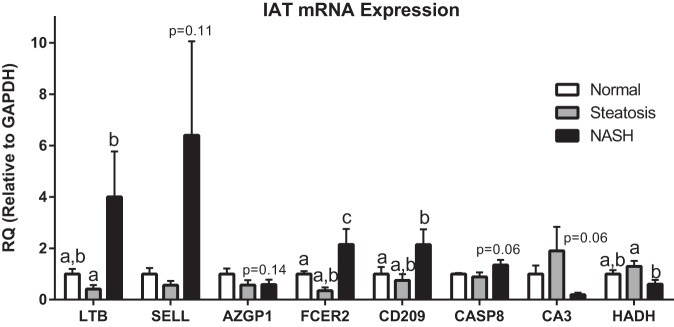
Finally, to provide validation of the RNA-Seq analysis, we performed qRT-PCR on select genes in IAT (Fig. 10). We observed upregulation in LTB, SELL, FCER2, and CD209 in the IAT from patients with NASH, which is consistent with the previously observed RNA-Seq data. Similarly, we observed trends for elevated CASP8 and decreased HADH expression as in the RNA-Seq analysis. The magnitude of difference among groups between the qRT-PCR and RNA-Seq data is likely explained by the differences in sensitivity of these two techniques.
Fig. 10.
Confirmatory quantitative RT-PCR of genes identified by RNA-Seq to be differentially expressed between groups. Different letter superscripts denote statistical significance (P < 0.05). RQ, relative quantification.
DISCUSSION
Pediatric obesity is a growing healthcare concern; however, there a paucity of literature addressing mechanisms by which excess adiposity leads to disease in children. Particularly alarming is the prevalence and progressive nature of NAFLD in this population. To identify potential mechanisms underlying NAFLD severity in children, the current investigation assessed the IAT transcriptome across a spectrum of liver pathologies and identified key differentially regulated IAT mRNA transcripts and networks across three distinct liver phenotypes: Normal, Steatosis, and NASH. This is the first such investigation in this population. We identified reduced adipose expansion/remodeling, insulin resistance, inflammation, impaired lipid metabolism, and mitochondrial dysfunction as features underlying the IAT transcriptome phenotype across the spectrum of NAFLD examined. These findings may shed important mechanistic light on the progression of pediatric NAFLD.
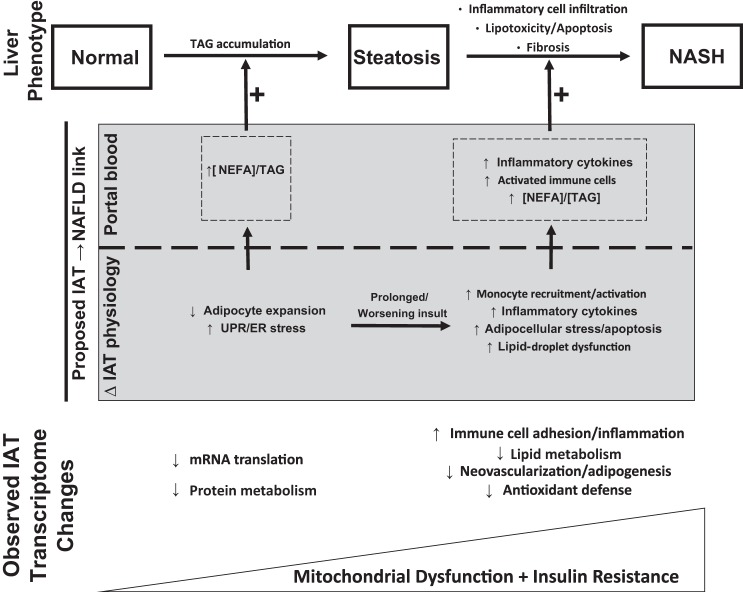
Portal blood flow provides the majority of blood volume to the liver, and the unique biochemical make-up of the portal circulation (influenced by dietary factors, efflux of mediators from the microbiome in the gut lumen, enterocyte products, gut associated lymphoid tissue, and IAT) is well appreciated to influence liver phenotype. Here we interpret our current findings relating IAT phenotype to NAFLD in the context of this “portal theory.” To accomplish this, the current discussion will focus on the relative impairment in adipocellular/adipose tissue expansion and the increase in IAT inflammation as associated with distinct liver phenotypes. In addition, the contributions of progressive mitochondrial dysfunction and insulin resistance to NAFLD/NASH development will be discussed. The current data were incorporated into a comprehensive summary providing a potential link between underlying IAT transcriptional changes and NAFLD progression (Fig. 11). It is important to emphasize that our current results to not demonstrate IAT causality of NAFLD progression but, rather, an important transcriptome-wide association study that may inform more targeted investigations in the future.
Fig. 11.
Summary of the current findings and a diagram depicting a proposed link between IAT phenotype and liver disease state. UPR, unfolded protein response; ER, endoplasmic reticulum; NEFA, nonesterified fatty acid; TAG, triacylglycerol.
The earliest etiology of NAFLD is hepatocellular lipid accumulation. Interestingly, the current data identified a significant reduction in transcripts related to cellular/tissue remodeling and expansion in IAT. IPA and GO both indicated dramatic reductions in genes essential for protein synthesis and mRNA translation machinery in Steatosis vs. Normal IAT. This likely reflects the unfolded protein response (UPR), which limits the translation and synthesis of protein to prevent excessive improper protein folding in an oxidative environment (reviewed in Ref. 29). Along these lines, IPA pathways related to cellular growth were reduced in NASH vs. Normal (Fig. 8), and reductions in vascular development, extracellular matrix remodeling, and the “adipogenesis” pathway were all reduced in Steatosis vs. NASH. In addition, the expression of lipid droplet proteins (Plin2, Plin5) was reduced in NASH vs. Normal. These data suggest a progressive impairment in IAT growth, remodeling, and lipid storage. An inability for the IAT to synthesize protein may limit intracellular lipid storage capacity, reducing the amount of lipid removed from the circulation and increasing portal delivery of NEFA/TAG to the liver. Thus, our data suggest that IAT UPR may contribute to the development of hepatic steatosis through enhanced portal delivery of TAG/NEFA.
A key distinguishing feature of NASH is hepatic inflammation and immune cell infiltration, yet underlying mechanisms are poorly understood. Interestingly, the presence of hepatic fibro-inflammatory lesions in morbidly obese adults directly correlates with omental adipose tissue macrophage content independently of glycemia (5, 33). Similarly, rodent data indicate that adipose tissue inflammation precedes hepatic inflammation (35) and the proinflammatory cytokine IL-1β released by adipose tissue promotes hepatic steatosis (22). Along these lines, current data suggest that IAT inflammation may contribute to NASH, or at least that both IAT and liver inflammation are influenced by a common proximal cause (discussed below). We identified a robust IAT transcriptome inflammatory response when comparing patients with NASH to hepatic steatosis. While this occurred in the absence of increased CD68 staining or differences in crown-like structures in the IAT (data not shown), each of the top eight upregulated pathways identified in this comparison were immune/inflammation related.
Such an IAT inflammatory response, in theory, could increase the portal delivery of proinflammatory cytokines or activated immune cells to the liver and mediate hepatic inflammation. In support of this, a number of upregulated mRNAs in Steatosis vs. NASH are soluble proinflammatory cytokines (CCL5, CCL19, CCL21, LYZ, IL34). In addition, the top upregulated transcript (Fig. 5), LTB (lymphotoxin-β), is a transmembrane member of the tumor necrosis factor ligand superfamily expressed on activated lymphocytes (37). LTB has been demonstrated to activate hepatic stellate cells in wound healing (27), whereas its inhibition prevents the development of hepatocellular carcinoma (8). This suggests that, should LTB be delivered to the liver, it could influence hepatic fibrogenesis as well as inflammation. Whether activated IAT lymphocytes spill over into the portal circulation is unclear, and future characterization of portal blood monocyte populations in different NAFLD stages may be useful. Together, these data provide intriguing evidence that IAT inflammation may influence hepatic inflammation and/or fibrosis through the release of inflammatory cytokines and possibly the release of activated lymphocytes into the portal circulation.
Our comparison of the IAT transcriptome in Normal vs. NASH revealed that IAT mitochondrial dysfunction and dysregulated fatty acid metabolism, likely stemming from insulin resistance, may be an important underlying contributor of the IAT physiological differences across liver phenotypes. Differentially expressed transcripts grouped in “mitochondrial dysfunction” by IPA largely reflected reduced expression of subunits of ETS complexes I, III, and V as well as the rate-limiting enzyme of β-oxidation, HADH. In addition, there was reduced expression of mitochondrial antioxidant enzymes and an upregulation in the apoptosis marker CASP8. Collectively, these data suggest that there may be a relative impairment to properly oxidize fatty acid substrates toward the generation of ATP and an increase in oxidative stress and metabolic intermediates. Interestingly, the expression of a majority of these mitochondrial-related genes was reduced in Normal vs. Steatosis (Fig. 9), though to a lesser extent than Normal vs. NASH, suggesting a potentially progressive deterioration of mitochondrial function in IAT as the liver transitions from Normal to Steatosis to NASH.
Another underlying feature of IAT pathophysiology across NAFLD stages was insulin resistance and impaired lipid metabolism. There was a clear loss of glucose control in patients with NASH compared with Normal and Steatosis (Table 1). In addition, IPA identified the top regulated network in Normal vs. NASH as “lipid metabolism, molecular transport, small molecule biochemistry” (Fig. 8), which interestingly centered on the key insulin signaling kinase Akt. This network included a number of regulators of Akt signaling (IRS1, TTC3, N-cor1, CAMKK1). In addition, this network is comprised primarily of reduced expression of genes involved in nearly every phase of fatty acid metabolism, including de novo lipogenesis (ELOVL5, ACACA, ACACB), TAG synthesis (DGAT2, ACSL1) and hydrolysis (MDLL), ceramide synthesis (CERS2) and hydrolysis (ASAH1, PSAP), TCA cycle regulation (ACSS1, PDK4), lipid storage (CIDEC, PLIN1, PLIN2), β-oxidation (HSD17B4), mitochondrial fatty acid entry (CPT1A, CPT1B), glycerolipid synthesis (GPAM), and phospholipid metabolism (PLTP, SDPR). The broad scope of function of these downregulated lipid metabolism related genes is suggestive of a relatively static metabolic phenotype with reduced lipid flux in IAT from NASH vs. Normal. The consequences of such a phenotype may include reduced NEFA/TAG uptake and prolonged presence of toxic metabolic intermediates. For example, reduced synthesis and hydrolysis of ceramide would reduce ceramide flux, potentially allowing for more potent effects of this molecule. This is relevant to the current discussion as adipose tissue ceramide has been linked to adipose tissue inflammation and liver fat content in obese, nondiabetic women (13). Collectively, these data support the above discussion of the portal theory as insulin resistance and reduced metabolic flux may increase the portal delivery of lipids and inflammatory mediators.
It is likely that systemic influences such as loss of glycemic control or dyslipidemia (Table 2) could also influence both IAT and liver pathophysiology simultaneously. In addition, other factors such as intestinal permeability/microbiome alterations with increasing/prolonged obesity could also be playing an underlying role in our observations (15, 19). In actuality, it is likely that both the portal theory and this common proximal cause hypothesis are correct in part, as each system operates in a complex network with every other system. Given the limitations of the reductionist approach undertaken in our interpretations herein, the current investigation provides a valuable linear description of IAT-liver interaction that must be considered in a broader network of systems biology.
Currently, definitive staging of NAFLD requires liver biopsy, a highly invasive, costly, and risky procedure. The Hepatology Committee of the European Society for Paediatric Gastroenterology Hepatology and Nutrition (ESPGHAN) has recently recognized the importance of understanding mechanisms contributing to disease progression in order to identify specific markers that could serve as “a valid alternative to liver biopsy” (34). While this was not the original intent of our investigation, our results provide intriguing candidate markers for distinguishing Steatosis from NASH. The most appealing candidate was FCER2, a soluble factor produced from NOCTH2 activation in B cells (9), whose RPKM expression was 2.4, 2.0, and 30.5 in Normal, Steatosis, and NASH, respectively. If mRNA in IAT reflects circulating peptide levels, then FCER2 could be a novel alternative for NASH diagnosis.
Conclusions
The prevalence of pediatric NAFLD is alarmingly high, yet little is known regarding the underlying mechanisms in this population. To address this in the current investigation we sought to identify an associative role for IAT phenotype in the development and progression of NAFLD. Using a whole transcriptome mRNA sequencing analysis of IAT in children with varying stages of NAFLD undergoing bariatric surgery, we were able to identity unique IAT transcript regulated networks in a spectrum of liver disease states from Normal to Steatosis and NASH. Our data indicate that reduced adipose tissue expansion and remodeling, increased inflammation, reduced mitochondrial function, and insulin resistance in IAT are associated with and may contribute to the development of hepatic steatosis and the progression to NASH.
GRANTS
Funding was provided by a grant from the JR Albert Foundation (R. S. Rector) and VA-CDA2-1 IK2BX001299 (salary support to R. S. Rector), a University of Missouri Life Sciences Pre-doctoral Fellowship (R. D. Sheldon), and in part by the Center for Bariatric Research and Innovation at Cincinnati Children's Hospital Medical Center (T. H. Inge) and NIH Grant K23080888 (S. Xanthakos). The Pediatric Obesity Tissue Repository at Cincinnati Children's Hospital Medical Center was also supported by the National Center for Advancing Translational Sciences of the NIH, under Award Number UL1TR000077. This work was partially supported with resources and the use of facilities at the Harry S. Truman Memorial Veterans Hospital in Columbia, MO.
DISCLOSURES
No conflicts of interest, financial or otherwise, are declared by the author(s).
AUTHOR CONTRIBUTIONS
R.D.S., K.D.W., J.W.P., S.X., T.H.I., and R.S.R. conception and design of research; R.D.S., K.M.K., K.D.W., L.M., J.W.P., S.X., T.H.I., and R.S.R. performed experiments; R.D.S., K.M.K., K.D.W., J.W.P., S.X., and R.S.R. analyzed data; R.D.S., K.M.K., K.D.W., J.W.P., S.X., T.H.I., and R.S.R. interpreted results of experiments; R.D.S. and R.S.R. prepared figures; R.D.S. and R.S.R. drafted manuscript; R.D.S., K.M.K., K.D.W., L.M., J.W.P., S.X., T.H.I., and R.S.R. edited and revised manuscript; R.D.S., K.M.K., K.D.W., L.M., J.W.P., S.X., T.H.I., and R.S.R. approved final version of manuscript.
ACKNOWLEDGMENTS
We gratefully acknowledge the expert technical assistance of Kelly Stromsdorfer, Melissa Linden, Grace Meers, and Lindsey Shaw from the University of Missouri.
Present address: J. W. Perfield II, Eli Lilly and Company, Lilly Corporate Center, Indianapolis, IN 46285.
REFERENCES
- 1.Alkhouri N, Gornicka A, Berk MP, Thapaliya S, Dixon LJ, Kashyap S, Schauer PR, Feldstein AE. Adipocyte apoptosis, a link between obesity, insulin resistance, and hepatic steatosis. J Biol Chem 285: 3428–3438, 2010. [DOI] [PMC free article] [PubMed] [Google Scholar]
- 2.Brunt EM, Kleiner DE, Wilson LA, Belt P, Neuschwander-Tetri BA. Nonalcoholic fatty liver disease (NAFLD) activity score and the histopathologic diagnosis in NAFLD: distinct clinicopathologic meanings. Hepatology 53: 810–820, 2011. [DOI] [PMC free article] [PubMed] [Google Scholar]
- 3.Byrne CD, Targher G. Ectopic fat, insulin resistance, and nonalcoholic fatty liver disease: implications for cardiovascular disease. Arterioscler Thromb Vasc Biol 34: 1155–1161, 2014. [DOI] [PubMed] [Google Scholar]
- 4.Byrne CD, Targher G. NAFLD: a multisystem disease. J Hepatol 62: S47–S64, 2015. [DOI] [PubMed] [Google Scholar]
- 5.Cancello R, Tordjman J, Poitou C, Guilhem G, Bouillot JL, Hugol D, Coussieu C, Basdevant A, Bar Hen A, Bedossa P, Guerre-Millo M, Clement K. Increased infiltration of macrophages in omental adipose tissue is associated with marked hepatic lesions in morbid human obesity. Diabetes 55: 1554–1561, 2006. [DOI] [PubMed] [Google Scholar]
- 6.Donnelly KL, Smith CI, Schwarzenberg SJ, Jessurun J, Boldt MD, Parks EJ. Sources of fatty acids stored in liver and secreted via lipoproteins in patients with nonalcoholic fatty liver disease. J Clin Invest 115: 1343–1351, 2005. [DOI] [PMC free article] [PubMed] [Google Scholar]
- 7.Feldstein AE, Charatcharoenwitthaya P, Treeprasertsuk S, Benson JT, Enders FB, Angulo P. The natural history of non-alcoholic fatty liver disease in children: a follow-up study for up to 20 years. Gut 58: 1538–1544, 2009. [DOI] [PMC free article] [PubMed] [Google Scholar]
- 8.Haybaeck J, Zeller N, Wolf MJ, Weber A, Wagner U, Kurrer MO, Bremer J, Iezzi G, Graf R, Clavien PA, Thimme R, Blum H, Nedospasov SA, Zatloukal K, Ramzan M, Ciesek S, Pietschmann T, Marche PN, Karin M, Kopf M, Browning JL, Aguzzi A, Heikenwalder M. A lymphotoxin-driven pathway to hepatocellular carcinoma. Cancer Cell 16: 295–308, 2009. [DOI] [PMC free article] [PubMed] [Google Scholar]
- 8a.Huang da W, Sherman BT, Lempicki RA. Systematic and integrative analysis of large gene lists using DAVID bioinformatics resources. Nat Protocols 4: 44–57, 2009. [DOI] [PubMed] [Google Scholar]
- 9.Hubmann R, Schwarzmeier JD, Shehata M, Hilgarth M, Duechler M, Dettke M, Berger R. Notch2 is involved in the overexpression of CD23 in B-cell chronic lymphocytic leukemia. Blood 99: 3742–3747, 2002. [DOI] [PubMed] [Google Scholar]
- 10.Jenkins NT, Padilla J, Thorne PK, Martin JS, Rector RS, Davis JW, Laughlin MH. Transcriptome-wide RNA sequencing analysis of rat skeletal muscle feed arteries. I. Impact of obesity. J Appl Physiol (1985) 116: 1017–1032, 2014. [DOI] [PMC free article] [PubMed] [Google Scholar]
- 11.Kleiner DE, Brunt EM, Van Natta M, Behling C, Contos MJ, Cummings OW, Ferrell LD, Liu YC, Torbenson MS, Unalp-Arida A, Yeh M, McCullough AJ, Sanyal AJ. Design and validation of a histological scoring system for nonalcoholic fatty liver disease. Hepatology 41: 1313–1321, 2005. [DOI] [PubMed] [Google Scholar]
- 12.Kohli R, Boyd T, Lake K, Dietrich K, Nicholas L, Balistreri WF, Ebach D, Shashidhar H, Xanthakos SA. Rapid progression of NASH in childhood. J Pediatr Gastroenterol Nutr 50: 453–456, 2010. [DOI] [PMC free article] [PubMed] [Google Scholar]
- 13.Kolak M, Westerbacka J, Velagapudi VR, Wagsater D, Yetukuri L, Makkonen J, Rissanen A, Hakkinen AM, Lindell M, Bergholm R, Hamsten A, Eriksson P, Fisher RM, Oresic M, Yki-Jarvinen H. Adipose tissue inflammation and increased ceramide content characterize subjects with high liver fat content independent of obesity. Diabetes 56: 1960–1968, 2007. [DOI] [PubMed] [Google Scholar]
- 14.Kuwana T, Smith JJ, Muzio M, Dixit V, Newmeyer DD, Kornbluth S. Apoptosis induction by caspase-8 is amplified through the mitochondrial release of cytochrome c. J Biol Chem 273: 16589–16594, 1998. [DOI] [PubMed] [Google Scholar]
- 15.Lam YY, Ha CW, Campbell CR, Mitchell AJ, Dinudom A, Oscarsson J, Cook DI, Hunt NH, Caterson ID, Holmes AJ, Storlien LH. Increased gut permeability and microbiota change associate with mesenteric fat inflammation and metabolic dysfunction in diet-induced obese mice. PLoS One 7: e34233, 2012. [DOI] [PMC free article] [PubMed] [Google Scholar]
- 16.Laughlin MH, Padilla J, Jenkins NT, Thorne PK, Martin JS, Rector RS, Akter S, Davis JW. Exercise-induced differential changes in gene expression among arterioles of skeletal muscles of obese rats. J Appl Physiol (1985) 119: 583–603, 2015. [DOI] [PMC free article] [PubMed] [Google Scholar]
- 17.Laughlin MH, Padilla J, Jenkins NT, Thorne PK, Martin JS, Rector RS, Akter S, Davis JW. Exercise training causes differential changes in gene expression in diaphragm arteries and 2A arterioles of obese rats. J Appl Physiol (1985) 119: 604–616, 2015. [DOI] [PMC free article] [PubMed] [Google Scholar]
- 18.Manco M, Marcellini M, Devito R, Comparcola D, Sartorelli MR, Nobili V. Metabolic syndrome and liver histology in paediatric non-alcoholic steatohepatitis. Int J Obes 32: 381–387, 2008. [DOI] [PubMed] [Google Scholar]
- 19.Miele L, Valenza V, La Torre G, Montalto M, Cammarota G, Ricci R, Masciana R, Forgione A, Gabrieli ML, Perotti G, Vecchio FM, Rapaccini G, Gasbarrini G, Day CP, Grieco A. Increased intestinal permeability and tight junction alterations in nonalcoholic fatty liver disease. Hepatology 49: 1877–1887, 2009. [DOI] [PubMed] [Google Scholar]
- 20.Molleston JP, White F, Teckman J, Fitzgerald JF. Obese children with steatohepatitis can develop cirrhosis in childhood. Am J Gastroenterol 97: 2460–2462, 2002. [DOI] [PubMed] [Google Scholar]
- 21.Moran A, Jacobs DR Jr, Steinberger J, Hong CP, Prineas R, Luepker R, Sinaiko AR. Insulin resistance during puberty: results from clamp studies in 357 children. Diabetes 48: 2039–2044, 1999. [DOI] [PubMed] [Google Scholar]
- 22.Nov O, Shapiro H, Ovadia H, Tarnovscki T, Dvir I, Shemesh E, Kovsan J, Shelef I, Carmi Y, Voronov E, Apte RN, Lewis E, Haim Y, Konrad D, Bashan N, Rudich A. Interleukin-1beta regulates fat-liver crosstalk in obesity by auto-paracrine modulation of adipose tissue inflammation and expandability. PLoS One 8: e53626, 2013. [DOI] [PMC free article] [PubMed] [Google Scholar]
- 23.Ota T, Takamura T, Kurita S, Matsuzawa N, Kita Y, Uno M, Akahori H, Misu H, Sakurai M, Zen Y, Nakanuma Y, Kaneko S. Insulin resistance accelerates a dietary rat model of nonalcoholic steatohepatitis. Gastroenterology 132: 282–293, 2007. [DOI] [PubMed] [Google Scholar]
- 24.Padilla J, Jenkins NT, Thorne PK, Martin JS, Rector RS, Davis JW, Laughlin MH. Transcriptome-wide RNA sequencing analysis of rat skeletal muscle feed arteries. II. Impact of exercise training in obesity. J Appl Physiol (1985) 116: 1033–1047, 2014. [DOI] [PMC free article] [PubMed] [Google Scholar]
- 25.Pagano G, Pacini G, Musso G, Gambino R, Mecca F, Depetris N, Cassader M, David E, Cavallo-Perin P, Rizzetto M. Nonalcoholic steatohepatitis, insulin resistance, and metabolic syndrome: further evidence for an etiologic association. Hepatology 35: 367–372, 2002. [DOI] [PubMed] [Google Scholar]
- 26.Qureshi K, Abrams GA. Metabolic liver disease of obesity and role of adipose tissue in the pathogenesis of nonalcoholic fatty liver disease. World J Gastroenterol 13: 3540–3553, 2007. [DOI] [PMC free article] [PubMed] [Google Scholar]
- 27.Ruddell RG, Knight B, Tirnitz-Parker JE, Akhurst B, Summerville L, Subramaniam VN, Olynyk JK, Ramm GA. Lymphotoxin-beta receptor signaling regulates hepatic stellate cell function and wound healing in a murine model of chronic liver injury. Hepatology 49: 227–239, 2009. [DOI] [PubMed] [Google Scholar]
- 28.Sanyal AJ, Campbell-Sargent C, Mirshahi F, Rizzo WB, Contos MJ, Sterling RK, Luketic VA, Shiffman ML, Clore JN. Nonalcoholic steatohepatitis: association of insulin resistance and mitochondrial abnormalities. Gastroenterology 120: 1183–1192, 2001. [DOI] [PubMed] [Google Scholar]
- 29.Schroder M, Kaufman RJ. The mammalian unfolded protein response. Annu Rev Biochem 74: 739–789, 2005. [DOI] [PubMed] [Google Scholar]
- 30.Schwimmer JB, Deutsch R, Kahen T, Lavine JE, Stanley C, Behling C. Prevalence of fatty liver in children and adolescents. Pediatrics 118: 1388–1393, 2006. [DOI] [PubMed] [Google Scholar]
- 31.Schwimmer JB, Deutsch R, Rauch JB, Behling C, Newbury R, Lavine JE. Obesity, insulin resistance, and other clinicopathological correlates of pediatric nonalcoholic fatty liver disease. J Pediatr 143: 500–505, 2003. [DOI] [PubMed] [Google Scholar]
- 32.Toedebusch RG, Roberts MD, Wells KD, Company JM, Kanosky KM, Padilla J, Jenkins NT, Perfield JW 2nd, Ibdah JA, Booth FW, Rector RS. Unique transcriptomic signature of omental adipose tissue in Ossabaw swine: a model of childhood obesity. Physiol Genomics 46: 362–375, 2014. [DOI] [PMC free article] [PubMed] [Google Scholar]
- 33.Tordjman J, Poitou C, Hugol D, Bouillot JL, Basdevant A, Bedossa P, Guerre-Millo M, Clement K. Association between omental adipose tissue macrophages and liver histopathology in morbid obesity: influence of glycemic status. J Hepatol 51: 354–362, 2009. [DOI] [PubMed] [Google Scholar]
- 34.Vajro P, Lenta S, S ocha P, Dhawan A, McKiernan P, Baumann U, Durmaz O, Lacaille F, McLin V, Nobili V. Diagnosis of nonalcoholic fatty liver disease in children and adolescents: position paper of the ESPGHAN Hepatology Committee. J Pediatr Gastroenterol And Nutr 54: 700–713, 2012. [DOI] [PubMed] [Google Scholar]
- 35.van der Heijden RA, Sheedfar F, Morrison MC, Hommelberg PP, Kor D, Kloosterhuis NJ, Gruben N, Youssef SA, de Bruin A, Hofker MH, Kleemann R, Koonen DP, Heeringa P. High-fat diet induced obesity primes inflammation in adipose tissue prior to liver in C57BL/6j mice. Aging (Albany NY) 7: 256–268, 2015. [DOI] [PMC free article] [PubMed] [Google Scholar]
- 36.Wang L, Du F, Wang X. TNF-α induces two distinct caspase-8 activation pathways. Cell 133: 693–703, 2008. [DOI] [PubMed] [Google Scholar]
- 37.Ware CF, Crowe PD, Grayson MH, Androlewicz MJ, Browning JL. Expression of surface lymphotoxin and tumor necrosis factor on activated T, B, and natural killer cells. J Immunol 149: 3881–3888, 1992. [PubMed] [Google Scholar]
- 38.Willner IR, Waters B, Patil SR, Reuben A, Morelli J, Riely CA. Ninety patients with nonalcoholic steatohepatitis: insulin resistance, familial tendency, and severity of disease. Am J Gastroenterol 96: 2957–2961, 2001. [DOI] [PubMed] [Google Scholar]
- 39.Wong RJ, Aguilar M, Cheung R, Perumpail RB, Harrison SA, Younossi ZM, Ahmed A. Nonalcoholic steatohepatitis is the second leading etiology of liver disease among adults awaiting liver transplantation in the United States. Gastroenterology 148: 547–555, 2015. [DOI] [PubMed] [Google Scholar]


