Significance
Water is ubiquitous, but its physical properties are anomalous compared with most liquids. Because the anomalies become enhanced upon cooling, understanding the behavior of deeply supercooled water is critical. Unfortunately, experiments below ∼236 K at ambient pressure are difficult due to uncontrolled crystallization. Using a pulsed-laser–heating technique, we have determined the crystalline-ice growth rate and liquid-water diffusivity for temperatures between 180 and 262 K in ultrahigh-vacuum conditions. The fact that both of these quantities are smoothly varying rules out the hypothesis that water’s properties have a singularity at or near 228 K. However, the results are consistent with a previous prediction for the diffusivity that assumed no thermodynamic transitions occur in the supercooled region.
Keywords: supercooled water, self-diffusion, crystallization kinetics, dynamic crossover
Abstract
Understanding deeply supercooled water is key to unraveling many of water’s anomalous properties. However, developing this understanding has proven difficult due to rapid and uncontrolled crystallization. Using a pulsed-laser–heating technique, we measure the growth rate of crystalline ice, G(T), for 180 K < T < 262 K, that is, deep within water’s “no man’s land” in ultrahigh-vacuum conditions. Isothermal measurements of G(T) are also made for 126 K ≤ T ≤ 151 K. The self-diffusion of supercooled liquid water, D(T), is obtained from G(T) using the Wilson–Frenkel model of crystal growth. For T > 237 K and P ∼ 10−8 Pa, G(T) and D(T) have super-Arrhenius (“fragile”) temperature dependences, but both cross over to Arrhenius (“strong”) behavior with a large activation energy in no man’s land. The fact that G(T) and D(T) are smoothly varying rules out the hypothesis that liquid water’s properties have a singularity at or near 228 K at ambient pressures. However, the results are consistent with a previous prediction for D(T) that assumed no thermodynamic transitions occur in no man’s land.
Water is not a typical liquid, and its unusual properties have been discussed by many authors (1–13). Anomalies are observed in thermodynamic response functions (such as the isobaric heat capacity and the isothermal compressibility) and dynamic properties (such as diffusion, viscosity, and dielectric relaxation) over a wide range of pressures, P, and temperatures, T. These anomalies become more pronounced for supercooled water, and it is generally believed that the unusual properties arise as water adopts a more ice-like structure as the temperature decreases. However, the underlying reasons are fiercely debated (5, 11, 14–17). At ambient pressures, many of the anomalous properties appear to diverge at a temperature, Ts, around 228 K leading to the “stability-limit conjecture” in which the liquid becomes unstable below Ts (2). Several other models have been proposed to explain the thermodynamic anomalies including the liquid–liquid critical point model (3), the critical-point free scenario (18), and the singularity-free hypothesis (19). However, it is noteworthy that both thermodynamic and dynamic properties apparently diverge at ∼Ts (1, 2). To explain the similarities in the thermodynamics and dynamics, Adam–Gibbs theory is attractive because it connects changes in the entropy of a liquid to its dynamics (20). Using this theory, Starr et al. (6) predicted that the self-diffusion of water, D(T), undergoes a dynamic crossover from super-Arrhenius to Arrhenius behavior (often called a “fragile-to-strong” transition) at temperatures just below the homogeneous nucleation temperature, TH, at ∼235 K. However, purely dynamical explanations have also been proposed (5, 21).
Differentiating between various theories has proven difficult because the onset of rapid crystallization at TH has prevented experiments below this point (5, 22). Another approach involves heating low-density amorphous (LDA) ice above its glass transition temperature (∼136 K) before crystallization at ∼150 K (5, 10). The heretofore-inaccessible temperature range between ∼150 and 235 K at ambient pressures is known as “no man’s land” (5, 23). Experiments on water confined to nanoscale drops provide entry into no man’s land (24, 25) but are complicated by interfacial effects (10). Considerable insight has also been gained by exploring water’s unusual properties over a wide range of pressures (3, 5, 7, 23).
Here, we report the growth rate of crystalline ice, G(T), using a pulsed-heating technique (26) for 181 K ≤ T < 262 K and measured isothermally for 126 K ≤ T ≤ 151 K. Because G(T) is proportional to D(T) (27–29), we also determine D(T). For T > 235 K, we reproduce the previously measured super-Arrhenius behavior (30). For 180 K < T < 235 K, G(T) and D(T) cross over to Arrhenius dependences with large activation energies and prefactors. For 126 K ≤ T < 180 K, G(T) and D(T) are also Arrhenius-like but with lower activation energies. These results for D(T), which are inconsistent with a singularity at or near Ts, agree with the prediction of a fragile-to-strong crossover using the thermodynamic properties of water and the Adam–Gibbs theory (6, 20).
Results
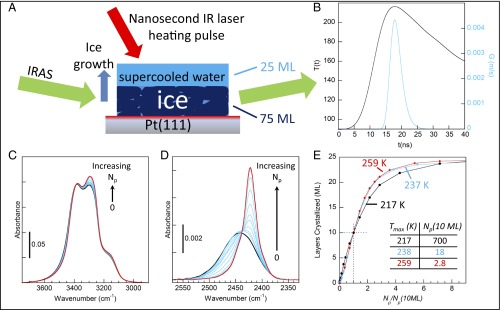
Fig. 1A shows a schematic of the pulsed-heating experiments (26). The crystalline ice growth rates were measured for layered ice/water samples (Sample Preparation and Figs. S1 and S2). First, 75-monolayer (ML) films of polycrystalline ice (CI) were prepared on Pt(111) in ultrahigh vacuum. Next, 25-ML films of amorphous solid water (ASW) were deposited to create metastable, layered CI–ASW films. To enhance the sensitivity of the measurements, the CI films were composed of pure H2O, whereas the ASW layers had ∼9.5% HDO in H2O. With the steady-state temperature set at 90 K, the platinum substrate was heated with IR pulses from a Nd:YAG laser (λ = 1,064 nm, ∼10 ns, 1–10 Hz). Facile heat transfer from the substrate raised the temperature of the adsorbed water films to their maximum value, Tmax, in ∼20 ns, and subsequent diffusion of heat into the platinum rapidly cooled the samples back to cryogenic temperatures in between pulses. The black line in Fig. 1B shows the calculated temperature, T(t), for a typical heat pulse. T(t) was calibrated by measuring the water desorption per pulse from the films after they had crystallized (Temperature Calibration) (26).
Fig. 1.
(A) Schematic of the experiments. Nanoscale films were heated with a laser pulse that raised the temperature for ∼20 ns, creating a film of supercooled water on top of ice. Ice growth that occurred due to the pulsed heating was measured with IRAS. (B) T(t) calculated for Tmax = 217 K (black) and the corresponding G(T) that matches the observations (blue). (C and D) IRAS spectra for an as-grown film (black), at intermediate stages of ice growth (blue), and after crystallization is complete (red). Both the OH-stretch (C) and the isolated HDO-stretch (D) regions show the crystallization. (E) The number of MLs of the initially amorphous layers crystallized vs. the number of heat pulses, Np, for Tmax = 217, 237, and 259 K. To facilitate comparison, Np has been normalized by the number of pulses required to crystallize 10 ML at each temperature.
Fig. S1.
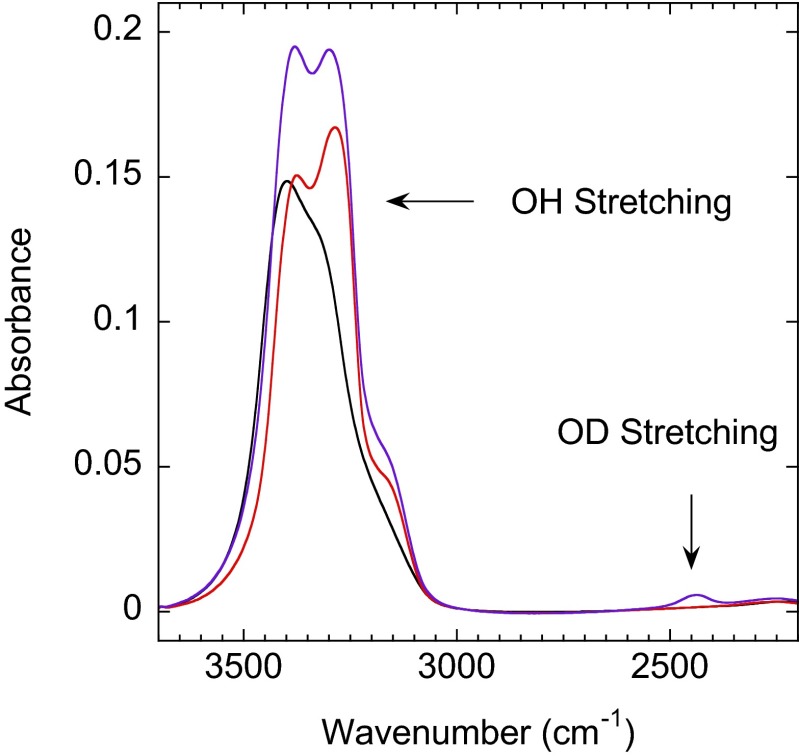
IRAS spectra showing the OH-stretching (∼3,000–3,700 cm−1) and OD-stretching (∼2,350–2,550 cm−1) regions for an as-dosed 77-ML H2O ASW film (black line) and this same film after it was crystallized by pulsed-laser heating (red line). After crystallization via pulsed-laser heating, the film coverage is 75 ML. After capping the crystallized film with a 25-ML ASW film that is 9.5% HDO, a small peak in the OD-stretch region appears (purple line). The 75-ML CI plus 25-ML ASW (9.5% HDO) is the starting configuration for measuring the ice growth rate.
Fig. S2.
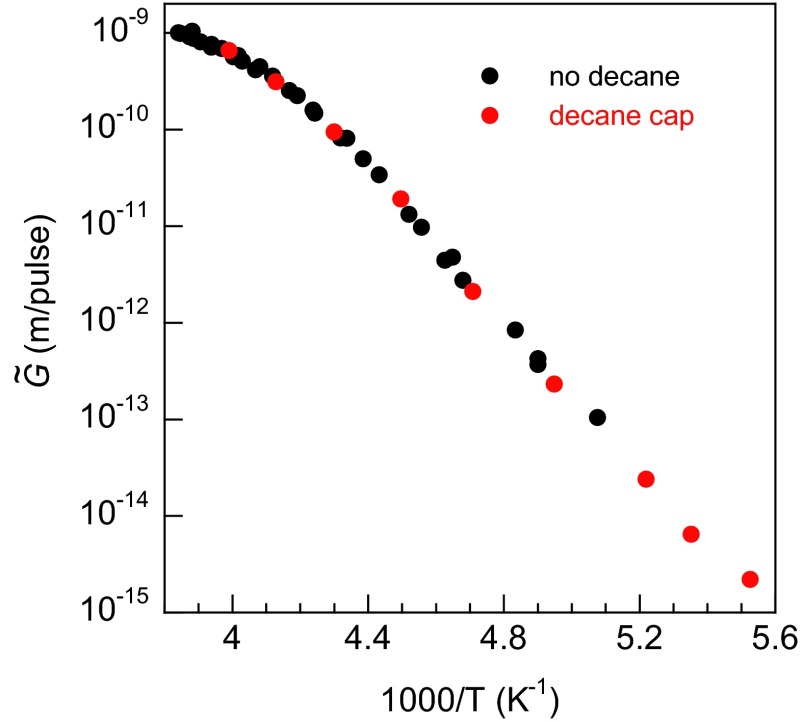
vs. inverse temperature for films with (red circles) and without (black circles) a decane cap layer. The decane cap layer was used at the lowest temperatures to prevent adventitious adsorption onto the water film during those longer experiments. The negligible influence of the decane on the measurements was verified by comparison with similar measurements with the cap at higher temperatures.
The rapid heating transforms the ASW layer into supercooled liquid water with a concomitant increase in the diffusion leading to CI growth at the ice–water interface at the rate, G(T) (e.g., Fig. 1B, blue line). Infrared reflection absorption spectroscopy (IRAS) was used to monitor the ice growth. Note that the IRAS spectra were acquired at 90 K after a specified number of heat pulses, Np, had been applied to the sample. Fig. 1C shows how the OH-stretch region of the IRAS spectra evolves as the film crystallizes. By construction, HDO molecules are found only in the (initially) liquid layer, and, as a result, the crystallization of this layer is more readily apparent in the OD-stretch region (Fig. 1D). The amount of ice in the films can be determined by fitting the IRAS spectra to a linear combination of the initial and final spectra (Fig. S3). Fig. 1E shows the ice growth vs. the (normalized) number of laser pulses for Tmax = 217, 237, and 259 K. For all three temperatures, the crystallization increases approximately linearly vs. Np. (The experimental factors contributing to the deviations from linearity are discussed in Determination of Growth Rates from IRAS Spectra.) Note that there is no qualitative change in the results even at 217 K, which is ∼18 K below TH. Several control experiments show that ice nucleation within the liquid layer or at the liquid–vacuum interface is not significant for these experiments (Ice Nucleation, and Figs. S4 and S5). We have also measured G(T) for films with different thicknesses of both the CI layer (50–150 ML) and the liquid-water layer (15–75 ML) and found that G(T) is unchanged. At temperatures near the melting point, a quasiliquid layer forms on the surface of CI (31). However, the fact that the measured growth rates do not depend on the initial thickness of the liquid-water layer suggests that a quasiliquid layer does not influence the results presented here. This conclusion also agrees with previous results that indicate that the quasiliquid layer should be less than 1 nm thick for T < 263 K (31). Because our experiments produce macroscopically flat films, curvature effects can also be ignored. Collectively, these points indicate that our measurements are germane to bulk supercooled water.
Fig. S3.
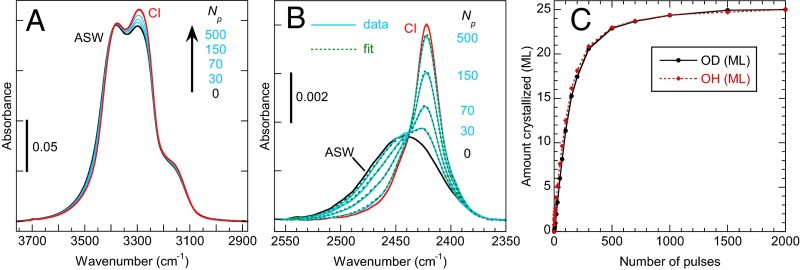
The IRAS spectra in the OH-stretch (A) and OD-stretch (B) regions evolve as a function of number of pulses applied for Tmax = 225 K. (C) The amount crystallized vs. the number of pulses as determined from the IRAS spectra in the OH-stretch (red diamonds) and OD-stretch (black circles) regions.
Fig. S4.
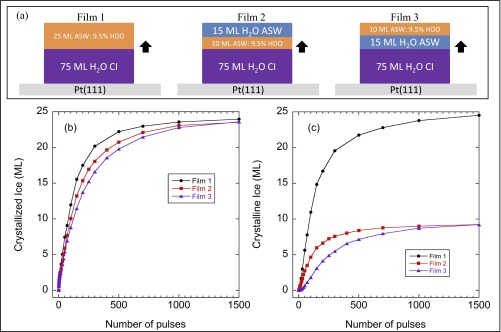
Control experiments demonstrating growth at the ice/water interface. (A) Schematic of the layered films. All three experiments have a 75-ML H2O CI film grown on the Pt(111). For film 1, the 25-ML ASW is composed entirely of 9.5% HDO in H2O. For film 2, the ASW layer is composed of a 10-ML thick layer of 9.5% HDO capped with 15 ML of H2O. For film 3, the ASW is composed of a 15-ML H2O layer capped with 10 ML of 9.5% HDO. The black arrows indicate ice growth at the ice/water interface. B and C show the amount of the initially ASW layer that has crystallized ice as a function of number of pulses as measured from the IRAS in the OH-stretching and OD-stretching regions, respectively. (B) As measured in the OH-stretch region, the growth rates for the three films are the same (within the experimental uncertainty associated with setting Tmax). (C) When the 9.5% HDO film is in direct contact with the CI template, crystallization measured via the OD-stretch starts immediately (red line), whereas it is delayed when the 9.5% HDO layer is above the 15-ML H2O layer (purple line).
Fig. S5.
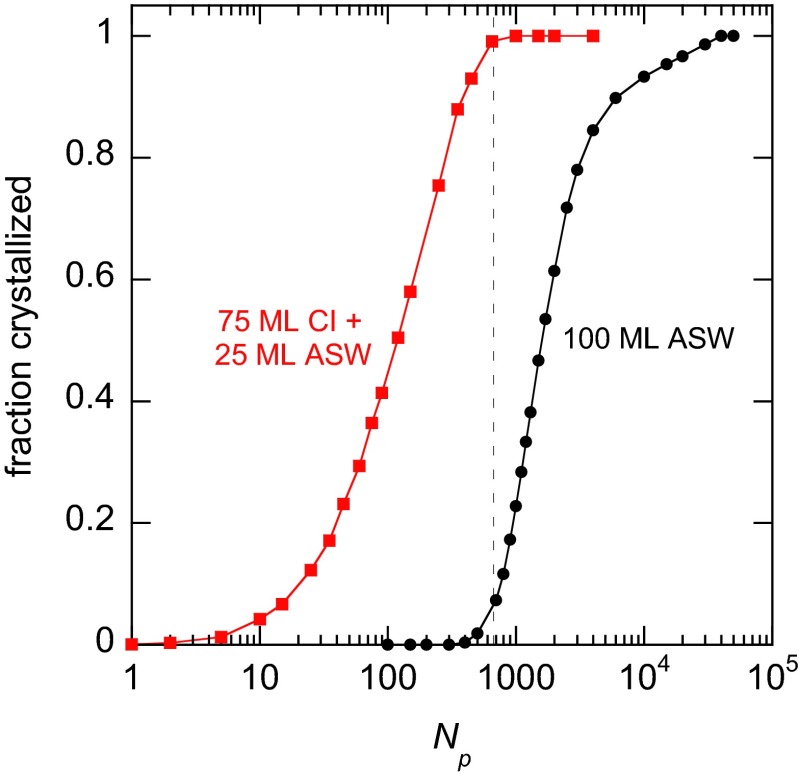
Fraction crystallized vs. the number of laser pulses, Np, for a 100-ML (initially) ASW film (black line) and a 75-ML CI plus 25-ML (initially) ASW film (red line). For the 75-ML CI plus 25-ML ASW film, the data show the crystallization of the 25-ML ASW portion of the film. For this plot, the crystallization is reported as the fraction crystallized, whereas for the figures discussed in this report it is given as the amount crystallized (in monolayers). For both experiments, Tmax = 225 K. By the time that crystallization of the 100-ML ASW film becomes appreciable (dashed vertical line), the film with the CI template has completely crystallized. Note that the initial linear increase in the red curve is not obvious due to the logarithmic scale for the x axis (Fig. 1E and Fig. S3C for similar data plotted on a linear scale).
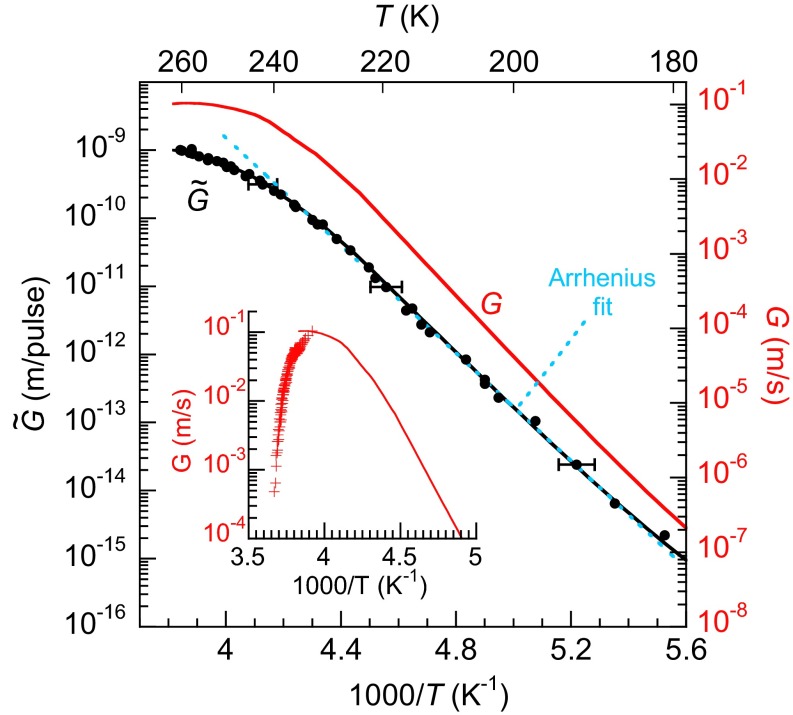
From experiments like those shown in Fig. 1E, the amount of ice growth per heat pulse, , can be determined (Fig. 2, black circles). At the highest temperatures, changes relatively slowly with temperature, whereas for T < 235 K, decreases very quickly. An Arrhenius fit to the data yields an activation energy of ∼76 kJ/mol (Fig. 2, dashed blue line). is related to G(T) by an integral equation that explicitly treats the temperature as function of time, T(t), at the ice/liquid interface during each heat pulse:
| [1] |
Because T(t) is known (Temperature Calibration) (26), can be calculated using trial functions for G(T) in Eq. 1 and then compared with the experimentally measured values. Fig. 2 shows a form of G(T) that reproduces the observed (Fig. 2, red and black lines, respectively).
Fig. 2.
and G(T) vs. inverse temperature. The black circles show the measured values for . exhibits Arrhenius behavior (∼76 kJ/mol) for Tmax < 235 K (blue dashed line). The measured growth rates are the integrals of G(T) over a heat pulse, T(t), with a maximum temperature, Tmax (Eq. 1). The red line shows a form of G(T) that reproduces the results of the pulsed-heating experiment (black line). The Inset compares previous measurements of G(T) for macroscopic samples (32) (crosses) to the current experiments on nanoscale water films (red line). For , the vertical size of the symbols is representative of the uncertainty in the measurements (±20%). Horizontal error bars, which show the lateral distribution of temperatures on the sample during the heat pulses, are shown for a few points.
Previous measurements of G(T) have been made on macroscopic samples over a relatively small temperature range near the melting point (32–34), or on nanoscale films at cryogenic temperatures (35). At the melting point, G(T) = 0 and at temperatures just below this, G(T) rapidly increases with decreasing temperature as the thermodynamic driving force for crystallization increases (27–29). As discussed below, G(T) is expected to go through a maximum and then decrease at even lower temperatures due to a decrease in D(T). It is important to note that, for macroscopic samples, the heat of fusion that is released upon crystallization and subsequent heat transfer from the ice/water interface limits the minimum temperature that is achieved at the interface (36). The local heating at the ice/water interface has precluded observation of the expected decrease in G(T) with decreasing temperature in macroscopic samples. These effects are less important in the nanoscale films used here (Latent Heat of Fusion and Fig. S6), and the decrease in G(T) expected at lower temperatures is clearly observed (Fig. 2). Nonetheless, the magnitude of G(T) determined for macroscopic samples agrees reasonably well with the current results at comparable temperatures (Fig. 2, Inset).
Fig. S6.
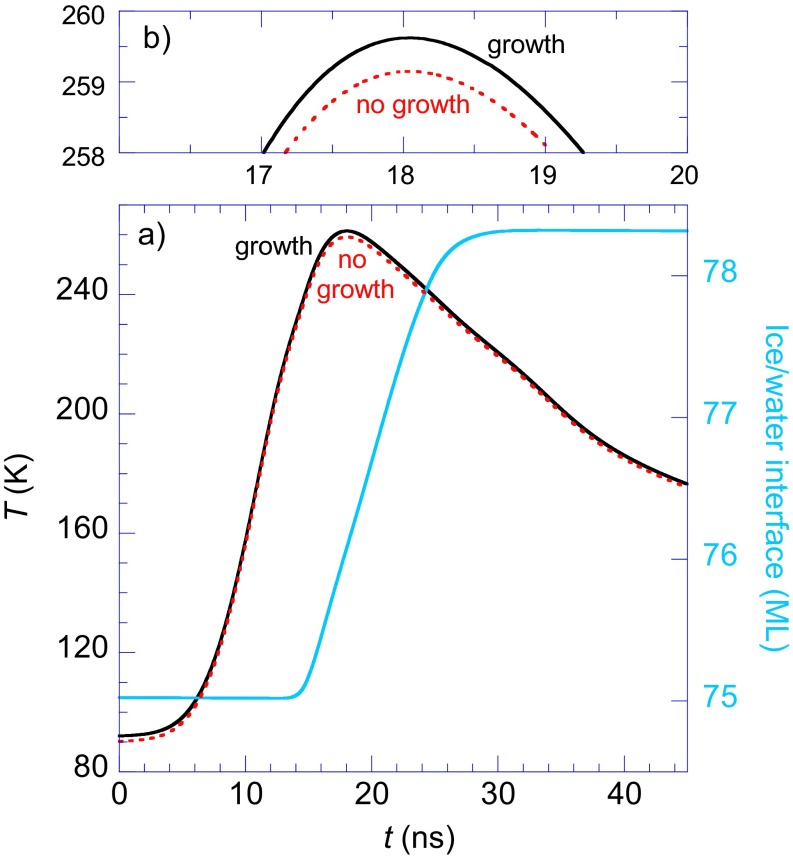
(A) Calculated temperature and position of the ice/water interface vs. time during pulsed-laser heating. The black and red lines show T(t) at the ice/water interface for calculations with and without crystallization and the accompanying latent heat of fusion, respectively. For the calculation where crystallization is included, the blue line shows the position of the ice/water interface as a function of time. The ice/water interface advanced 3.3 ML during the pulse. (B) Expanded view of T(t) near Tmax.
Molecular dynamics simulations have been used to investigate the growth of CI in contact with the supercooled liquid with a variety of water models (37–43). An advantage of the simulations is that they can be done using various techniques to remove the latent heat generated by the crystallization (39, 40). As a result, G(T) can be investigated as a function of the (known) interface temperature. In this sense, the calculations can be more directly related to our measurements of G(T) than to earlier measurements of G(T) on macroscopic samples, and several simulations have observed a maximum in G(T) (38, 39, 42, 44). For example, simulations with TIP4P/ice, which has a melting point of 270 K, observed a maximum at 260 K and found that G(T) decreased by ∼50% by 245 K (39). Both of these results are in qualitative agreement with our measurements.
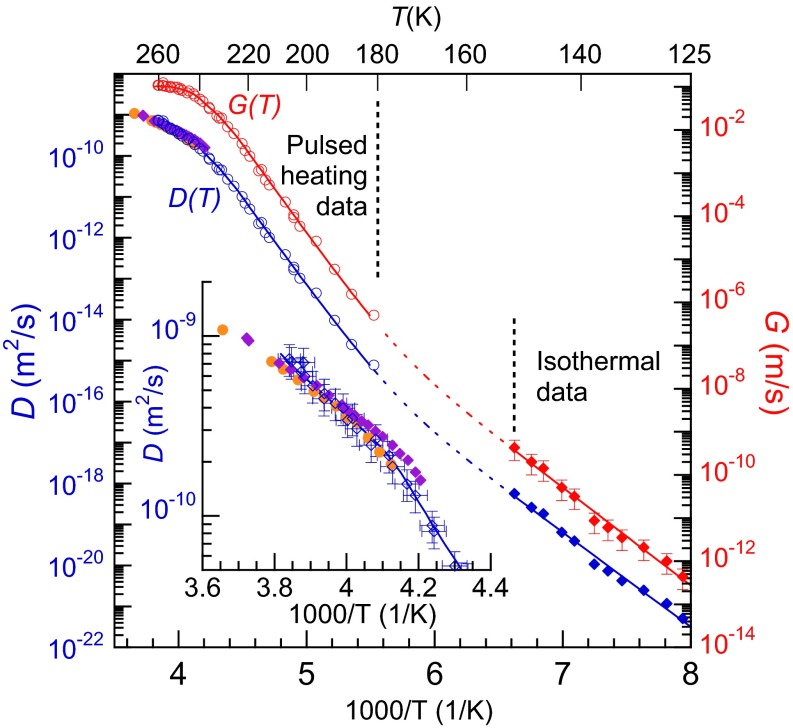
For T less than ∼180 K, G(T) is small enough to preclude measuring it via pulsed heating. However, G(T) can be measured directly in isothermal experiments at even lower temperatures (Isothermal Measurements) (35). Fig. 3 shows G(T) measured isothermally for 126 K ≤ T ≤ 151 K (red diamonds). The figure also displays the pulsed-heating data (red circles), which has been scaled for comparison (Isothermal Measurements). Collectively, these data span 11 orders of magnitude in G(T). It can be divided into three regions: (i) for T > 235 K, G(T) varies slowly with temperature but is clearly non-Arrhenius; (ii) for ∼180 K < T < 235 K, G(T) exhibits Arrhenius behavior with an activation energy of ∼76 kJ/mol; (iii) for T ≤ 151 K, G(T) is also Arrhenius but with a lower activation energy of ∼47 kJ/mol. In Fig. 3, for T < 225 K, the red line (solid and dashed), which is the sum of two Arrhenius functions with activation energies appropriate for the intermediate- and low-temperature regions, fits the data over that entire temperature range and suggests that the low-temperature data matches smoothly with G(T) determined from the pulsed-heating measurements.
Fig. 3.
D(T) and G(T) vs. inverse temperature. For T ≤ 151 K, G(T) was measured isothermally (red diamonds). The red circles show scaled to facilitate comparison with the isothermal data. For the region where no data are available, the red dashed line shows a possible form of G(T) as the sum of two Arrhenius functions fit to the data on either side of that region. D(T) (blue line) was determined from G(T) (red line) using the Wilson–Frenkel model. The blue circles and diamonds show the corresponding experimental values for D(T) converted from G(T) via the Wilson–Frenkel model. The orange circles and purple diamonds show previous measurements of D(T) (30, 57). (Inset) Expanded view of D(T) near the melting point. The values of D(T) extracted from the pulsed-heating experiments agree with the previously measured values within the uncertainties.
Although G(T) displayed in Figs. 2 and 3 is interesting in its own right, crystal growth is also intimately related to dynamics occurring in the supercooled liquid. In particular, crystal growth at a liquid/solid interface can be decomposed into a thermodynamic and a kinetic component (27, 28, 45). The thermodynamic component reflects the (net) probability that molecules from the liquid attach to the crystal. The kinetic component is related to the mobility of molecules at the liquid/solid interface, and it is often found that the growth rate is proportional to the diffusivity in the liquid (46, 47). Therefore, our measurements of G(T) can provide valuable insight into the dynamics of supercooled liquid water over a wide temperature range. When the temperature is well below the melting point and the thermodynamic driving force for crystallization is large, the growth rate can be described by the Wilson–Frenkel model:
| [2] |
where ΔGlx(Τ) is the difference in free energy between the liquid and crystalline phases and α is a constant (27–29). More information on the Wilson–Frenkel model is given in Wilson–Frenkel Growth Model. Because D(T) and ΔGlx(T) are known for T > 238 K, we can use our measured G(T) to determine α via Eq. 2 (Fig. S7). At lower temperatures where other techniques for measuring D(T) fail, it can be calculated using Eq. 2 and the measured G(T) (46). The blue line in Fig. 3 shows D(T) calculated with this procedure. Above 238 K, it agrees with known values of D(T) (Fig. 3, Inset), whereas at lower temperatures, ΔGlx(T) is weakly temperature-dependent and thus D(T) closely tracks G(T). There are several noteworthy aspects to these results. First, a power-law fit with a singularity at or near 228 K will not fit either G(T) or D(T) (Fig. S8). Thus, the stability-limit conjecture is incompatible with the current results. Second, the current results for D(T) are incompatible with Vogel–Fulcher–Tammann (VFT) fits such as those used by Price et al. (30) and Smith and Kay (48) (Fig. S8). Instead, D(T) exhibits a similar three-region temperature dependence as discussed above for G(T). Based on the activation energy in the low-temperature region, the fragility index at the glass transition temperature (Tg ∼ 136 K) is ∼18, which is consistent with previous measurements and corresponds to an extremely strong liquid (49).
Fig. S7.
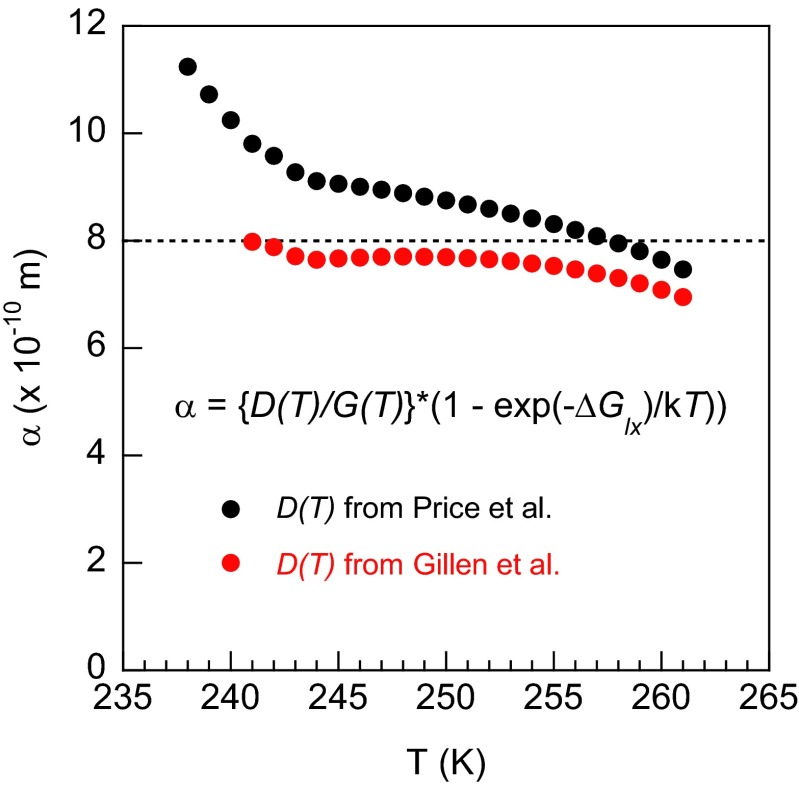
vs. temperature using previously reported results for D(T) from Gillen et al. (57) and Price et al. (30), and G(T) determined from our pulsed-heating measurements (Fig. 2). The data of Gillen et al. and Price et al. extend down to 242.5 and 237.8 K, respectively.
Fig. S8.
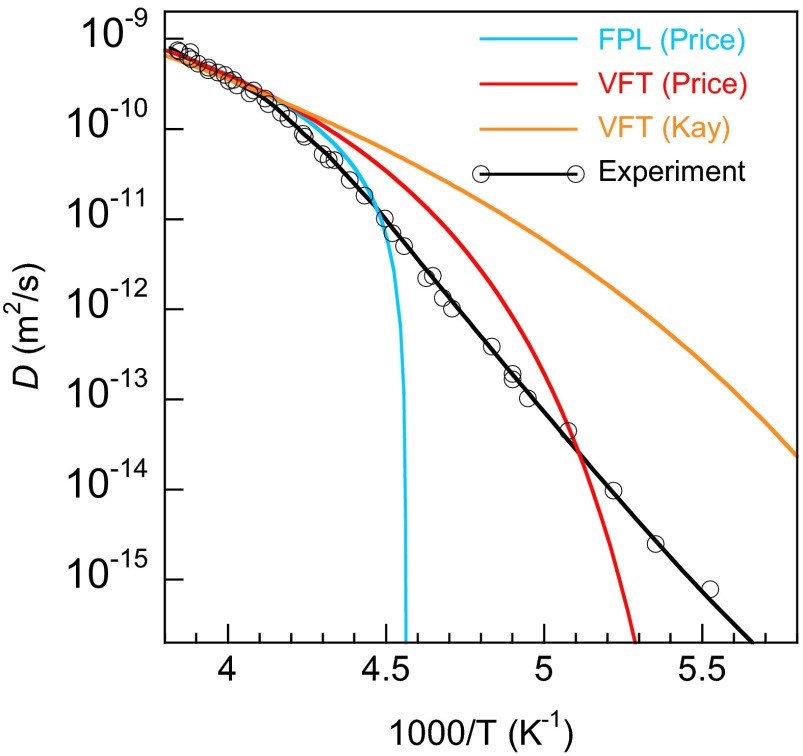
Self-diffusion vs. inverse temperature compared with functional forms proposed in the literature. The diffusion data (black circles)—determined from the growth rate measurements—does not match the fractional power law (FPL) or Vogel–Fulcher–Tammann (VFT) fits proposed based on diffusion measurements for T > 237 K (blue and red lines) (30) or for T ∼ 150 K (orange line) (48).
Discussion
Although using growth rates of the crystalline phase to extract the diffusivity in the liquid phase often works well (46, 47), it also fails in several cases, particularly near the glass transition temperature (50, 51). For example, the growth rate for tris-naphthylbenzene (TNB) tracks the self-diffusion at high temperatures but leads to an overestimate of it by approximately an order of magnitude near Tg (50). A similar level of uncertainty might apply for D(T) shown in Fig. 3, particularly for the isothermal measurements at T ≤ 151 K. Another potential issue with the Wilson–Frenkel model is related to the type of diffusion, namely, translational or rotational, that is involved in the ice growth. Although it is likely that both are involved, the relative importance of these, particularly near Tg, is currently debated (52, 53). On the other hand, the qualitative features displayed for D(T)—no singularity in the temperature dependence and a fragile-to-strong crossover at ∼235 K—are unlikely to be changed by any specific shortcomings of the Wilson–Frenkel model.
The complicated form of D(T) shown in Fig. 3 is qualitatively similar to a prediction by Starr et al. (6). Assuming a thermodynamically reversible connection between supercooled water and LDA, they used the entropy, specific heat, and enthalpy of water at 150 and 236 K to estimate the excess entropy, Sex(T), and the configurational entropy, Sconf(T), at intermediate temperatures, and then used Adam–Gibbs theory to calculate D(T). With this approach, they predicted a fragile-to-strong transition (or dynamic crossover) just below 236 K and a second crossover at ∼187 K to a lower activation energy, both of which agree with the current results. Fragile-to-strong crossovers have also been observed in molecular dynamics simulations at or near the corresponding maxima in Cp as expected from Adam–Gibbs theory (6, 7). The second crossover at ∼180 K, which is seen in both G(T) and D(T), might be associated with changes in the hydrogen-bonding network of the liquid water. For example, molecular dynamics simulations suggest that the average number of bonds, which is less than four at higher temperatures, approaches four at lower temperatures (54). Thus, one possibility is that the larger apparent activation energy for T > 180 K is associated with the mobility in the “defective” liquid and the decreasing number of bonds with increasing temperature. The smaller activation energy found for T < 180 K would then be associated with diffusion of molecules in a “fully” hydrogen-bonded liquid (i.e., with a fixed number of bonds).
The success of the Adam–Gibbs prediction for D(T) supports the hypothesis that the unusual thermodynamics of liquid water are also responsible for its dynamic anomalies. Our results appear to be consistent with either the critical-point–free scenario or a liquid–liquid critical point at positive pressures, as both are consistent with a continuous change in entropy across no man’s land. However, because the current experiments are continuous in G(T) and D(T), they provide no evidence for a liquid–liquid transition line extending to negative pressures (55). At low temperatures, our D(T) is considerably larger than the predictions of Starr et al. (6) However, as they noted, this is likely due to the breakdown of the Stokes–Einstein relationship, which is frequently observed for deeply supercooled liquids (56).
Conclusions
In summary, using a recently developed laser-heating technique, we have measured the growth rate of CI, G(T), across a large temperature range of no man’s land at low pressure. When these data are analyzed using the venerable Wilson–Frenkel theory of crystal growth, we are able to extract the self-diffusion coefficient, D(T), for supercooled water over the temperature range from 126 to 262 K. Over this range, G(T) and D(T) smoothly vary by ∼11 orders of magnitude with no evidence of a singularity. Instead, they exhibit three characteristic temperature dependencies clearly indicating a fragile-to-strong crossover at ∼233 K and a “strong-to-stronger” crossover at ∼180 K, which are qualitatively similar to an earlier prediction based on Adam–Gibbs theory (6). This approach affords the opportunity to explore deeply supercooled liquids in regions of the phase diagram that were previously inaccessible due to rapid crystallization.
Sample Preparation
All of the layered ice/water films for the growth rate measurements in the present work were prepared using the same procedure: in the first step, 77-monolayer (ML) amorphous solid water (ASW) films of H2O were prepared by vapor deposition on the Pt(111) substrate at 90 K using a molecular beam doser at normal incidence to the substrate. Previous research has shown that ASW films grown in these conditions are nonporous with a low surface area (i.e., relatively smooth) (58–65). Next, the films were crystallized by pulsed heating to a peak temperature of ∼235 K. Because ASW and crystalline-ice (CI) films have different IR signatures in both the OH- and the OD-stretching regions, the crystallization was monitored with infrared reflection absorption spectroscopy (IRAS). Fig. S1 (black line) shows the IRAS spectrum for a typical as-dosed ASW film. The OH-stretch region spans the range from 3,000 to 3,700 cm−1. After 3,500 laser pulses, the films crystallized and the coverage decreased to about 75 ML as a result of desorption during the pulsed-laser heating. The red line in Fig. S1 shows the IRAS spectrum for a crystallized film. The crystallization process produces a polycrystalline-ice film. Because the IR spectra for hexagonal ice and cubic ice are indistinguishable, the amount of these two phases in the crystallized films (or the extent of stacking faults within the ice grains) cannot be determined with our experimental setup. [Raman spectroscopy can be used to explore the extent of stacking disorder in CI (66).] In the next step, 25-ML ASW films were deposited on top of the CI “templates” at 60 K again at normal incidence using the same molecular beam doser, conditions that produce nonporous ASW films. Deposition at 60 K resulted in minimal crystallization during the deposition. Control experiments in which the 25-ML ASW films were deposited at 90 K showed that there was some crystallization that occurred at the CI/ASW interface during deposition, but the subsequent growth of the CI during pulsed heating was essentially identical to results presented in Fig. 2. The composition of these ASW films was 90.25% H2O, 9.5% HDO, and 0.25% D2O. (Films with this composition will be referred to as “9.5% HDO.”) After dosing the ASW layer, the sample temperature was raised to 90 K and IRAS spectra were obtained (Fig. S1, purple line). For these films, most of the HDO are surrounded by H2O and these “isolated” HDO give rise to a relatively narrow peak in OD-stretch region (i.e., from 2,350 to 2,550 cm−1) whose shape is also sensitive to the phase of the water (crystalline or amorphous). This sample configuration, with its CI/ASW interface, is the starting point for the measurements of the CI growth rate.
The measured growth rates are only weakly dependent on the method for preparing the CI template. For example, we have prepared 75-ML CI films on a hydrophobic graphene/Pt(111) substrate and measured the ice growth rate using the same methods described above. For those experiments, the growth rates are the same as those shown in Fig. 2 to within 20%. We have also prepared the crystalline-ice template by vapor deposition on the Pt(111) at 140 K (63, 65, 67, 68). In that case, the as-deposited ice films are also polycrystalline where the crystallites preferentially expose the basal plane of hexagonal ice or the (111) plane of cubic ice to the vacuum (67, 68). The measured growth rates are again very similar to results shown in Fig. 2. Because changing the conditions for preparing the ice template leads to changes in the structure of the polycrystalline-ice template (e.g., different distributions of crystallite sizes and orientations), modest changes in the resulting growth rates at the ice/water interface are not too surprising. However, these control experiments indicate that the primary observations—a continuous decrease in the growth rate and a crossover from fragile to strong temperature dependence—are independent of the details of the polycrystalline-ice films.
For Tmax < ∼195 K, the growth rate is low, and therefore the experiments took 24 h or longer to complete. For such long experiments, adsorption of water from the background pressure within the chamber is potentially a problem. Thus, for the experiments with Tmax < 195 K, the water films were capped with a layer of decane (∼5 ML) to prevent adventitious water adsorption. Because some energy is transferred to the decane layer during the pulsed heating, the addition of the decane layer produced a small change in the temperature at the ice/water interface (for which a correction was applied), but had no other noticeable effect on the growth rate. Fig. S2 shows measured with (red circles) and without (black circles) the decane cap. The fact that the decane cap has no appreciable effect on the growth rate indicates that ice nucleation and growth at the water/vacuum (or water/decane) interface is not important. Other control experiments (described below, Ice Nucleation) also support this conclusion.
Temperature Calibration
The details of the calibration procedure for determining the temperature vs. time, T(t), for the pulsed-laser–heating experiments have been described in detail previously (26). Briefly, T(t) is calculated by solving the heat conduction equation using the measured intensity vs. time for the incident laser pulses, the optical penetration depth of the IR light in platinum, and the known thermal properties for platinum and CI. Not all of the thermal properties for deeply supercooled water are known. We used the heat capacity values suggested by Murphy and Koop (22), and assumed that the thermal conductivity of supercooled water is constant (69). The calculated T(t) was verified by comparison with the measured change in reflectivity vs. time of the transiently heated platinum surface. For the experiments reported here, T(t) for each laser pulse energy and its corresponding Tmax were determined by measuring the desorption rate (i.e., in molecules per square meter per pulse) for each film after the crystallization process was complete. The desorption per pulse from the CI film is related to the temperature vs. time at the vacuum interface, Tvac(t), during the heat pulse and the vapor pressure of CI vs. temperature (22). For each experiment, Tvac(t) was determined by comparing the measured desorption per pulse to the desorption per pulse calculated for different T(t) curves (corresponding to different maximum temperatures). The growth rate measurements are sensitive to the temperature at the ice/water interface, Tint(t), not the temperature at the vacuum interface. Therefore, corrections were applied to account for the thickness of the CI layer and the temperature drop across the liquid water layer. [The temperature gradients across the CI and supercooled water layers were determined from measurements of the desorption rate as a function of thickness in independent experiments (26).] These corrections were relatively small. For example, the maximum temperature at the CI/water interface, Tmax, was lower than the maximum temperature at the vacuum interface by 1.0 K for Tmax = 200 K and 1.7 K for Tmax = 262 K.
The optical system for the laser is designed to deliver a laterally uniform pulse to the sample (i.e., a “top-hat” beam profile). However, there are some lateral variations in the beam that produce lateral variations in T(t). The lateral variations in the pulsed heating have been characterized and described in detail previously (26). The key result for the current experiment is that the lateral variation in laser energy is ∼2.7% leading to lateral temperature variations within the water films of ±2.8 K at Tmax = 200 K and ±4.2 K at Tmax = 260 K. The measured growth rates are the laterally averaged growth rates, and the reported maximum temperatures (i.e., Tmax) are the laterally averaged maximum temperatures.
Once the temperature of the Pt substrate exceeds 273 K, melting begins at the ice/Pt interface. To avoid this complication, the experiments were limited to laser powers where the maximum temperature was less than 273 K throughout the film. To account for the lateral temperature variations and the other experimental uncertainties, we performed experiments with (average) maximum temperatures at the vacuum interface <263 K for the crystallized 100-ML CI films, corresponding to Tmax ≤ 261 K at the water/ice interface for the growth rate measurements.
Determination of Growth Rates from IRAS Spectra
Fig. S3 A and B show IRAS spectra in the OH-stretch and OD-stretch regions for growth rate measurements with Tmax = 225 K. The crystallization of the (initially) ASW/liquid layer was determined from the IRAS spectra by fitting them to a linear combination of the as-grown film (75-ML CI capped with 25-ML ASW) and the fully crystallized, 100-ML CI film. Fig. S3B shows an example of the fitting results in the isolated OD-stretch region. The initial and final spectra are shown by the black and red lines, respectively. Because the 75-ML CI film is pure H2O, it does not contribute to the signal in the OD-stretch region. Several of the spectra at intermediate stages of the CI growth are shown by the blue lines in Fig. S3B, and the fitted spectra are shown by the dashed green lines. For this experiment, the amounts crystallized were 3.4, 8.3, 15.4, and 22.9 ML after 30, 70, 150, and 500 heat pulses, respectively. The IRAS spectra can also be fit in the OH-stretch region to a linear combination of the as-grown and fully crystallized spectra (not shown). Fig. S3C shows the amount crystallized vs. the number of laser pulses as determined from the OH- and OD-stretch regions (red and black, respectively). The growth rates determined from the two regions of the IRAS spectra are nearly identical. To convert the measured growth rates in monolayers per pulse to meters per pulse, we used 1 ML = 3 × 10⁻¹⁰ m.
In Fig. 1E and Fig. S3C, the amount crystallized initially increases approximately linearly, but then slows down as the crystallization nears completion. For an ideal experiment, we would expect the amount crystallized to increase linearly until the entire film had crystallized. Several factors contribute to the observed deviations from this ideal behavior. First, the crystalline-ice template underneath the 25-ML ASW film is polycrystalline, and thus the crystallized 25-ML layer is also polycrystalline. Because the crystallization kinetics for water trapped between grain boundaries, so called “frustrated water,” (43, 70) are different from for water at a flat ice/liquid interface, this affects the observed kinetics. Also, lateral variations in the temperature (26) will lead to the hotter regions of the film crystallizing faster than the colder regions, again adding to the deviations from linearity. Other factors, including differing growth rates for different crystallographic faces of ice and Ostwald ripening, will also lead to deviations from ideal behavior.
Isothermal Measurements
To measure G(T) for T ≤ 151 K, 100-ML water films composed of 75-ML CI and 25-ML ASW (with 9.5% HDO) were prepared using the same procedure as for the pulsed-heating measurements and then capped with a thin decane layer. The films were then set to the desired temperature (e.g., 145 K) and the IRAS spectra were obtained as a function of time. For these isothermal measurements, the temperature gradients within the films were negligible. The growth of the CI was then determined by fitting the resulting IRAS spectra to a linear combination of the initial and final films using the same procedure as for the pulsed-heating experiments. The results obtained here are qualitatively and quantitatively similar to previous measurements of G(T) for T < 155 K (35, 71, 72). Previous research has investigated the crystallization kinetics of hyperquenched glassy water (73, 74), ASW (75), and low- and high-density amorphous ices (LDA and HDA, respectively) (76). For these experiments, the films are (nominally) amorphous at the beginning of the experiments and the crystallization proceeds via nucleation of the crystalline phase and its subsequent growth. Because the volume nucleation rates and growth rates have not been independently determined for those experiments, the reported rate constants cannot be directly compared with the growth rate measurements presented here.
The growth rates measured with the pulsed heating, , are related to G(T) through Eq. 1 in the main text: . Using the form of G(T) shown in Figs. 2 and 3 (red lines), produces the black line fit, , to the data shown in Fig. 2. For any given measurement, the ratio gives us the deviation of the measured result from the result expected from Eq. 1. This factor is then used to map data points from Fig. 2 [] into the “data” points for G(T) shown in Fig. 3 for T ≥ 181 K.
Ice Nucleation
Several control experiments were performed to verify that the crystallization observed in the present study is due to growth at the ice/water interface. As described above, the typical experiments used water that contained 9.5% HDO to track the crystallization of the 25-ML (initially) ASW layer (Fig. S4A, film 1). In another set of experiments, only 10 ML of the 25-ML ASW layer was isotopically labeled, and the rest was pure H2O (Fig. S4A, films 2 and 3). When the 10-ML 9.5% HDO layer was deposited directly on the crystalline-ice template (Fig. S4A, film 2), crystallization measured via the HDO signal began immediately upon pulsed heating (Fig. S4C, red line), indicating crystallization at the ice/water interface. However, when the 10-ML 9.5% HDO layer was deposited on top of the 15-ML pure H2O (Fig. S4A, film 3), crystallization measured via the HDO signal was delayed (Fig. S4C, purple line) because no HDO is initially located at the ice/water interface. For these experiments, diffusion within the liquid layer during the heat pulse will destroy the isotopic layering that was imposed when the films were deposited. If diffusion within the layer is appreciable compared with the growth rate at the ice/water interface, then for film 3 crystallization measure via the HDO signal should start before the ice/water interface has advanced 15 ML. For T = 225 K, our results give D(T) ∼ 1.6 × 10⁻¹¹ m2/s (Fig. 3). In that case, the number of pulses required for an HDO molecule to diffuse through the 15-ML pure H2O layer, N15, would be approximately , where x15 is the thickness of the 15-ML H2O layer (∼4.5 × 10⁻⁹ m) and δtp is the pulse duration (∼10−8 s). This estimate of a short delay before the beginning of some HDO molecules reaching the ice/water agrees with the observations (Fig. S4C, purple line). For all three cases, crystallization measured via the OH-stretch was the same within the experimental uncertainties associated with setting the maximum temperature (Fig. S4B). (Specifically, the different growth rates correspond to maximum temperatures of 225 ± 1 K.)
Nucleation of the crystalline phase within the liquid layer is another factor that could potentially affect the growth rate measurements presented here. To test for this possibility, we have investigated the crystallization kinetics for liquid-water films that are not in contact with a crystalline-ice template. Fig. S5 shows an example where a 100-ML ASW film was deposited on the Pt(111) substrate at 90 K. The crystallization of the film due to pulsed heating to 225 K was then monitored with IRAS vs. the number of laser pulses. The sigmoidal crystallization kinetics for the 100-ML ASW film suggests the crystallization proceeds by volume nucleation and growth (often referred to as “Avrami kinetics”) (77, 78). For comparison, Fig. S5 also shows the crystallization for Tmax = 225 K of a 25-ML ASW film deposited on a 75-ML CI template. For the 100-ML ASW film, the induction period before onset of appreciable crystallization is comparable to the time required to crystallize most of the 25-ML ASW film deposited on the CI template, indicating that nucleation of the crystalline phase within the 25-ML ASW layer does not significant affect the growth rate measurements. (Note that the 100-ML ASW film has four times more material in which to create new crystalline nuclei; therefore, this control experiment overestimates the possible effect of volume nucleation on the growth rate measurements. Measuring the volume nucleation rate in no man’s land is currently under investigation and will be reported in a future publication.)
The results in Fig. 1E, Fig. S3C, and Fig. S4B showing the amount crystallized vs. Np can be recast as the fraction of the water layer that has crystallized, fCI, vs. Np. In that case, the current results resemble the phase transformation model developed by Kolmogorov, Johnson and Mehl, and Avrami (77–79). Within that model, , where kAv is the effective crystallization rate constant and n is the “Avrami exponent.” Comparing this functional form to our results (with t replaced by Np) would suggest that n ∼ 1. However, this comparison is misleading because our experiment involves growth from a well-defined interface (i.e., a constant-velocity growth front without bulk nucleation), whereas the model assumes nucleation occurs at sites that are randomly distributed throughout the material and that growth proceeds from these sites.
Latent Heat of Fusion
Previous experiments have investigated the growth of CI from supercooled liquid water (32–34, 80, 81). For growth rate measurements with macroscopic amounts of water, the latent heat of fusion raises the temperature at the ice/water interface and establishes a temperature gradient that allows this energy to be conducted away from the interface as growth proceeds. In many of these experiments, the reported growth rates are with respect to the temperature of the bulk of the supercooled water and not the temperature at the ice/water interface. For simple cases (e.g., planar interfaces), corrections can be applied to derive the temperature at the ice/water interface. However, for other cases (e.g., dendritic growth), determining the temperature at the interface is more challenging. In either case, the heat released by the crystallization limits the minimum temperature achieved at the ice/water interface. As a result, experiments with macroscopic samples have only recently seen the first evidence of the maximum in G(T) that is expected from theory (34).
For the pulsed-heating experiments reported here, essentially all of the energy from the incident laser is initially absorbed in the platinum substrate close to the Pt/ice interface. Only a relatively small amount of this incident energy is subsequently transferred to the adsorbate layer, and the rest diffuses deeper into the platinum substrate. Therefore, T(t) is, to a large extent, determined by the thermal properties of the platinum substrate. The latent heat of fusion that is released by crystallization at the ice/water interface is relatively small compared with the energy flowing into (and then out of) the adsorbate layer during the pulsed heating. As a result, it has only a small effect on T(t). To verify this, we have run simulations of the pulsed heating to determine T(t) at the ice/water interface with and without the latent heat of fusion. The black line in Fig. S6 shows T(t) with Tmax = 259.6 K that included ice growth and the release of the latent heat of fusion. The red line shows the same calculation except no growth was allowed and no latent heat was released. In this case, Tmax = 259.1 K. Because G(T) is large for Tmax of ∼259 K, the latent heat release is also large compared with the heat released at lower temperatures where G(T) is much smaller. Therefore, these simulations show that latent heat of fusion has only a small effect on the temperature at the ice/water interface over the entire range of interest.
Wilson–Frenkel Growth Model
Jackson suggests that the crystal growth rate, G(T), can be described as the product of four terms: (i) a thermodynamic driving force; (ii) a length; (iii) an attempt frequency, ν, at the liquid–solid interface; and (iv) a factor, f, that accounts for the structure at the interface (79). In the Wilson–Frenkel (WF) model, the length, d, is related to the width of the liquid–solid interface (or the diameter of the molecule), and f is a number between 0 and 1 that reflects the probability that a molecule hits the crystal at growth site with the proper orientation. The attempt frequency is assumed to be related to the diffusion occurring in the liquid: ν = D(T)/λ2, where λ is the diffusion jump length in the liquid (27, 29, 45, 79), and the thermodynamic driving force for crystallization is given by (), corresponding to a simple activated process (45, 79). For temperatures well below the melting point where the thermodynamic driving force is large, the molecules can attach to the crystal at almost any site (e.g., step edges are not required) and WF model (or “normal” growth model) is appropriate. In that case,
| [S1] |
where α = λ2/(fd) (29, 45, 79). α is expected to be about the size of a molecule and only weakly temperature dependent. Gillen et al. (57) and Price et al. (30) used NMR spectroscopy to measure D(T) for temperatures as low as ∼238 K. Fig. S7 shows , where G(T) is taken from our pulsed-heating experiments, D(T) is from the NMR experiments, and the vapor pressures of water and ice (e.g., ref. 22) were used to compute ΔGlx(T). For both NMR datasets, α is approximately constant and its size is comparable to molecular dimensions, as expected. For the results presented in Fig. 3, α was set to 8 × 10⁻¹⁰ m (Fig. S7, dashed line).
Fractional Power Law and Vogel–Fulcher–Tammann Fits to D(T)
Fig. S8 shows D(T) determined from the pulsed-heating growth rate measurements and the Wilson–Frenkel growth model (black circles and black line). Price et al. (30) fit their D(T) data with a fractional power law (FPL) (Fig. S8, blue line). The form they used for the FPL is as follows:
| [S2] |
with D0 = 7.66 × 10⁻¹⁰ m2/s, Ts = 219.2 K, and γ = 1.74. Price et al. also fit their results with the Vogel–Fulcher–Tammann (VFT) equation (Fig. S8, red line):
| [S3] |
with D0 = 4.0 × 10⁻⁸ m2/s, EVFT = 371 K, and T0 = 169.7 K. Smith and Kay measured D(T) in isotopically layered films for T ∼ 150 K and found that their low-temperature measurements could be smoothly connected with the measured values of D(T) near the melting point (48). The orange line in Fig. S8 shows D(T) determined from their VFT fit. However, subsequent experiments showing that the (uncontrolled) crystallization that occurred concomitantly with diffusion at ∼150 K affected the D(T) measurements and their analysis (82). As seen in Fig. S8, none of these fits matches the experimental results for T < 230 K.
Acknowledgments
This work was supported by the US Department of Energy, Office of Science, Office of Basic Energy Sciences, Division of Chemical Sciences, Geosciences, and Biosciences. Pacific Northwest National Laboratory (PNNL) is a multiprogram national laboratory operated for Department of Energy by Battelle. The research was performed using Environmental Molecular Sciences Laboratory, a national scientific user facility sponsored by the Department of Energy’s Office of Biological and Environmental Research and located at PNNL.
Footnotes
The authors declare no conflict of interest.
This article is a PNAS Direct Submission.
This article contains supporting information online at www.pnas.org/lookup/suppl/doi:10.1073/pnas.1611395114/-/DCSupplemental.
References
- 1.Speedy RJ, Angell CA. Isothermal compressibility of supercooled water and evidence for a thermodynamic singularity at −45 C. J Chem Phys. 1976;65:851–858. [Google Scholar]
- 2.Speedy RJ. Stability-limit conjecture. An interpretation of the properties of water. J Chem Phys. 1982;86:982–991. [Google Scholar]
- 3.Poole PH, Sciortino F, Essmann U, Stanley HE. Phase behavior of metastable water. Nature. 1992;360(6402):324–328. [Google Scholar]
- 4.Scala A, Starr FW, La Nave E, Sciortino F, Stanley HE. Configurational entropy and diffusivity of supercooled water. Nature. 2000;406(6792):166–169. doi: 10.1038/35018034. [DOI] [PubMed] [Google Scholar]
- 5.Debenedetti PG. Supercooled and glassy water. J Phys Condens Matter. 2003;15(45):R1669–R1726. [Google Scholar]
- 6.Starr FW, Angell CA, Stanley HE. Prediction of entropy and dynamic properties of water below the homogeneous nucleation temperature. Physica A. 2003;323:51–66. [Google Scholar]
- 7.Xu L, et al. Relation between the Widom line and the dynamic crossover in systems with a liquid-liquid phase transition. Proc Natl Acad Sci USA. 2005;102(46):16558–16562. doi: 10.1073/pnas.0507870102. [DOI] [PMC free article] [PubMed] [Google Scholar]
- 8.Kumar P, et al. Relation between the Widom line and the breakdown of the Stokes-Einstein relation in supercooled water. Proc Natl Acad Sci USA. 2007;104(23):9575–9579. doi: 10.1073/pnas.0605880103. [DOI] [PMC free article] [PubMed] [Google Scholar]
- 9.Mallamace F, et al. NMR evidence of a sharp change in a measure of local order in deeply supercooled confined water. Proc Natl Acad Sci USA. 2008;105(35):12725–12729. doi: 10.1073/pnas.0805032105. [DOI] [PMC free article] [PubMed] [Google Scholar]
- 10.Angell CA. Insights into phases of liquid water from study of its unusual glass-forming properties. Science. 2008;319(5863):582–587. doi: 10.1126/science.1131939. [DOI] [PubMed] [Google Scholar]
- 11.Limmer DT, Chandler D. The putative liquid-liquid transition is a liquid-solid transition in atomistic models of water. J Chem Phys. 2011;135(13):134503. doi: 10.1063/1.3643333. [DOI] [PubMed] [Google Scholar]
- 12.Palmer JC, et al. Metastable liquid-liquid transition in a molecular model of water. Nature. 2014;510(7505):385–388. doi: 10.1038/nature13405. [DOI] [PubMed] [Google Scholar]
- 13.Nilsson A, Pettersson LGM. The structural origin of anomalous properties of liquid water. Nat Commun. 2015;6:8998. doi: 10.1038/ncomms9998. [DOI] [PMC free article] [PubMed] [Google Scholar]
- 14.Chandler D. Metastability and no criticality. Nature. 2016;531(7593):E1–E2. doi: 10.1038/nature16539. [DOI] [PubMed] [Google Scholar]
- 15.Johari GP, Teixeira J. Thermodynamic analysis of the two-liquid model for anomalies of water, HDL-LDL fluctuations, and liquid-liquid transition. J Phys Chem B. 2015;119(44):14210–14220. doi: 10.1021/acs.jpcb.5b06458. [DOI] [PubMed] [Google Scholar]
- 16.Palmer JC, et al. Palmer et al. reply. Nature. 2016;531(7593):E2–E3. doi: 10.1038/nature16540. [DOI] [PubMed] [Google Scholar]
- 17.Smallenburg F, Sciortino F. Tuning the liquid-liquid transition by modulating the hydrogen-bond angular flexibility in a model for water. Phys Rev Lett. 2015;115(1):015701. doi: 10.1103/PhysRevLett.115.015701. [DOI] [PubMed] [Google Scholar]
- 18.Poole PH, Sciortino F, Grande T, Stanley HE, Angell CA. Effect of hydrogen bonds on the thermodynamic behavior of liquid water. Phys Rev Lett. 1994;73(12):1632–1635. doi: 10.1103/PhysRevLett.73.1632. [DOI] [PubMed] [Google Scholar]
- 19.Sastry S, Debenedetti PG, Sciortino F, Stanley HE. Singularity-free interpretation of the thermodynamics of supercooled water. Phys Rev E Stat Phys Plasmas Fluids Relat Interdiscip Topics. 1996;53(6):6144–6154. doi: 10.1103/physreve.53.6144. [DOI] [PubMed] [Google Scholar]
- 20.Adam G, Gibbs JH. On the temperature dependence of cooperative relaxation properties in glass-forming liquids. J Chem Phys. 1965;43(1):139–146. [Google Scholar]
- 21.Limmer DT, Chandler D. Corresponding states for mesostructure and dynamics of supercooled water. Faraday Discuss. 2013;167:485–498. doi: 10.1039/c3fd00076a. [DOI] [PubMed] [Google Scholar]
- 22.Murphy DM, Koop T. Review of the vapour pressures of ice and supercooled water for atmospheric applications. Q J R Meteorol Soc. 2005;131(608):1539–1565. [Google Scholar]
- 23.Mishima O, Stanley HE. The relationship between liquid, supercooled and glassy water. Nature. 1998;396(6709):329–335. [Google Scholar]
- 24.Chen S-H, et al. The violation of the Stokes-Einstein relation in supercooled water. Proc Natl Acad Sci USA. 2006;103(35):12974–12978. doi: 10.1073/pnas.0603253103. [DOI] [PMC free article] [PubMed] [Google Scholar]
- 25.Mallamace F, et al. The fragile-to-strong dynamic crossover transition in confined water: Nuclear magnetic resonance results. J Chem Phys. 2006;124(16):161102. doi: 10.1063/1.2193159. [DOI] [PubMed] [Google Scholar]
- 26.Xu Y, et al. A nanosecond pulsed laser heating system for studying liquid and supercooled liquid films in ultrahigh vacuum. J Chem Phys. 2016;144(16):164201. doi: 10.1063/1.4947304. [DOI] [PubMed] [Google Scholar]
- 27.Broughton JQ, Gilmer GH, Jackson KA. Crystallization rates of a Lennard-Jones liquid. Phys Rev Lett. 1982;49(20):1496–1500. [Google Scholar]
- 28.Cahn JW, Hillig WB, Sears GW. Molecular mechanism of solidification. Acta Metall. 1964;12(12):1421–1439. [Google Scholar]
- 29.García Fernández R, Abascal JLF, Vega C. The melting point of ice Ih for common water models calculated from direct coexistence of the solid-liquid interface. J Chem Phys. 2006;124(14):144506. doi: 10.1063/1.2183308. [DOI] [PubMed] [Google Scholar]
- 30.Price WS, Ide H, Arata Y. Self-diffusion of supercooled water to 238 K using PGSE NMR diffusion measurements. J Phys Chem A. 1999;103(4):448–450. [Google Scholar]
- 31.Dash JG, Rempel AW, Wettlaufer JS. The physics of premelted ice and its geophysical consequences. Rev Mod Phys. 2006;78(3):695–741. [Google Scholar]
- 32.Pruppacher HR. Interpretation of experimentally determined growth rates of ice crystals in supercooled water. J Chem Phys. 1967;47(5):1807–1813. [Google Scholar]
- 33.Shibkov AA, Zheltov MA, Korolev AA, Kazakov AA, Leonov AA. Crossover from diffusion-limited to kinetics-limited growth of ice crystals. J Cryst Growth. 2005;285(1-2):215–227. [Google Scholar]
- 34.Buttersack T, Bauerecker S. Critical radius of supercooled water droplets: On the transition toward dendritic freezing. J Phys Chem B. 2016;120(3):504–512. doi: 10.1021/acs.jpcb.5b09913. [DOI] [PubMed] [Google Scholar]
- 35.Safarik DJ, Meyer RJ, Mullins CB. Thickness dependent crystallization kinetics of sub-micron amorphous solid water films. J Chem Phys. 2003;118(10):4660–4671. [Google Scholar]
- 36.Jackson KA, Uhlmann DR, Hunt JD. On the nature of crystal growth from the melt. J Cryst Growth. 1967;1(1):1–36. [Google Scholar]
- 37.Choi S, Jang E, Kim JS. In-layer stacking competition during ice growth. J Chem Phys. 2014;140(1):014701. doi: 10.1063/1.4852180. [DOI] [PubMed] [Google Scholar]
- 38.Rozmanov D, Kusalik PG. Anisotropy in the crystal growth of hexagonal ice, Ih. J Chem Phys. 2012;137(9):094702. doi: 10.1063/1.4748377. [DOI] [PubMed] [Google Scholar]
- 39.Weiss VC, Rullich M, Köhler C, Frauenheim T. Kinetic aspects of the thermostatted growth of ice from supercooled water in simulations. J Chem Phys. 2011;135(3):034701. doi: 10.1063/1.3609768. [DOI] [PubMed] [Google Scholar]
- 40.English NJ. Massively parallel molecular-dynamics simulation of ice crystallisation and melting: The roles of system size, ensemble, and electrostatics. J Chem Phys. 2014;141(23):234501. doi: 10.1063/1.4903786. [DOI] [PubMed] [Google Scholar]
- 41.Nada H, Furukawa Y. Anisotropic growth kinetics of ice crystals from water studied by molecular dynamics simulation. J Cryst Growth. 1996;169(3):587–597. [Google Scholar]
- 42.Nistor RA, Markland TE, Berne BJ. Interface-limited growth of heterogeneously nucleated ice in supercooled water. J Phys Chem B. 2014;118(3):752–760. doi: 10.1021/jp408832b. [DOI] [PubMed] [Google Scholar]
- 43.Hudait A, Qiu S, Lupi L, Molinero V. Free energy contributions and structural characterization of stacking disordered ices. Phys Chem Chem Phys. 2016;18(14):9544–9553. doi: 10.1039/c6cp00915h. [DOI] [PubMed] [Google Scholar]
- 44.Rozmanov D, Kusalik PG. Temperature dependence of crystal growth of hexagonal ice (Ih) Phys Chem Chem Phys. 2011;13(34):15501–15511. doi: 10.1039/c1cp21210a. [DOI] [PubMed] [Google Scholar]
- 45.Nascimento ML, Zanotto ED. Does viscosity describe the kinetic barrier for crystal growth from the liquidus to the glass transition? J Chem Phys. 2010;133(17):174701. doi: 10.1063/1.3490793. [DOI] [PubMed] [Google Scholar]
- 46.Ngai KL, Magill JH, Plazek DJ. Flow, diffusion and crystallization of supercooled liquids: Revisited. J Chem Phys. 2000;112(4):1887–1892. [Google Scholar]
- 47.Mapes MK, Swallen SF, Ediger MD. Self-diffusion of supercooled o-terphenyl near the glass transition temperature. J Phys Chem B. 2006;110(1):507–511. doi: 10.1021/jp0555955. [DOI] [PubMed] [Google Scholar]
- 48.Smith RS, Kay BD. The existence of supercooled liquid water at 150 K. Nature. 1999;398:788–791. [Google Scholar]
- 49.Amann-Winkel K, et al. Water’s second glass transition. Proc Natl Acad Sci USA. 2013;110(44):17720–17725. doi: 10.1073/pnas.1311718110. [DOI] [PMC free article] [PubMed] [Google Scholar]
- 50.Swallen SF, Traynor K, McMahon RJ, Ediger MD, Mates TE. Self-diffusion of supercooled tris-naphthylbenzene. J Phys Chem B. 2009;113(14):4600–4608. doi: 10.1021/jp808912e. [DOI] [PubMed] [Google Scholar]
- 51.Sun Y, Xi H, Ediger MD, Yu L. Diffusionless crystal growth from glass has precursor in equilibrium liquid. J Phys Chem B. 2008;112(3):661–664. doi: 10.1021/jp709616c. [DOI] [PubMed] [Google Scholar]
- 52.Hill CR, et al. Neutron scattering analysis of water’s glass transition and micropore collapse in amorphous solid water. Phys Rev Lett. 2016;116(21):215501. doi: 10.1103/PhysRevLett.116.215501. [DOI] [PubMed] [Google Scholar]
- 53.Shephard JJ, Salzmann CG. Molecular reorientation dynamics govern the glass transitions of the amorphous ices. J Phys Chem Lett. 2016;7(12):2281–2285. doi: 10.1021/acs.jpclett.6b00881. [DOI] [PubMed] [Google Scholar]
- 54.Starr FW, et al. Thermodynamic and structural aspects of the potential energy surface of simulated water. Phys Rev E Stat Nonlin Soft Matter Phys. 2001;63(4 Pt 1):041201. doi: 10.1103/PhysRevE.63.041201. [DOI] [PubMed] [Google Scholar]
- 55.Pallares G, et al. Anomalies in bulk supercooled water at negative pressure. Proc Natl Acad Sci USA. 2014;111(22):7936–7941. doi: 10.1073/pnas.1323366111. [DOI] [PMC free article] [PubMed] [Google Scholar]
- 56.Ediger MD, Harrowell P. Perspective: Supercooled liquids and glasses. J Chem Phys. 2012;137(8):080901. doi: 10.1063/1.4747326. [DOI] [PubMed] [Google Scholar]
- 57.Gillen KT, Douglass DC, Hoch JR. Self-diffusion in liquid water to −31 C. J Chem Phys. 1972;57(12):5117–5119. [Google Scholar]
- 58.Stevenson KP, Kimmel GA, Dohnálek Z, Smith RS, Kay BD. Controlling the morphology of amorphous solid water. Science. 1999;283(5407):1505–1507. doi: 10.1126/science.283.5407.1505. [DOI] [PubMed] [Google Scholar]
- 59.Kimmel GA, Dohnálek Z, Stevenson KP, Smith RS, Kay BD. Control of amorphous solid water morphology using molecular beams—II: Ballistic deposition simulations. J Chem Phys. 2001;114:5295–5303. [Google Scholar]
- 60.Kimmel GA, Stevenson KP, Dohnálek Z, Smith RS, Kay BD. Control of amorphous solid water morphology using molecular beams—I: Experimental results. J Chem Phys. 2001;114:5284–5294. [Google Scholar]
- 61.Dohnálek Z, Kimmel GA, Ayotte P, Smith RS, Kay BD. The deposition angle-dependent density of amorphous solid water films. J Chem Phys. 2003;118(1):364–372. [Google Scholar]
- 62.Smith RS, et al. Molecular beam studies of nanoscale films of amorphous solid water. In: Buch V, Devlin JP, editors. Water in Confining Geometries, Cluster Physics. Springer; Berlin: 2003. pp. 337–357. [Google Scholar]
- 63.Kimmel GA, Petrik NG, Dohnálek Z, Kay BD. Crystalline ice growth on Pt(111): Observation of a hydrophobic water monolayer. Phys Rev Lett. 2005;95(16):166102. doi: 10.1103/PhysRevLett.95.166102. [DOI] [PubMed] [Google Scholar]
- 64.Kimmel GA, Petrik NG, Dohnálek Z, Kay BD. Layer-by-layer growth of thin amorphous solid water films on Pt(111) and Pd(111) J Chem Phys. 2006;125(4):44713. doi: 10.1063/1.2218844. [DOI] [PubMed] [Google Scholar]
- 65.Kimmel GA, Petrik NG, Dohnálek Z, Kay BD. Crystalline ice growth on Pt(111) and Pd(111): Nonwetting growth on a hydrophobic water monolayer. J Chem Phys. 2007;126(11):114702. doi: 10.1063/1.2672869. [DOI] [PubMed] [Google Scholar]
- 66.Carr THG, Shephard JJ, Salzmann CG. Spectroscopic signature of stacking disorder in ice I. J Phys Chem Lett. 2014;5(14):2469–2473. doi: 10.1021/jz500996p. [DOI] [PubMed] [Google Scholar]
- 67.Thurmer K, Bartelt NC. Growth of multilayer ice films and the formation of cubic ice imaged with STM. Phys Rev B. 2008;77(19):195425. [Google Scholar]
- 68.Thürmer K, Bartelt NC. Nucleation-limited dewetting of ice films on Pt(111) Phys Rev Lett. 2008;100(18):186101. doi: 10.1103/PhysRevLett.100.186101. [DOI] [PubMed] [Google Scholar]
- 69.Kumar P, Stanley HE. Thermal conductivity minimum: A new water anomaly. J Phys Chem B. 2011;115(48):14269–14273. doi: 10.1021/jp2051867. [DOI] [PubMed] [Google Scholar]
- 70.Jenniskens P, Banham SF, Blake DF, McCoustra MRS. Liquid water in the domain of cubic crystalline ice Ic. J Chem Phys. 1997;107(4):1232–1241. doi: 10.1063/1.474468. [DOI] [PubMed] [Google Scholar]
- 71.Dohnálek Z, et al. The effect of the underlying substrate on the crystallization kinetics of dense amorphous solid water films. J Chem Phys. 2000;112(13):5932–5941. [Google Scholar]
- 72.Safarik DJ, Mullins CB. A new methodology and model for characterization of nucleation and growth kinetics in solids. J Chem Phys. 2003;119(23):12510–12524. [Google Scholar]
- 73.Hage W, Hallbrucker A, Mayer E. Crystallization kinetics of water below 150 K. J Chem Phys. 1994;100:2743–2747. [Google Scholar]
- 74.Hage W, Hallbrucker A, Mayer E, Johari GP. Kinetics of crystallizing D2O water near 150 K by Fourier-transform infrared-spectroscopy and a comparison with the corresponding calorimetric studies on H2O water. J Chem Phys. 1995;103(2):545–550. [Google Scholar]
- 75.Jenniskens P, Blake DF. Crystallization of amorphous water ice in the solar system. Astrophys J. 1996;473(2 Pt 1):1104–1113. doi: 10.1086/178220. [DOI] [PubMed] [Google Scholar]
- 76.Handle PH, Loerting T. Dynamics anomaly in high-density amorphous ice between 0.7 and 1.1 GPa. Phys Rev B. 2016;93(6):064204. [Google Scholar]
- 77.Avrami M. Kinetics of phase change. I. J Chem Phys. 1939;7:1103–1112. [Google Scholar]
- 78.Avrami M. Kinetics of phase change. II. J Chem Phys. 1940;8:212–224. [Google Scholar]
- 79.Jackson KA. Kinetic Processes: Crystal Growth, Diffusion, and Phase Transitions in Materials. Wiley-VCH; Weinheim, Germany: 2004. [Google Scholar]
- 80.Hallett J. Experimental studies of the crystallization of supercooled water. J Atmos Sci. 1964;21(6):671–682. [Google Scholar]
- 81.Hobbs PV. Ice Physics. Oxford Univ Press; Oxford: 1974. [Google Scholar]
- 82.McClure SM, et al. Transport in amorphous solid water films: Implications for self-diffusivity. J Phys Chem B. 2006;110(36):17987–17997. doi: 10.1021/jp063259y. [DOI] [PubMed] [Google Scholar]


