

Abstract
Over the past two decades a number of severe acute respiratory infection outbreaks such as the 2009 influenza A (H1N1) and the Middle East respiratory syndrome coronavirus (MERS-CoV) have emerged and presented a considerable global public health threat. Epidemiologic evidence suggests that diabetic subjects are more susceptible to these conditions. However, the prevalence of diabetes in H1N1 and MERS-CoV has not been systematically described. The aim of this study is to conduct a systematic review and meta-analysis of published reports documenting the prevalence of diabetes in H1N1 and MERS-CoV and compare its frequency in the two viral conditions. Meta-analysis for the proportions of subjects with diabetes was carried out in 29 studies for H1N1 (n=92,948) and 9 for MERS-CoV (n=308). Average age of H1N1 patients (36.2±6.0 years) was significantly younger than that of subjects with MERS-CoV (54.3±7.4 years, P<0.05). Compared to MERS-CoV patients, subjects with H1N1 exhibited 3-fold lower frequency of cardiovascular diseases and 2- and 4-fold higher prevalence of obesity and immunosuppression, respectively. The overall prevalence of diabetes in H1N1 was 14.6% (95% CI: 12.3-17.0%; P<0.001), a 3.6-fold lower than in MERS-CoV (54.4%; 95% CI: 29.4-79.5; P<0.001). The prevalence of diabetes among H1N1 cases from Asia and North America was ~two-fold higher than those from South America and Europe. The prevalence of diabetes in MERS-CoV cases is higher than in H1N1. Regional comparisons suggest that an etiologic role of diabetes in MERS-CoV may exist distinctive from that in H1N1.
Significance for public health.
Outbreaks of the 2009 influenza A (H1N1) and the Middle East respiratory syndrome coronavirus (MERS-CoV) have presented a considerable global public health threat over the past few years. Evidence suggest that infected subjects who are also diabetic are more likely to be susceptible to severe outcome of H1N1 and MERS-CoV. Systematic analysis of ~93,000 H1N1 cases and ~300 MERS-CoV cases indicated an overall prevalence of 14.6% and 54.4% for diabetes in H1N1 and MERS-CoV cases, respectively. This may suggest a possible etiological relationship between diabetes and each of the two infectious conditions. Introduction of effective public health vaccination intervention strategies against severe acute respiratory infections should be developed to target subjects with chronic disorders such as diabetes, obesity and cardiovascular conditions.
Key words: Diabetes mellitus, 2009 influenza A (H1N1), the Middle East respiratory syndrome coronavirus (MERS-CoV), Systematic Review
Introduction
For the past two decades, pandemics of severe acute respiratory infections (SARI) have been serious threats to global health, causing significant morbidity and mortality. Reassorted novel strains of influenza viruses and coronaviruses continue to arise, rendering vaccinations - if developed - less useful and posing increased risks to humans. Two prominent viruses – 2009 influenza A (H1N1) and the Middle East respiratory syndrome coronavirus (MERS-CoV) – have markedly affected humans. H1N1, since the 2009 pandemic, has caused about 284,500 deaths, both directly via respiratory infections and indirectly from the cardiovascular diseases secondary to bacterial infections.1 In addition, MERS-CoV, since its first emergence in 2012, has infected 1600 individuals, causing 574 deaths and was reported in 26 countries although the vast majority of reported cases originated from the Arabian Peninsula.2
H1N1 and MERS-CoV both target the respiratory tract, and share many similar clinical symptoms. The most common symptoms are fever, cough, shortness of breath, and sore throat3-8 followed always by gastrointestinal symptoms such as nausea, vomiting, and diarrhea.3,7-9 Both diseases often lead to complications such as pneumonia, acute respiratory distress syndrome, organ failure, and even death.4,6,9 Complications mostly lie within the respiratory system with organ failure commonly noted in the respiratory system, followed by renal and cardiovascular systems.5 Individuals infected with H1N1 usually belong to those aged between 21 and 50 years,4,5 and have a mean age in the early 40s.3,5 MERS-CoV, on the other hand, mostly infects older adults with a median age of 50 years.10 This difference was hypothesized to be related to the development of cross-reactive antibodies against influenza viruses from previous exposures to seasonal influenza in elder people.5 Another difference between H1N1 and MERS-CoV relates to the length of the incubation period. H1N1 has a short incubation period between 1 and 2 days,11 whereas MERS-CoV has a much longer period of ~5 days.10
Many infected individuals exhibit comorbidities (e.g., diabetes, hypertension, asthma, and obesity), rendering them more susceptible to complications.3-7 Diabetes is one of the known documented contributing host-related risk factor in both H1N1 and MERS-CoV severe cases, and is frequent in individuals developing fatal disease complications.4-7 This observation may suggest an etiological relationship between diabetes and acute viral respiratory infections. Diabetes and its related conditions downregulate the innate and humoral immune systems by reducing the function of T cells and neutrophils.12 Hyperglycemia impairs critical components of innate immunity in vitro, such as chemotaxis, phagocytosis, and the bactericidal activity of neutrophils and macrophages and lead to secondary infections.13 The direct influence of diabetes, however, on acute respiratory infections still needs more research to estimate the frequency of diabetes in severe viral conditions and to elucidate the etiologic role on diabetes in disease severity.14 The present study was undertaken to conduct a systematic review and meta-analysis of published literature to describe the prevalence of diabetes in two of the emerging severe acute respiratory infections such as H1N1 and MERS-CoV and to explore its possible contribution to the severity and complication of the two viral conditions.
Materials and Methods
Search strategy and selection criteria
A search was conducted in PubMed, Ovid MEDLINE, Embase and Embase Classic databases to the last week of July 2015 using the search terms (MeSH) H1N1 or MERS-CoV (Middle East respiratory syndrome coronavirus) and Diabetes. The search resulted in 123 articles selected for title and abstract review as they satisfied our selection criteria (see below). We limited the studies into those in humans and excluded reports published as review articles, letters, case studies, editorials, conference abstracts, vaccination trials or family-based studies. After eliminating duplicate listings and only considering articles in full text, a total of 44 peer-reviewed original studies were selected for full text review. Full article review resulted in the further exclusion of 8 reports that were not documenting the prevalence of diabetes in H1N1 or MERS-CoV (i.e., no association studies), examining only a small number of travellers as a case report (n=2 subjects), reporting seasonal influenza alone, reviewing already reported cases (MERS-CoV), or simply documenting national surveys. A bibliography search of the remaining articles identified two additional studies. A total of 38 peer- reviewed articles (29 studies for H1N13-5,14-39 and 9 for MERS-CoV6-9,40-44) were identified for this article (Figure 1).
Figure 1.
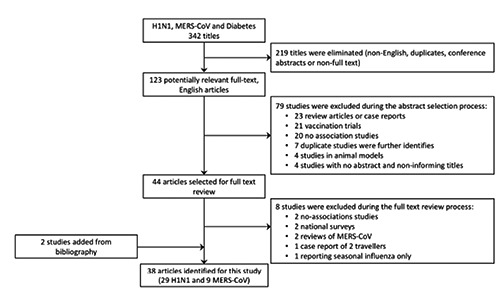
Systematic literature review process. The flow diagram describes the systematic review of literature on the contribution of diabetes to severe H1N1 and MERS-CoV. A total of 38 unique studies were identified (29 studies for H1N1 and 9 for MERS-CoV from an initial 342 examined titles).
Inter-reviewer agreement
The abstracts of the identified studies were independently reviewed by two readers (AB and SJ). Differences were resolved through discussions for a consensus to be reached. Percentage agreement and Cohen’s Kappa (k) statistic45 were calculated and interpreted in accordance with Landis and Koch’s benchmarks46 for assessing the agreement between reviewers as poor (<0), slight (0.0-0.20), fair (0.21-0.40), moderate (0.41-0.60), substantial (0.61-0.80), and excellent (0.81-1.0). The agreement on the inclusion between the two reviewers was 86%, with k=0.72 (95% CI 0.58-0.85).
Quality score assessment
The methodological quality of each study was evaluated as previously described47 with some modification. Quality of the study was based on four criteria: (a) the number of study subjects (n; at least the median of 157 for H1N1 and 17 for MERS-CoV), (b) comprehensive reporting of patients’ demographic information, (c) describing a minimum of 3 disease-associated symptoms and (d) reporting at least 2 comorbidities (in addition to diabetes). For each criterion, each study was given a score (0 or 1, with 1 fulfilling the criteria). The total score was calculated for each study (score range 0-4). Quality scores of 1, 2, 3, and 4 were considered poor, fair, good and very good, respectively.
Data extraction and analysis
Data extracted from the selected studies included the first author’s name, publication date, country, dates of recruitment, ethnicity, total sample size (divided to males and females), age, prevalence of symptoms (including fever, shortness of breath, sore throat, cough and Acute Physiology and Chronic Health Evaluation II, APACHEII) and percentage of comorbidities at the time of presentation (including obesity, immunosuppression or HIV and heart conditions such as hypertension, cardiovascular diseases and/or coronary arterial diseases) (Tables 1 and 2). Weighted average was used to calculate the average age and the overall prevalence of clinical symptoms and comorbidities. Publication bias was assessed both by the visual inspection of funnel plot (Figure 2) and by Egger’s test. Egger’s test is widely used to assess the tendency for the effects estimated in small sample size studies to differ from those estimated in larger studies. The results of Egger’s test are presented in terms of bias coefficient. To measure the prevalence of diabetes in the two viral conditions, we extracted the proportion of the disease in the reported cases of severe respiratory infections. A subgroup analysis was carried out by region, only for the H1N1 studies (Table 3). Region subgroup analysis for MERS-CoV was not doable since all the identified studies were conducted on Saudi populations, with one study of pooled analysis where region/country designation was not possible. The primary outcome measure was to evaluate the prevalence of diabetes in H1N1 and MERS-CoV cases. The meta-analysis of proportions (and 95% CIs) was calculated for the identified studies (Figure 3) and in a subgroup analysis within each region (Table 3). Meta-analysis tests were conducted using the OpenMeta Analyst version 10.10, a free, cross-platform, open-source program.48 We used binary random-effects model since we assumed that the relationship between diabetes and severe respiratory infection is varied across populations. T-test was used to compare between average age in H1N1 and MERS-CoV since this factor was normally distributed in the two sets of studies. Mann-Whitney Utest was employed to compare the prevalence of clinical symptoms and comorbidities between the two diseases as these conditions were not normally distributed. To assess whether there is true heterogeneity among the selected studies and that all the studies are evaluating the same effect, we used the Q test.49 Q test only informs about the presence versus the absence of heterogeneity and does not report on the extent of such heterogeneity. Therefore, we calculated the I2 index to complement the Q test and quantify the degree of heterogeneity among studies.50 Given the poor power of Q test to detect true heterogeneity among a small number of studies, we also quantified the true heterogeneity by estimating the between-study variance in the random-effects model (τ2), as previously described.51 P<0.05 was considered to be statistically significant. Forest plots were used to illustrate the prevalence of diabetes in H1N1 and MERS-CoV severity from the selected studies and to inspect the heterogeneity of the individual findings.
Table 1.
Characteristics of the H1N1 identified studies.
| Study | Country | Dates, mm.yy |
N | Age (yr) |
Symptoms (%) |
Comorbidities (%) |
Quality Score | ||||||||
|---|---|---|---|---|---|---|---|---|---|---|---|---|---|---|---|
| All | M | F | |||||||||||||
| (92,948) | (46,181) | (46,351) | APACHEII | Fever | Shortness of Breath |
Sore Throat |
Cough | Obesity | HT/ CAD/ CVD |
Imm/ HIV |
|||||
| Al-Soub et al. 20143 | Qatar | 07.09-01.11 | 40 | 24 | 16 | 42.7 | 12 | 90 | 75 | 23 | 88 | 28 | 40 | 3 | 3 |
| Allam et al., 20134 | India | 05.09-12.10 | 45 | 24 | 21 | 18 | 80 | 16 | 18 | 3 | 2 | ||||
| Bagshaw et al., 201315 | Canada | 04.09-04.10 | 562 | 262 | 300 | 48 | 21 | 27 | 2 | ||||||
| Balaganesakumar et al., 201316 | India | 01.10-12.10 | 72 | 41 | 31 | 45.5 | 96 | 85 | 60 | 88 | 24 | 9 | 3 | ||
| Chawla et al., 20135 | India | 10.09-12.10 | 77 | 44 | 33 | 40.9 | 97 | 77 | 33 | 87 | 25 | 8 | 3 | ||
| Jimenez-Garcia et al., 201317 | Spain | 01.09-12.09 | 11,499 | 5806 | 5693 | 39.6 | 9 | 2 | 2 | 3 | |||||
| Kusznierz et al, 201318 | Argentina | 05.09-07.09 | 242 | 121 | 121 | 33.7 | 72 | 71 | 88 | 16 | 33 | 3 | 4 | ||
| Suryaprasad et al., 201319 | USA-AB | 05.09-07.09 | 88 | 31 | 57 | 37 | 9 | 71 | 8 | 4 | 2 | ||||
| Vallejos et al., 201320 | Argentina | 05.09-08.09 | 44 | 25 | 19 | 49.5 | 91 | 25 | 34 | 2 | |||||
| Aziz-Baumgartner et al., 201221 | Argentina | 04.09-12.09 | 49 | 27 | 22 | 37 | 53 | 1 | |||||||
| Chowell et al., 201222 | Mexico | 08.09-12.09 | 3456 | 1482 | 1974 | 22 | 79.9 | 57 | 56 | 84 | 12 | 5 | 4 | ||
| Delgada-Rodriguez et al., 201223 | Spain | 07.09-02.11 | 813 | 403 | 410 | 38.5 | 9 | 2 | |||||||
| Cortes-Garcia et al., 201214 | Spain | 06.09-12.09 | 2413 | 1246 | 1167 | 42.5 | 22 | 29 | 12 | 3 | |||||
| Marija Kojicic et al., 201224 | BAH | 11.09-03.10 | 50 | 31 | 29 | 43 | 19 | 16 | 64 | 5 | 6 | 2 | |||
| Miller et al., 201225 | USA | 05.09-06.09 | 43 | 8 | 35 | 36.4 | 60 | 63 | 16 | 73 | 7 | 2 | |||
| Wane et al., 201226 | Rwanda | 10.09-05.10 | 532 | 257 | 275 | 42 | 85 | 33 | 58 | 88 | 2 | 3 | |||
| Chudasama et al., 201127 | India | 09.09-02.10 | 274 | 141 | 133 | 29.5 | 92 | 53 | 54 | 97 | 9 | 5 | 4 | ||
| Gilca et al., 201128 | Canada | 04.09-06.09 | 321 | 154 | 167 | 29 | 25 | 13 | 8 | 3 | |||||
| Ward et al., 201129 | Australia | 07.09-08.09 | 302 | 125 | 177 | 45 | 35 | 14 | 10 | 3 | |||||
| Yokota et al., 201130 | Brazil | 07.09 | 157 | 78 | 79 | 33 | 97 | 97 | 47 | 99 | 38 | 6 | 9 | 4 | |
| Van Kerkhove et al., 201131 | Pooled | 04.09-01.10 | 70,000 | 35,140 | 34,860 | 36 | 6 | 7 | 5 | 3 | |||||
| Allard et al., 201032 | Canada | 05.09-07.09 | 162 | 73 | 89 | 28.6 | 2 | ||||||||
| Carcione et al., 201033 | Australia | 05.09-08.09 | 871 | 427 | 444 | 26 | 88 | 33 | 56 | 85 | 9 | 5 | 3 | 4 | |
| Fajardo_Dolci et al., 201034 | Mexico | 04.09-05.09 | 100 | 47 | 53 | 54.5 | 84 | 75 | 85 | 14 | 18 | 2 | 3 | ||
| Koegelenberg et al., 201035 | S. Africa | 08.09-09.09 | 19 | 4 | 15 | 39.5 | 18 | 21 | 32 | 2 | |||||
| Venkata et al., 201036 | USA | 05.09-12.09 | 66 | 33 | 33 | 46.9 | 83 | 71 | 21 | 88 | 44 | 32 | 20 | 3 | |
| Xi et al., 201037 | China | 10.09-12.09 | 155 | 90 | 65 | 43 | 94 | 47 | 30 | 92 | 38 | 2 | |||
| CDC, 200938 | USA-AB | 04.09-12.09 | 416 | 44.5 | 1 | ||||||||||
| Kwan-Gett et al., 200939 | USA | 04.09-08.09 | 70 | 37 | 33 | 11 | 41 | 11 | 16 | 2 | |||||
| Total/Weighted Average (SD) | 04.09-02.11 | 92,948 | 46,181 | 46,351 | 36.2(6.0) | 20.2(4.5) | 82.5(9.1) | 53.3(7.3) | 38.9(6.2) | 85.9(9.3) | 7.7(2.8) | 7.2(2.7) | 4.8(2.2) | - | |
APACHEII, Acute Physiology and Chronic Health Evaluation II; HT, CAD, CVD, hypertension, coronary artery diseases, cardiovascular diseases; Imm, immunodeficiency. AB, Aboriginal; BAH, Bosnia and Herzegovina.
Table 2.
Characteristics of the MERS-CoV identified studies.
| Study ID* | Dates, mm.yy | N | Age (yr) |
Symptoms (%) |
Comorbidities (%) |
Quality Score |
||||||||
|---|---|---|---|---|---|---|---|---|---|---|---|---|---|---|
| All | M | F | ||||||||||||
| (308) | (199) | (109) | APACHEII | Fever | Shortness | Sore of Breath | Cough Throat | Obesity | HT/ CAD/ CVD |
Imm/ HIV |
||||
| Shalhoub et al., 201540 | 04.14-06.14 | 24 | 14 | 10 | 66 | 79 | 83 | 88 | 75 | 3 | ||||
| Al-Tawfiq et al., 20149 | 04.14-06.14 | 17 | 11 | 6 | 62 | 40 | 67 | 7 | 86 | 53 | 3 | |||
| Al-Tawfiq et al., 201441 | 04.14-06.14 | 5 | 3 | 2 | 57.6 | 40 | 1 | |||||||
| Arabi et al., 20146 | 12.12-08.13 | 12 | 8 | 4 | 59 | 28 | 67 | 92 | 8 | 83 | 93 | 3 | ||
| Memish et al., 201442 | 06.13-08.13 | 12 | 6 | 6 | 36 | 100 | 100 | 80 | 100 | 8 | 33 | 3 | ||
| Assiri et al., 20137 | 09.12-06.13 | 47 | 36 | 11 | 64.5 | 87 | 72 | 21 | 83 | 17 | 62 | 4 | ||
| Assiri et al., 20138 | 04.13-05.13 | 23 | 17 | 6 | 56 | 87 | 48 | 87 | 24 | 39 | 0 | 4 | ||
| Memish et al., 201343 | 7 | 0 | 7 | 43 | 57 | 57 | 29 | 2 | ||||||
| WHO, 201344 | 09.12-10.13 | 161 | 104 | 57 | 50 | 7.5 | 5 | 3 | ||||||
| Total/Weighted Average (SD) | 09.12-06.14 | 308 | 199 | 109 | 54.3(7.4) | 28 | 78.0(8.8) | 70.6(8 .4) | 37.1(6.1) | 83.6(9.1) | 17.6(4.2) | 31.3(5.9) | 4.4 | |
*A11 studies were from KSA, except WHO, 2013,44 examined samples pooled from France, Germany, Italy, Jordan, KSA, Qatar, Tunisia, UAE, UK. For abbreviation, see Table 1.
Figure 2.
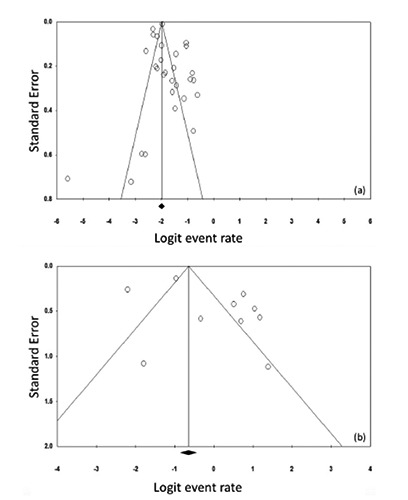
Funnel plot for systematic review on the prevalence of diabetes in H1N1 and MERS-CoV studies. The logit event rate for prevalence (horizontal axis) is presented against the standard error (SE) of the log of logit event rate (vertical axis) for H1N1 (a) and MERS-CoV (b) studies. The SE inversely corresponds to the study size. Asymmetry of the plot can indicate publication bias. Open circles indicate the individual studies.
Table 3.
Meta-Analyses for the prevalence of diabetes in severe H1N1 cases by region.
| Region | Number of subjects | Percent prevalence of diabetes in H1N1(95% CI) | Heterogeneity Analysis | |||
|---|---|---|---|---|---|---|
| τ2 | Cochran’s Q |
Statistic P |
I2 | |||
| Europe14,17,23,24 | 14,775 | 10.1 (8.5-11.5) | 0.0 | 11.5 | 0.009 | 73.9 |
| Asia3-5,16,27,29,33,37 | 1,836 | 17.6 (12.1-23.1) | 0.005 | 62.9 | <0.001 | 88.9 |
| Africa26,35 | 551 | 14.2 (-16.2-44.5) | 0.043 | 8.6 | 0.003 | 88.3 |
| North America15,19,22,25,28,32,34,36,38,39 | 5,294 | 19.7 (13.8-25.6) | 0.008 | 166.7 | <0.001 | 94.6 |
| South America18,20,21,30 | 492 | 9.8 (4.4-15.3) | 0.002 | 11.7 | 0.009 | 74.3 |
Figure 3.
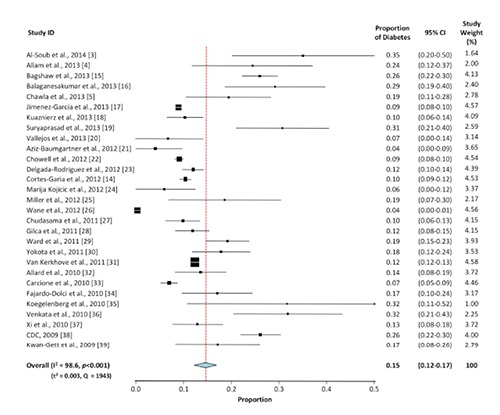
Meta-analysis for the proportion of diabetes in H1N1 cases. Weights are calculated from binary random-effects model analysis. Values represent proportion of diabetic cases in the H1N1 patients and 95% CI. Heterogeneity analysis was carried out using Q test, the among studies variation (I2 index) and in between-study variance in the random-effects model (τ2).
Results
The present systematic review examines the relationship between diabetes and the H1N1 and MERS-CoV. A total of 38 studies that report the prevalence of diabetes in H1N1 (n=92,948 cases from 29 studies, Table 1) and MERS-CoV (n=308 cases from 9 studies, Table 2) were selected. The funnel plot (Figure 2) demonstrated a non-symmetrical distribution of the effect size of each study on either side of the pooled estimate. This seemingly non-symmetrical appearance of the plot suggested evidence of publication bias. Egger’s test also supported this notion particularly in MERS-CoV studies where the bias coefficient was not statistically significant - given the assumption for evidence of small-study effects is based on P<0.1 (P=0.13 for the H1N1 studies and P=0.065 for the MERS-CoV studies). These findings are supported by the significant heterogeneity (P<0.001) among the selected studies (see below). According to our quality scoring criteria (see above), the majority of the studies were between fair (score 2; 12 reports) and good (score 3, 16 reports) quality with 7 studies that fulfilled all quality scoring criteria (score 4, very good). Within the selected studies, sex-ratio (male:female) in the majority of the H1N1 reports was 1:1 whereas it was ~2:1 in the MERS-CoV cases. The average age of H1N1 cases (36.2±6.0 years, range: 11-54.5 years) was significantly younger than MERS-CoV cases (54.3±7.4 years, range: 36-66 years, t-test P=0.0004). The prevalence of fever, shortness of breath, sore throat and cough was not statistically different between H1N1 and MERS-CoV cases from the two sets of studies (Mann-Whitney U test at P<0.05). We observed a non-statistically significant ~2-fold higher frequency of obesity (>30 kg/m2) in the MERS-CoV patients compared to their H1N1 counterparts (17.6±4.2 vs. 7.7±2.8%). The combined frequencies of cardiovascular diseases, hypertension, and cardio-artillery diseases were ~3-fold higher in MERS-CoV cases than in H1N1 (31.3±5.9% vs. 7.2±2.7, P=0.0004).
Meta-analyses for the proportion of diabetes in H1N1 and MERS-CoV are shown in Figures 3 and 4, respectively. The overall proportion of diabetes in H1N1 is 15% (95% CI: 12-17%), 3.6-fold lower than its proportion in MERS-CoV (54%, 95%CI: 28-80%). The two sets of studies displayed a significant heterogeneity (P<0.001) among the selected studies (Q test: 1943 for H1N1 vs. 169.8 for MERS-CoV). Additionally, the degree of heterogeneity among studies was statistically significant (P<0.001) and comparable between the two sets of studies (I2 index: 98.6 for H1N1 vs. 95.3 for MERS-CoV). The between-study variance in the random-effects model was markedly lower among the H1N1 studies (τ2=0.003) than the MERS-CoV reports (τ2=0.134).
Figure 4.
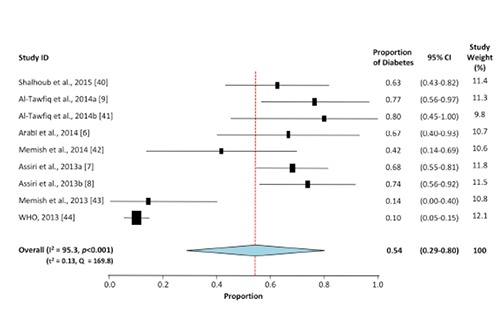
Meta-analysis for the proportion of diabetes in MERS-CoV cases. Weights are calculated from binary random-effects model analysis. Values represent proportion of diabetic cases in the MERS-CoV patients and 95% CI. Heterogeneity analysis was carried out using Q test, the among studies variation (I2 index) and in between-study variance in the random-effects model (τ2).
Subgroup analysis by region for H1N1 studies (Table 3) showed that the frequency of diabetes in H1N1 from Asia and North America (~18-20%, P<0.001) is 2-fold higher than its prevalence in the cases recruited from Europe and South America (~10%, P<0.001). Cases from Africa (14%) showed a non-significant slightly lower diabetes prevalence compared to those from Asia and North America. It should be noted however, that the frequency estimate from Africa was developed only from two studies (compared to 8 and 10 studies from Asia and North America, respectively, and 4 studies from each of Europe and South America). The heterogeneity tests for the studies included in all regional sub-analyses exhibited significant overall heterogeneity (Q test, P≤0.009), degree of heterogeneity among studies (I2 index) and between-study variance in the random-effects model (τ2 test).
Discussion
The present systematic review evaluates the frequency of diabetes in SARI conditions such as H1N1 and MERS-CoV. We observed a large difference between the volume of literature and total number of subjects evaluated for each condition and identified 29 studies for H1N1 (with 92,948 subjects) and 9 for MERS-CoV (with 308 patients). About 60% of the selected studies (23 out of 38) had a quality score between good and very good (Tables 1 and 2). This indicates that a large set of the studies had a sufficient enough number subjects to substantiate the outcome and have provided a comprehensive reporting of patients’ demographic information. Furthermore, the majority of the selected studies reported a set of disease-associated symptoms and comorbidities that permitted developing a comprehensive profile of the infectious disease and its complication. This difference reflects the discrepancy between the two diseases in their global (H1N1) versus regional (MERS-CoV) spread, and the period during which they emerged. Immediately following its outbreak in 2009, the H1N1 triple reassortant swine influenza viruses contained genes from avian, swine, and human influenza A viruses53,54 and sustained a rapid between-human transmission to spread globally.52 On the other hand, in 2012, the emergence of MERS-CoV was to a great extent contained within the Arabian Peninsula55 and dromedary camels were identified as the intermediate host56 with a closely related virus sequences found in bats.57 Apart from a number of nosocomial outbreaks involving healthcare workers caring for MERS-CoV patients; little evidence has been initially reported for sustained person-to-person transmission.58 However, during the 2015 MERS-CoV outbreak in the Republic of Korea it was demonstrated that among 186 cases, 83.2% of the transmission events were linked to only 5 super-spreaders, all of whom had pneumonia at presentation and contacted hundreds of people, adding evidence to the person-to-person transmission in MERS-CoV.59
The characteristic pattern of transmission and spread of H1N1 and MERS-CoV may have resulted in a distinctive sex-ratio for each condition. MERS-CoV cases exhibited a sex-ratio (male:female) of 2:1, twice that noted for H1N1 cases (Tables 1 and 2). The male predominance of MERS-CoV reflects the higher likelihood of exposure to the infectious agent in males than in females in Middle Eastern cultures. In addition, most males who tested positive for the virus and died also had underlying medical conditions, which could explain the severity of cases in older males.60 In agreement, MERS-CoV cases were significantly older (54.3±7.4 years) than their H1N1 (36.2±6.0 years) counterparts. The average age of H1N1 patients is similar to that in H5N1 cases where 90 percent of the subjects were 40 years or younger.61 As noted with H5N1 cases, it can be estimated that 15-20% of elder people may have residual immunity against this H1N1 flu strain following their life-time exposures to multiple influenza outbreaks.61-64 This immunogenicity does not apply to coronaviruses and may explain the younger average age of H1N1 cases compared to MERS-CoV cases. Indeed, it was proposed over 60 years ago that repeated exposures to antigenic variants of influenza viruses may result in antibodies recognizing a large number of common flu antigens, and develop a reinforced immunity that lower the risk of infection with newly emerging variants.65
The clinical presentations of SARI generally include respiratory symptoms, such as fever, new onset or exacerbation of cough, breathing difficulty and sore throat. Severe illnesses may vary from pneumonia, acute respiratory distress syndrome, encephalitis, myocarditis, or other severe and life-threatening complications.66 The frequency of fever, shortness of breath, sore throat and cough was similar between H1N1 and MERS-CoV cases. In contrast, underlying medical conditions and comorbidities varied significantly between the two viral conditions. Patients with MERS-CoV had 2-fold higher rates of obesity (P>0.05) and 3-fold higher combined frequencies of cardiovascular diseases, hypertension, and cardio-artillery diseases (P<0.05) (Tables 1 and 2). The varying rates of comorbidities between H1N1 and MERS-CoV cases may relate to their different patterns of regional spread. Cardiovascular diseases are highly prevalent in the Middle East67 than in many regions of the world.67,68 This observation also applies to obesity, although the lower prevalence of obesity in males from the Arabian Peninsula versus females69 and their higher predominance in MERS-CoV patients (see above) together may have been combined to render the occurrence of obesity in MERS-CoV non-significantly different from that in H1N1. The increased risk of developing severe H1N1 and MERS-CoV complications in people with underlying chronic diseases was similarly reported in seasonal influenza. A recent study noted that, compared to subjects with no comorbidities, severe cases of influenza are more likely to manifest with obesity (OR for mortality 2.74, 95%CI: 1.56-4.80), cardiovascular diseases (2.92, 1.76-4.86), hypertension (1.49, 1.10-2.01) and neuromuscular disease (2.68, 1.91-3.75).70 More studies examining the link between SARI and metabolic syndrome-related complications such as obesity and cardiovascular conditions are needed to evaluate their contribution to the severity of infectious diseases.
The overall proportion of diabetes was ~4-fold higher in MERS-CoV cases (54%) than in their H1N1 counterparts (15%) (Figures 3 and 4). In agreement, odds ratio for severe H1N1 in diabetic subjects (ranging from 2.2 to 4.4)16,19,23,30 was >3-fold lower than for severe MERS-CoV (OR ranging from 7.2 to 15.7).9,40 Although at varying extents, these findings implicate diabetes as a risk factor for sever MERS-CoV and H1N1. One reason for this difference may relate to the higher average age of MERS-CoV cases given that older age is a known risk factor for type 2 diabetes.71 Although in younger Middle Eastern populations rates of diabetes and its risk factors67 are higher than those in older populations, the disease prevalence has increased across all age groups rather than just in older adults in the region.72 Another possible explanation can be attributed to the high prevalence of diabetes in the Middle East and the Arabian Peninsula67 - where MERS-CoV originated and spread - compared to its prevalence in other world regions.68 Similar increased rates of tuberculosis were noted in regions with high diabetes prevalence.73 Additionally, subgroup analysis by region demonstrated that diabetes frequency in H1N1 cases from Asia and North America is ~2-fold higher than in those from Europe and South America (Table 3). This coincides with the high prevalence of diabetes in Asia and North America (~12%) compared to Europe or South and Central America (~9%).74 However, despite the lines of evidence suggesting an influence of the region of viral spread on diabetes proportion in the severe cases of SARI, the rate of diabetes in MERS-CoV was still ~3-fold higher than that in the H1N1 cases from Asia (17.6%, 95% CI: 12.1-23.1; P<0.001; Table 3) - where diabetes rates are comparable to those in the regions of MERS-CoV. This observation suggests that the higher prevalence of diabetes in MERS-CoV cases than in H1N1, may not be simply related to the regional differences in the viral spread and that an etiologic role of diabetes in severe MERS-CoV cases may exist distinctive from that in H1N1.
Diabetes can impair the innate immune system75 and render individuals more susceptible to a range of infectious diseases and severe illnesses.13,75,76 For example, during seasonal influenza outbreaks, compared to healthy subjects, diabetic patients were shown to have 6-fold higher risk of becoming critically ill and acquire hospitalization with 4-fold increased rates of pneumonia-related hospitalizations and a 3-fold elevated likelihood of dying of complications.77 Diabetes share several common features with infectious disorders and its complication such as the endothelial dysfunction, the pro-inflammatory state and the attenuation of innate immune response.75 The cytokine overload related to the Th1 (microbicidal action of IFN- ) to Th2 (anti-inflammatory IL-4, -5, -10 and -13) shift in severe viral infection when accompanied by the increased cytokine levels arising from diabetes, both can be detrimental to the endothelium and lead to a range of subsequent complications.78 Dampened innate immunity and the shift from Th1 to Th2 responses were implicated in linking the high prevalence of allergy observed in fatal viral infections, e.g., Dengue fever.79 Furthermore, diabetes can impair macrophage and lymphocyte functions with a subsequent status of reduced immune response76 where individuals become at increased risk of severe infectious disease outcome. In support, diabetes-associated hyperglycemia and cellular insulinopenia are known to impair macrophage and lymphocyte functions with a subsequent status of reduced immune response.76 Furthermore, levels of HbA1c ≥9% were linked to a 60% increased risk of pneumonia-related complications and hospitalization due to a lower immune response.80 Host defense to infection is largely mediated by cellular immunity and the synthesis of related cytokines, such as IFN- and interleukins, is downregulated in diabetes.75,81
The present study has several limitations. Inspection of the funnel plot (Figure 2) and the Egger’s test indicates that publication bias may have been derived from the small-study effect, i.e., the possibility of including small studies with spuriously overstated estimates while ignoring those without statistically significant effects that may have a lower possibility of being published. Furthermore, the identified reports have shown 8-fold among-studies variance in the diabetes proportion for H1N1 (0.04-0.35; Figure 3) and MERS-CoV (0.1-0.8, Figure 4) cases. These inter-study differences may have contributed to the significant heterogeneity observed in our report. Additional sources of heterogeneity may relate to the large variation among studies in the sample size (19 to 70,000 H1N1 cases and 5 to 161 MERS-CoV patients) or the ethnic diversity of the study populations particularly within the H1N1 studies (collected from 14 counties). Furthermore, heterogeneous methodologies due to different study designs may have influenced the inter-study variation. This observation may levy some limitations on the estimated contribution of diabetes to severe H1N1 and MERS-CoV cases and render our results as a guide to generate more accurate estimates for national or international intervention strategies for severe SARI conditions in diabetic subjects. Furthermore, although the prevalence of diabetes is 15% in severe H1N1 cases and 54% in MERS-CoV, it may not implicate causality and warrants further studies to identify the nature and extent of the coexistence between diabetes and each of the two respiratory infections. Another limitation is the low number of MERS-CoV cases and the narrow geographic region from which it was recruited, compared to the H1N1 cases that rendered subgroup analysis (by region) unattainable for MERS-CoV cases. This particular limitation may add more weight to the suggestion stipulating that the difference in diabetes prevalence between H1N1 and MERS-CoV can be attributable to the regional difference in spread. The small number of MERS-CoV studies highlights the need to develop international collaborations that include cases from countries other than those in the Arabian Peninsula, e.g., from Korea where a few recent cases have been emerged recently. A single study44 has examined MERS-CoV cases pooled from various countries but the findings were still limited by the small population size. The reports identified in the present study did not distinguish between the prevalence of type 1 and/or type 2 diabetes in H1N1 or MERS-CoV cases. With the exception of three studies (only in the H1N1 - but not MERS-CoV),14,17,35 all the identified reports have combined both types of diabetes despite their different characteristics, etiological factors and clinical features. Cortes Garcia et al.,14 and Koegelenberg et al.,35 have clearly stated that the diabetic cases in their H1N1 series as type 2 cases. Jimenez-Garcia et al.,17 on the other hand, compared the demographic characteristics, underlying medical conditions and in-hospital case fatality risk (CFR) in the type 1 (prevalence 0.8%) and type 2 (prevalence 8.4%) diabetic patients and reported a ~2-fold higher CFR in type 2 cases than type 1.17 Given this paucity of information, it was challenging to distinguish between the two types of diabetes for their role in viral disease severity and complication.
Conclusions
In conclusion, the present study provides some evidence of a greater prevalence of diabetes to MERS-CoV severity compared to H1N1. If this relationship is causal, however, the substantial proportion of diabetes in each of the two infections suggests that introducing effective strategies for diabetes prevention may reduce the severity of a significant number of SARI conditions. Specific systematic vaccination intervention strategies against SARI diseases should be also considered for patients with metabolic syndrome and related disorders such as diabetes, obesity and cardiovascular conditions.82 This should be viewed as a key public health strategy in preventing SARI-associated morbidity and mortality.83 During the 1957–58 pandemic and in response to substantial morbidity and mortality, the US Surgeon General recommended annual influenza vaccination for individuals with chronic debilitating disease, people aged ≥65 years and pregnant women.84 For these high-risk groups, the first recommendation of national universal seasonal influenza vaccination was established in 2010 by the Advisory Committee on Immunization Practices (ACIP).85 Recently, influenza vaccination was demonstrated to be associated with preventing allcause hospitalization in infected subjects.86 However, despite numerous recommendations from several public health organizations across the world (e.g., CDC, WHO, etc.) to administer SARI vaccines (e.g., influenza) annually to diabetic patients, vaccination rate in this vulnerable sub-population remains low.87-89 The current level of vaccination falls far short of the 2010 national health objectives call for a 90% rate to all elderly people (≥65 years of age) and 60% for younger people who have risk factors (e.g., diabetes).88 The prevalence of chronic diseases is rising in middle- and low-income countries as populations age and lifestyles and diets change. Further studies are being undertaken to evaluate the prevalence of other comorbidities in H1N1 and MERS-CoV. Subsequent introduction of effective public health vaccination intervention approaches and strategies is necessary to improve the protection against SARI in subjects with chronic disorders such as diabetes, obesity and cardiovascular conditions.
Acknowledgments
The authors thank S. Jurdi and H. Nasser for helping in reviewing the initial set of abstracts with AB during the initial stage of studies screening and Dr. Paul Arora for discussing the manuscript. This work was supported by the Public Health Agency of Canada.
References
- 1.Dawood FS, Iuliano AD, Reed C, et al. Estimated global mortality associated with the first 12 months of 2009 pandemic influenza A H1N1 virus circulation: a modeling study. Lancet Infect Dis 2012;12:687-95. [DOI] [PubMed] [Google Scholar]
- 2.World Health Organization. Middle East respiratory syndrome coronavirus (MERS-CoV). 2015. Available from: http://www.who.int/emergencies/mers-cov/en/ (accessed on October 29, 2015). [Google Scholar]
- 3.Al-Soub H, Ibrahim AS, Al-Maslamani M, et al. Epidemiology, risk factors, clinical features, and outcome of adult patients with severe pandemic A/H1N1/2009 influenza in Qatar: a retrospective study. Infect Dis Clin Pract 2014;22:339-43. [Google Scholar]
- 4.Allam RR, Murhekar MV, Tadi GP, Udaragudi PR. Descriptive epidemiology of novel influenza A (H1N1), Andhra Pradesh 2009-2010. Ind J Pub Health 2013;57:161-5. [DOI] [PubMed] [Google Scholar]
- 5.Chawla R, Kansal S, Chauhan M, et al. Predictors of mortality and length of stay in hospitalized cases of 2009 influenza A (H1N1): Experiences of a tertiary care center. Ind J Crit Care Med 2013;17:275-82. [DOI] [PMC free article] [PubMed] [Google Scholar]
- 6.Arabi YM, Arifi AA, Kalkhy HH, et al. Clinical course and outcomes of critically ill patients with Middle East respiratory syndrome coronavirus infection. Ann Intern Med 2014;160:389-97. [DOI] [PubMed] [Google Scholar]
- 7.Assiri A, Al-Tawfiq JA, Al-Rabeeah AA, et al. Epidemiological, demographic, and clinical characteristics of 47 cases of Middle East respiratory syndrom coronavirus disease from Saudi Arabia: A descriptive study. Lancet Infect Dis 2013;13:752-61. [DOI] [PMC free article] [PubMed] [Google Scholar]
- 8.Assiri A, McGeer A, Perl TM, et al. Hospital outbreak of Middle East respiratory syndrome coronavirus. N Engl J Med 2013;369:407-16. [DOI] [PMC free article] [PubMed] [Google Scholar]
- 9.Al-Tawfiq JA, Hinedi K, Ghandour J, et al. Middle East respiratory syndrome coronavirus: A case-control study of hospitalized patients. Clin Infect Dis 2014;59:160-5. [DOI] [PMC free article] [PubMed] [Google Scholar]
- 10.Cunha CB, Opal SM. Middle East respiratory syndrome (MERS): a new zoonotic viral pneumonia. Virulence 2014;5:650-4. [DOI] [PMC free article] [PubMed] [Google Scholar]
- 11.Wang C, Yu E, Xu B, et al. Epidemiological and clinical characteristics of the outbreak of 2009 pandemic influenza A (H1N1) at a middle school in Luoyang, China. Public Health 2012;126:289-94. [DOI] [PubMed] [Google Scholar]
- 12.Casqueiro J, Casquerio J, Alves C. Infections in patients with diabetes mellitus: a review of pathogenesis. Ind J Endocrinol Metabol 2012;16:S27-36. [DOI] [PMC free article] [PubMed] [Google Scholar]
- 13.Benfield T, Jensen JS, Nordestgaard BG. Influence of diabetes and hyperglycaemia on infectious disease hospitalisation and outcome. Diabetologia 2007;50:549-54. [DOI] [PubMed] [Google Scholar]
- 14.Cortes Garcia M, Moros MJS, Perlta PSO, et al. Clinical characteristics and outcomes of diabetic patients who were hospitalized with 2009 pandemic influenza A H1N1 infection. J Infection 2012;64:218-24. [DOI] [PubMed] [Google Scholar]
- 15.Bagshaw SM, Sood MM, Long J, et al. Acute kidney injury among critically ill patients with pandemic H1N1 influenza A in Canada: a cohort study. BMC Nephrol 2013;14:123. [DOI] [PMC free article] [PubMed] [Google Scholar]
- 16.Balaganesakumar SR, Murhekar MV, Swamy KK, et al. Risk factors associated with death among influenza A (H1N1) patients, Tamil Nadu, India, 2010. J Postgrad Med 2013;59:9-14. [DOI] [PubMed] [Google Scholar]
- 17.Jimenez-Garcia R, Hernandez-Barrera V, Rodriguez-Rieiro C, et al. Hospitalizations from pandemic influenza [A(H1N1)pdm09] infections among type 1 and 2 diabetes patients in Spain. Influ Other Resp Viruses 2013;7:439-47. [DOI] [PMC free article] [PubMed] [Google Scholar]
- 18.Kusznierz G, Uboldi A, Sosa G, et al. Clinical features of the hospitalized patients with 2009 pandemic influenza A (H1N1) in Santa Fe, Argentina. Influ Other Resp Viruses 2013;7:410-7. [DOI] [PMC free article] [PubMed] [Google Scholar]
- 19.Suryaprasad A, Redd JT, Hancock K, et al. Severe acute respiratory infections caused by 2009 pandemic influenza A (H1N1) among American Indians: southwestern United States, May 1-July 21, 2009. Influnza Other Resp Viruses 2013;7:1361-9. [DOI] [PMC free article] [PubMed] [Google Scholar]
- 20.Vallejos A, Arias M, Cusumano A, et al. Dialysis for acute kidney injury associated with influenza A (H1N1) infection. Saudi J Kidney Dis Transpl 2013;24:527-33. [DOI] [PubMed] [Google Scholar]
- 21.Aziz-Baumgartner E, Cabrera AM, Chang L, et al. Mortality, severe acute respiratory infection, and influenza-like illness associated with influenza A(H1N1)pdm09 in Argentina, 2009. PLoS One 2012;7:e47540. [DOI] [PMC free article] [PubMed] [Google Scholar]
- 22.Chowell G, Echevarria-Zuno S, Viboud C, et al. Epidemiological characteristics and underlying risk factors for mortality during the autumn 2009 pandemic wave in Mexico. PLoS One 2012;7:e41069. [DOI] [PMC free article] [PubMed] [Google Scholar]
- 23.Delgada-Rodriguez M, Castilla J, Gordoy P, et al. Prognosis of hospitalized patients with 2009 H1N1 influenza in Spain: influence of neuraminidase inhibitors. Antimicrob Chrmother 2012;67:1739-45. [DOI] [PMC free article] [PubMed] [Google Scholar]
- 24.Marija Kojicic P, Kovacevic N, Batranovic J, et al. Characteristics and outcome of mechanically ventilated patients with 2009 H1N1 influenza in Bosnia and Herzegovina and Serbia: impact of newly established multidisciplinary intensive care units. Croat Med J 2012;53:620-6. [DOI] [PMC free article] [PubMed] [Google Scholar]
- 25.Miller AC, Subramanian RA, Safi F, et al. Influenza A 2009 (H1N1) virus in admitted and critically ill patients. J Intensive Care Med 2012;27:25-31. [DOI] [PubMed] [Google Scholar]
- 26.Wane J, Nytanyi T, Nkunda R, et al. Pandemic influenza (H1N1) virus outbreak and response - Rwanda, October, 2009-May, 2010. PLoS One 2012;7:e31572. [DOI] [PMC free article] [PubMed] [Google Scholar]
- 27.Chudasama RK, Patel UV, Verma PB, et al. Clinico-epidemiological features of the hospitalized patients with 2009 pandemic influenza A (H1N1) virus infection in Saurashtra region, India (September, 2009 to February, 2010). Lung Ind 2011;28:11-5. [DOI] [PMC free article] [PubMed] [Google Scholar]
- 28.Gilca R, Serres GD, Boulianne N, et al. Risk Factors for hospitalization and severe outcomes of 2009 pandemic H1N1 influenza in Quebec, Canada. Influenza Other Respir Viruses 2011;5:247-55. [DOI] [PMC free article] [PubMed] [Google Scholar]
- 29.Ward KA, Spokes PJ, McAnulty JM. Case-control study of risk factors for hospitalization caused by pandemic (H1N1) 2009. Emerg Infect Dis 2011;17:1409-16. [DOI] [PMC free article] [PubMed] [Google Scholar]
- 30.Yokota RTC, Skalinski LM, Igansi CN, et al. Risk factors for death from pandemic (H1N1). 2009, Southern Brazil. Emerg Infect Dis 2011;17:1467-71. [DOI] [PMC free article] [PubMed] [Google Scholar]
- 31.Van Kerkhove MD, Vandemaele KAH, Shinde V, et al. Risk factors for severe outcomes following 2009 Influenza A (H1N1) infection: A global pooled analysis. PLoS Med 2011;8:e1001053. [DOI] [PMC free article] [PubMed] [Google Scholar]
- 32.Allard R, Tremblay C, Leclerc P, Tannunbaum TN. Diabetes and the severity of pandemic Influenza A (H1N1) infection. Diab Care 2010;33:1491-3. [DOI] [PMC free article] [PubMed] [Google Scholar]
- 33.Carcione D, Giele C, Dowse GK, et al. Comparison od pandemic (H1N1) 2009 and seasonal influenza, Western Australia, 2009. Emerg Infect Dis 2010;16:1388-95. [DOI] [PMC free article] [PubMed] [Google Scholar]
- 34.Fajardo-Dolci G, Gutierrez-Vega R, Arboleya-Casanova H, et al. Clinical characteristics of fatalities due to influenza A (H1N1) virus in Mexico. Thorax 2010;65:505-9. [DOI] [PubMed] [Google Scholar]
- 35.Koegelenberg CFN, Irusen EM, Cooper R, et al. High mortality from respiratory failure secondary to swine-origin influenza A (H1N1) in South Africa. QJ Med 2010;103:319-25. [DOI] [PubMed] [Google Scholar]
- 35.Venkata C, Sampathkumar P, Afessa B. Hospitalized patients with 2009 H1N1 influenza infection: the Mayo clinic experience. Mayo Clin Proc 2010;85:798-805. [DOI] [PMC free article] [PubMed] [Google Scholar]
- 37.Xi X, Jiang L, Li A, et al. Hospitalized adult patients with 2009 influenza A (H1N1) in Beijing, China: risk factors for hospital mortality. BMC Infect Dis 2010;10:256. [DOI] [PMC free article] [PubMed] [Google Scholar]
- 38.Centers for Disease Control and Prevention. Death related to 2009 pandemic influenza A (H1N1) among American Indian/Alaska Natives - 12 States, 2009. Morbidity and Mortality Weekly Report MMWR 2009;58:1341-4. [PubMed] [Google Scholar]
- 39.Kwan-Gett TS, Baer A, Duchin JS. Spring 2009 H1N1 influenza outbreak in King County, Washington. Disaster Med Public Health Prepared 2009;3:S109-16. [DOI] [PubMed] [Google Scholar]
- 40.Shalhoub S, Farahat F, Al-Jiffri A, et al. IFN- 2a or IFN- 1a in combination with ribavirin to treat Middle East respiratory syndrome coronavirus pneumonia: a retrospective study. Antimicrob Chemother 2015;70:2129-32. [DOI] [PMC free article] [PubMed] [Google Scholar]
- 41.Al-Tawfiq JA, Momattin H, Dib J, Memish ZA. Ribavirin and interferon therapy in patients infected with the Middle East respiratory syndrome coronavirus: an observational study. Int J Infect Dis 2014;20: 42-6. [DOI] [PMC free article] [PubMed] [Google Scholar]
- 42.Memish ZA, Cotton M, Watson SJ, et al. Community case cluster of Middle East respiratory syndrome coronavirus in Hafr Al-Batin, Kingdom of Saudi Arabia: a descriptive genomic study. Int J Infect Dis 2014;23:63-8. [DOI] [PMC free article] [PubMed] [Google Scholar]
- 43.Memish ZA, Zumla AI, Assiri A. Middle East respiratory syndrome coronavirus infections in health care workers. N Engl J Med 2013;369:884-6. [DOI] [PubMed] [Google Scholar]
- 44.The WHO MERS-CoV Research Group. State of knowledge and data gaps of Middle East Respiratory syndrome coronavirus (MERSCoV) in humans. PLOS Currents Outbreaks 2013;1. [DOI] [PMC free article] [PubMed] [Google Scholar]
- 45.Cohen A. Comparison of correlated correlations. Stat Med 1989;8:1485-95. [DOI] [PubMed] [Google Scholar]
- 46.Landis JR, Koch GG. The measurement of observer agreement for categorical data. Biometrics 1977;33:159-74. [PubMed] [Google Scholar]
- 47.Badawi A, Arora P, Sadoun E, et al. Prevalence of vitamin D insufficiency in Qatar: a systematic review. J Publ Health Res 2012;1:229-35. [DOI] [PMC free article] [PubMed] [Google Scholar]
- 48.Wallace BC, Dahabreh IJ, Trikalinos TA, et al. Closing the gap between methodologists and end-users: R as a computational back-end. J Stat Software 2012;49:1-15. [Google Scholar]
- 49.Cochran WG. The combination of estimates from different experiments. Biometrics 1954;10:101-29. [Google Scholar]
- 50.Higgins JPT, Thompson SG. Quantifying heterogeneity in a meta-analysis. Stat Med 2002;21:1539-58. [DOI] [PubMed] [Google Scholar]
- 51.DerSimonian R, Laird N. Meta-analysis in clinical trials. Control Clin Trials 1986;7:177-88. [DOI] [PubMed] [Google Scholar]
- 52.Guleria R, Kuma J, Mohan A, Wig N. Influenza A: From highly pathogenic H5N1 to pandemic 2009 H1N1. Epidemiology and clinical features. Ind J Microbiol 2009;49:315-9. [DOI] [PMC free article] [PubMed] [Google Scholar]
- 53.Newman AP, Residorf E, Beinemann J, et al. Human case of swine influenza A (H1N1) triple reassortant virus infection, Wisconsin. Emerg Infect Dis 2008;14:1470-2. [DOI] [PMC free article] [PubMed] [Google Scholar]
- 54.Veljkovic V, Niman HL, Glisic S, et al. Identification of hemagglutinin structural domain and polymorphisms which may modulate swine H1N1 interactions with human receptor. BMC Structural Biol 2009;9:62. [DOI] [PMC free article] [PubMed] [Google Scholar]
- 55.Milne-Price S, Miazgowicz KL, Munster VJ. The emergence of the Middle East Respiratory Syndrome coronavirus. Pathogens Dis 2014;71:121-36. [DOI] [PMC free article] [PubMed] [Google Scholar]
- 56.Khalafalla AI, Lu X, Al-Mubarak AIA, et al. MERS-CoV in upper respiratory tract and lungs of dromedary camels, Saudi Arabia, 2013-2014. Emerg Infect Dis 2015;12:1153-8. [DOI] [PMC free article] [PubMed] [Google Scholar]
- 57.Memish ZA, Mishra N, Olival KJ, et al. Middle East respiratory syndrome coronavirus in bats, Saudi Arabia. Emerg Infect Dis 2013;19:1819-23. [DOI] [PMC free article] [PubMed] [Google Scholar]
- 58.Cauchemez S, Fraser C, Van Kerkhove MD, et al. Middle East respiratory syndrome coronavirus: quantification of the extent of the epidemic, surveillance biases, and transmissibility. Lancet Infect Dis 2014;14:50-6. [DOI] [PMC free article] [PubMed] [Google Scholar]
- 59.Korea Centers for Disease Control and Prevention. Middle East Respiratory Syndrome Coronavirus Outbreak in the Republic of Korea, 2015. Osong Pub Health Res Perspect 2015;6:269-78. [DOI] [PMC free article] [PubMed] [Google Scholar]
- 60.Gardner LM, MacIntyre CR. Unanswered questions about the Middle East respiratory syndrome coronavirus (MERS-CoV). BMC Res Notes 2014;7:358. [DOI] [PMC free article] [PubMed] [Google Scholar]
- 61.Writing Committee of the Second World Health Organization Consultation on Clinical Aspects of Human Infection with Avian Influenza A (H5N1) Virus. Update on avian influenza A (H5N1) virus infection in humans. N Engl J Med 2008;358:261-73. [DOI] [PubMed] [Google Scholar]
- 62.Hancock K, Veguilla V, Lu X, et al. Cross-reactive antibody responses to the 2009 pandemic H1N1 influenza virus. N Engl J Med 2009;361:1945-52. [DOI] [PubMed] [Google Scholar]
- 63.Kok J, Dwyer DE. How common was 2009 pandemic influenza A H1N1? Lancet Infect Dis 2011;11:423-4. [DOI] [PubMed] [Google Scholar]
- 64.Tumpey TM, Garcia-Sastre A, Taubenberger JK, et al. Pathogenicity and immunogenicity of influenza viruses with genes from the 1918 pandemic virus. Proc Natl Acad Sci 2004;101:3166-71. [DOI] [PMC free article] [PubMed] [Google Scholar]
- 65.Davenport FM, Hennessay AV, Francis T. Epidemiologic and immunologic significance of age distribution of antibody to antigenic variants of influenza virus. J Experl Med 1953;98:641-56. [DOI] [PMC free article] [PubMed] [Google Scholar]
- 66.Fowler RA, Kumar A, Christian M, Martin CM. Guidance for the management of severe acute respiratory infection in the intensive care unit. Canadian Critical Care Society 2013. Available from: http://www.canadiancriticalcare.org/website/Guidelines/CCCS%20SARI%20guidance%20January%202014.pdf. [Google Scholar]
- 67.Mokdad AH, Jaber S, Abdel Aziz MI, et al. Burden of disease, injuries, and risk factors in the Arab World 1990-2010. Lancet 2014;383:62189-3. [Google Scholar]
- 68.Vos T, Barber RM, Bell B, et al. Global, regional, and national incidence, prevalence, and years lived with disability for 301 acute and chronic diseases and injuries in 188 countries, 1990-2013: a systematic analysis for the Global Burden of Disease Study 2013. Lancet 2015;386:743-800. [DOI] [PMC free article] [PubMed] [Google Scholar]
- 69.Al-Mahroos F, Al-Roomi K. Overweight and obesity in the Arabian Peninsula: an overview. J R Soc Promot Health 1999;119:251-3. [DOI] [PubMed] [Google Scholar]
- 70.Mertz D, Kim TH, Johnstone J, et al. Populations at risk for severe or complicated influenza illness: systematic review and meta-analysis. BMJ 2013;347:f5061. [DOI] [PMC free article] [PubMed] [Google Scholar]
- 71.Choi BC, Shi F. Risk factors for diabetes mellitus by age and sex: results of the National Population Health Survey. Diabetologia 2001;44:1221-31. [DOI] [PubMed] [Google Scholar]
- 72.Alhyas L, McKay A, Majeed A. Prevalence of type 2 diabetes in the States of the co-operation council for the Arab States of the Gulf: a systematic review. PLoS One 2012;7:e40948. [DOI] [PMC free article] [PubMed] [Google Scholar]
- 73.Badawi A, Sayegh S, Sallam M, et al. The global relationship between the prevalence of diabetes mellitus and incidence of tuberculosis: 2000-2012. Glob J Healt Sci 2015;7:183-91. [DOI] [PMC free article] [PubMed] [Google Scholar]
- 74.International Diabetes Federation. Diabetes Atlas, Sixth Edition, 2013. IDF 2013. Available from: http://www.diabetesatlas.org. [Google Scholar]
- 75.Badawi A, Klip A, Haddad P, et al. Type 2 diabetes mellitus and inflammation: Prospects for biomarkers of risk and nutritional intervention. Diabetes Metab Syndr Obes 2010;3:173-86. [DOI] [PMC free article] [PubMed] [Google Scholar]
- 76.Dooley KE, Chaisson RE. Tuberculosis and diabetes mellitus: convergence of two epidemics. Lancet Infect Dis 2009;9:737-46. [DOI] [PMC free article] [PubMed] [Google Scholar]
- 77.Akbar DH. Bacterial pneumonia: comparison between diabetics and non-diabetics. Acta Diabetol 2001;38:77-82. [DOI] [PubMed] [Google Scholar]
- 78.Dharmashankar K, Widlansky ME. Vascular endothelial function and hypertension: insights and directions. Curr Hypertens Rep 2010;12:448-55. [DOI] [PMC free article] [PubMed] [Google Scholar]
- 79.Toledo J, George L, Martinez E, et al. Relevance of non-communicable comorbidities for the development of the severe forms of dengue: a systematic literature review. PLoS Negl Trop Dis 2016;10:e0004284. [DOI] [PMC free article] [PubMed] [Google Scholar]
- 80.Kesavadev J, Misra A, Das AK, et al. Suggested use of vaccines in diabetes. Ind J Endocrinol Metab 2012;16:886-93. [DOI] [PMC free article] [PubMed] [Google Scholar]
- 81.Arora P, Garcia-Bailo B, Dastani Z, et al. Genetic polymorphisms of innate immunity-related inflammatory pathways and their association with factors related to type 2 diabetes. BMC Med Genetics 2011;12:95. [DOI] [PMC free article] [PubMed] [Google Scholar]
- 82.American Diabetes Association. Influenza and Pneumococcal Immunization in Diabetes. Diabet Care 2004;27:S111-3. [DOI] [PubMed] [Google Scholar]
- 83.Centers for Disease Control and Prevention. Prevention and control of influenza: recommendations of the Advisory Committee on Immunization Practices (ACIP). Morbidity and Mortality Weekly Report MMWR 2006;55:1-41. [PubMed] [Google Scholar]
- 84.Burney LE. Influenza immunization: statement. Public Health Rep 1960;75:944. [PMC free article] [PubMed] [Google Scholar]
- 85.Fiore AE, Uyeki TM, Broder K, et al. Prevention and control of influenza with vaccines: recommendations of the Advisory Committee on Immunization Practices (ACIP), 2010. MMWR Recomm Rep 2010;59:1-62. [PubMed] [Google Scholar]
- 86.Remschmidt C, Wichmann O, Harder T. Vaccines for the prevention of seasonal influenza in patients with diabetes: systematic review and meta-analysis. BMC Med 2015;13:53. [DOI] [PMC free article] [PubMed] [Google Scholar]
- 87.American Diabetes Association. Standards of medical care - 2007. Diabet Care 2007;30:S4-42. [PubMed] [Google Scholar]
- 88.Schaffner W, Rehm SJ, Elasy TA. Influenza vaccination: an unmet need in patients with diabetes. Clin Diabet 2007;25:145-9. [Google Scholar]
- 89.Centers for Disease Control and Prevention. Influenza and pneumococcal vaccination coverage among persons aged 65 years and persons aged 18-64 years with diabetes or asthma - United States, 2003. Morbidity and Mortality Weekly Report MMWR 2004;53:1007-15. [PubMed] [Google Scholar]