Abstract
How protein–protein interactions regulate and alter histone modifications is a major unanswered question in epigenetics. The histone acetyltransferase p300 binds thymine DNA glycosylase (TDG); utilizing mass spectrometry to measure site-specific changes in histone acetylation, we found that the absence of TDG in mouse embryonic fibroblasts leads to a reduction in the rate of histone acetylation. We demonstrate that TDG interacts with the CH3 domain of p300 to allosterically promote p300 activity to specific lysines on histone H3 (K18 and K23). However, when TDG concentrations approach those of histones, TDG acts as a competitive inhibitor of p300 histone acetylation. These results suggest a mechanism for how histone acetylation is fine-tuned via interaction with other proteins, while also highlighting a connection between regulators of two important biological processes: histone acetylation and DNA repair/demethylation.
Graphical abstract
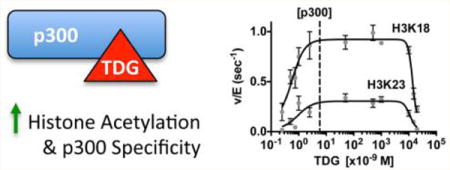
Biological systems are replete with proteins capable of interacting with and post-translationally modifying multiple downstream targets. Understanding how factors regulate the specific activity of such proteins provides a potential mechanism for manipulating their activity and thus the biological response to their activation. Lysine acetyltransferases (KATs) make up one such group of proteins, which can target multiple lysine residues on histones while still maintaining high selectivity for particular histone residues. We therefore investigated how the site specificity of a KAT can be altered through protein–protein interaction.
To study the effects of these protein–protein interactions, we utilized the base excision repair enzyme thymine DNA glycosylase (TDG), a protein lacking any acetyltransferase activity that is still able to influence histone acetylation rates.1 TDG plays an important role in both DNA repair and transcriptional regulation. TDG is responsible for repairing G/T and G/U mismatches that originate from spontaneous deamination of 5-methylcytosine and cytosine at CpG sites.2,3 In addition, TDG mediates DNA demethylation and transcriptional control.1–6 Reflecting these essential activities, mouse embryos that are TDG-null undergo embryonic lethality at day 11.5 and are characterized by impaired gene regulation, hypermethylation of CpG islands, defective demethylation of developmentally regulated promoters and/or enhancers, and alterations in rates of histone modification.1,5 Because even small changes in DNA methylation cause developmental abnormalities and lethality,7 altered methylation patterns in TDG-null embryos are a potential cause of observed lethality.1,5 However, disruption of histone acetylation in TDG-null embryos is also likely to play a role in lethality, as dynamic histone modification is important to early development and has explicitly been shown to be required for the development of mouse oocytes.8 Thus, it is important to understand the mechanisms underlying TDG-dependent alterations of histone acetylation.
TDG physically interacts with the KAT p300.5,9 p300 is a ubiquitous KAT that acetylates multiple residues in the histone octamer, regulating its activity.10,11 In addition, p300 can acetylate multiple lysine residues on the tail of the H3/H4 tetramer,11,12 as well on TDG itself.9 The acetylation of TDG by p300 alters the specificity of TDG glycosylase activity and negatively regulates protein interactions with partners such as SIRT1, APE1, and p300.13 The specific regions of interaction with TDG were mapped using the p300 homologue CBP, interacting on two highly conserved regions. The first is the CH3 domain (residues 1664–1806), a cysteine- and histidine-rich binding region that allows the interaction of p300 and CBP with a number of proteins, including p53, pCAF, and TDG.9,14 TDG also interacts with the functional KAT domain (residues 1284–1517).9 Interaction of TDG with p300 stimulates p300-dependent transcription and helps recruit p300 onto active promoters.5 These effects suggest that TDG may affect histone acetylation by controlling the activity of the p300 pathway. As it has become clear that not only the amount but also the location of acetylation is important for regulating chromatin compaction and therefore proper gene expression,15 we utilized a label-free, mass spectrometry-based approach, which allows simultaneous quantitation of the acetylation rates of multiple histone residues. By studying TDG-induced changes in p300 histone acetylation, both in cells and in vitro, utilizing this high-throughput methodology, we sought to better understand how this interaction influences the selective activity of p300 on specific histone lysines.
Using this methodology, we found that in TDG-knockout mouse embryo fibroblasts (MEFs), histone acetylation levels are significantly reduced in comparison to those of wild-type MEFs, with the strongest effects at histone H3 lysine 18 and 23. In vitro, we found that at low concentrations, binding of TDG to the CH3 domain of p300 allosterically activates p300 acetylation activity, but at high concentrations, TDG serves as a competitive inhibitor of p300–histone binding. Importantly, we found that allosteric interaction by TDG alters p300 residue specificity, or its tendency to target a particular lysine on histones. These results reveal a complex framework for transcriptional control by which histone acetylation is linked to base excision repair and DNA demethylation.
EXPERIMENTAL PROCEDURES
Reagents
All chemicals were purchased from either Sigma-Aldrich or Fisher Scientific; the purity was the highest commercial grade available or liquid chromatography–mass spectrometry grade. Ultrapure water was generated from a Millipore Direct-Q 5 ultrapure water system. Recombinant histone H3 and H4 were purified and provided from the Protein Purification Core at Colorado State University (Fort Collins, CO). Acetyl-CoA was obtained from Sigma-Aldrich.
Protein Purification
Full length p300 was expressed and purified from Sf9 cells as previously described.11 The p300 construct was graciously provided by K. Luger (Colorado State University). Expression constructs of human wild-type and mutant P65A TDG protein were prepared in vector pET-FPHn, which provides a Flag-PKA-6-histidine tag, and expressed in Rosetta(DE3) (LacI) cells. Purification was performed on a GE Healthcare HiTrap Chelate column charged with Ni2+ followed by purification on a GE Healthcare HiTrap Q column, as previously described.5 The p300 catalytic domain was prepared by expressed protein ligation as described previously and contains p300 residues 1287–1652, M1652G, K1637R, with the regulatory loop (residues 1523–1554) deleted, expressed in the pTYB2 vector, and ligated to residues 1653–1666 for the active construct.16
kcat Conditions
Initial experiments to determine whether TDG affects p300 acetylation were conducted under kcat conditions in buffer containing 100 mM ammonium bicarbonate and 50 mM HEPES buffer (pH 7.8) at 37 °C. All reactions were performed in the presence of 0.2% DMSO. Experiments were performed utilizing excess H3/H4 (15 μM) and acetyl-CoA (200 μM), in the presence of p300 (5 nM) and in the presence or absence of 25 nM TDG or the P65A TDG mutant. A time course was performed to determine the rate (v/E) of acetylation. Assays were quenched using 4 volumes of trichloroacetic acid (TCA) and prepared for mass spectrometry analysis as previously described.11
Enzymatic Kinetic Assays for p300
Steady-state kinetic experiments for the H3/H4 tetramer were performed under the conditions described above. However, steady-state assays contained varying levels of acetyl-CoA (1–200 μM), and TDG was present at a concentration of 300 nM.
Competition with the p53 Peptide
Steady-state kinetic experiments for the H3/H4 tetramer were performed under conditions similar to those described above. Samples for experiments contained excess H3/H4 (15 μM) and acetyl-CoA (200 μM), in the presence of p300 (30 nM) and in the presence or absence of 50 nM TDG and/or the p53 peptide (amino acids 38–61).
TDG Titrations
Experiments were performed under the same conditions described above. However, TDG concentrations were varied from 0.25 nM to 15 μM.
Mouse Embryonic Fibroblasts
Tdg wild-type and knockout mouse embryo fibroblasts (MEFs), prepared as previously described,5,17 were cultured in DMEM supplemented with 15% fetal bovine serum, 1 mM sodium pyruvate, 2 mM glutamine, 10 units/mL penicillin, and 10 μg/mL streptomycin. Cells were seeded in triplicate at 70% confluency in DMEM supplemented with 10% charcoal-stripped fetal bovine serum and, after incubation for 24 h, were treated with 1 μM retinoic acid (Sigma-Aldrich) or with the vehicle (ethanol) alone. After 24 h, cells were harvested and processed for mass spectrometry analysis.
TDG Knockdown
TDG knockdown was performed as previously described.5 Briefly, constructs of control pLKO lentivirus and TDG-targeting shRNA lentivirus (Thermo Scientific OpenBio-Systems) and the appropriate packaging plasmids were transfected into 95% confluent 293T cells, following the manufacturer’s recommendations (ViraPower Lentiviral Expression System, Invitrogen, Life Technologies). Supernatants were harvested 48 h after transfection, filtered through 0.45 μm pore filters (Millipore), and used to infect Mel501 melanoma cells. Control pLKO and TDG shRNA lentivirus-infected Mel501 melanoma cells were selected in puromycin (0.5 μg/mL) for 48 h.
Western Blot
Lysates were prepared from control pLKO and TDG shRNA lentivirus-infected Mel501 melanoma cells in RIPA buffer [50 mM Tris-HCl (pH 7.4), 150 mM NaCl, 1% sodium deoxycholate, 1% Triton X-100, 0.1% SDS, 10 mM NaF, and sodium pyrophosphate, sodium orthovanadate, dithiothreitol, and EDTA (1 mM each)] with protease inhibitors. Lysates were separated by sodium dodecyl sulfate–polyacrylamide gel electrophoresis and transferred to a polyvinylidene difluoride membrane (Millipore). The membrane was blocked in 5% nonfat dry milk in TBST (150 mM NaCl, 20 mM Tris, and 0.1% Tween 20) and incubated with the anti-TDG antibody (Abcam) at a 1/1000 dilution in 4% nonfat dry milk in TBST. A Western blot with the anti-β-actin antibody (Sigma) was used as a loading control. Detection was performed using enhanced chemiluminescence (Amersham).
Measurement of Acetylation from Cell Culture Samples
Histones were extracted overnight from cell pellets using 0.2 N HCl. Histones were precipitated with trichloroacetic acid (TCA) and prepared for mass spectrometry analysis as previously described.11 Quantification of acetylation marks was performed using mass spectrometry analysis, as outlined below.
UPLC–MS/MS Analysis
A Waters (Milford, MA) Acquity H-class UPLC system coupled to a Thermo TSQ Quantum Access (Waltham, MA) triple-quadrupole (QqQ) mass spectrometer was used to quantify acetylated H3/H4 peptides, as previously described.11,18
QqQ MS Data Analysis
Each acetylated and/or propionylated peak was identified by retention time and specific transitions, as previously reported.11,18 The resulting peak integration was performed using Xcalibur version 2.1 (Thermo). The fraction of a specific peptide (Fp) is calculated with eq 1
| (1) |
where Is is the intensity of a specific peptide state and Ip is the intensity of any state of that peptide, and analyzed as previously described.18,19
Data Analysis
All models were fit to the data using Prism (version 5.0d). The initial rates (v) of acetylation were calculated from the linear increase in the rate of acetylation as a function of time prior to 10% of the sum of acetylated residues. To measure steady-state parameters for acetyl-CoA, we calculated the initial rates on the basis of time points at which <10% of the acetyl-CoA was consumed (based on a coupled assay20) and the acetylated H3/H4 fraction is <0.1 times the fraction of unacetylated H3/H4. kcat, K1/2, and the Hill coefficient (nH) were determined by fitting the equation
| (2) |
where [S] is the concentration of substrate (i.e., acetyl-CoA) and [E] is the concentration of enzyme (p300). TDG titration data were fit using the following equation, assuming an equilibrium between p300 (E) and TDG (T) that is activating (Ka), and a second concentration that is inhibiting (Ki):
| (3) |
For comparisons of v/[E], the significance of the change in rate was calculated using Prism, via two-tailed, unpaired t tests.
RESULTS
MEFs and Melanoma Cells Lacking TDG Display Decreased Histone Acetylation Levels
The basis of this study is the observation that loss of TDG affects histone acetylation.1,5 Thus, we first established the site-specific differences in histone acetylation in MEFs expressing wild-type TDG versus TDG-null MEFs (Figure 1A). We quantitated the levels of histone acetylation using a label-free, mass spectrometry-based assay, which allows simultaneous detection of acetylation at multiple lysine residues.21 In TDG-null MEFs, levels of acetylation at histone H3, lysine 9 (H3K9), H3K18, and H3K23 were significantly reduced, with a more modest decrease observed at H3K14 (Figure 1A). Similarly, shRNA knockdown of TDG in Mel501 (melanoma) cells (Figure 1B) also indicated a reduction in the rate of histone acetylation at each of these sites (Figure 1C), although to a lesser extent than in the TDG-null MEFs.
Figure 1.
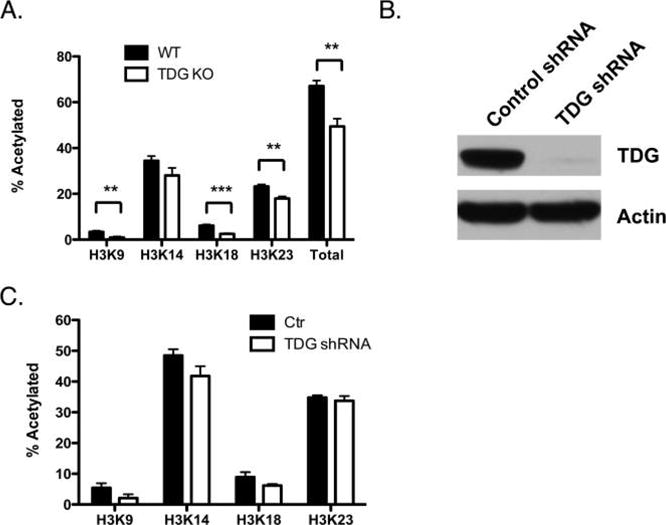
Loss of TDG leads to decreased histone acetylation levels in mouse embryonic fibroblasts. (A) Characterization of histone acetylation in wild-type MEFs (black) and MEFs lacking TDG (white). The bars labeled Total represent the sum of H3K9, K14, K18, and K23 acetylation. (B) Western blot confirming knockdown of TDG in Mel501 cells utilizing shRNA against TDG. (C) Comparison of the fraction of histone acetylated on H3 in the control vector infection (black bars) and shRNA TDG knockdown (white bars) cells, quantitated via mass spectrometry analysis. Bars show the mean value, with the error bars representing the standard error of the mean determined from three samples. **p < 0.01; ***p < 0.001.
TDG Increases the Rate of p300 Histone Acetylation
As we hypothesized that the interaction between p300 and TDG leads to regulation of histone acetylation, we next investigated whether the TDG–p300 complex is more active than p300 alone, in addition to whether this complex has an altered site-specific activity compared to p300 alone. To test this, we performed in vitro kinetic assays using purified, recombinant p300 and TDG in the presence of excess substrate (histone H3/H4 tetramer) and excess cofactor acetyl-CoA. These saturating conditions allowed us to observe the effect of TDG on the kcat of p300, in other words, whether TDG is affecting the maximal rate of p300 histone acetylation. For these experiments, in addition to wild-type TDG, we also utilized a purified P65A mutant of TDG, which is unable to bind to p300.22
At 25 nM TDG and 5 nM p300 and with the histone tetramer at a higher, saturating concentration (15 μM), we saw a significant increase in the rate of acetylation at both H3K18 (~1.7-fold) and H3K23 (~2.2-fold). Of note is the fact that these changes are not uniform across both sites, demonstrating that the presence of TDG shifts the residue selectivity of p300. Meanwhile, the negative control P65A mutant displayed no stimulation of p300 histone acetylation for any site on the H3 tail (Figure 2). These results indicate that the observed effect of TDG on histone acetylation is due to a direct interaction with p300, and the site-specific changes in histone acetylation suggest that TDG is altering the selectivity of p300. Having observed the greatest rate of stimulation on H3K18 and H3K23, we focused on these two sites for further analysis.
Figure 2.
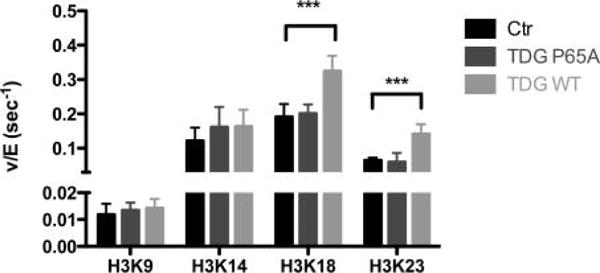
Wild-type TDG but not the P65A mutant stimulates p300 histone acetylation. A time course to determine the rate (v/[E], or the rate normalized to the enzyme concentration) of p300 acetylation was performed in the presence of excess H3/H4, and acetyl-CoA, in the absence of TDG (black), 25 nM TDG P65A (dark gray), or wild-type TDG (light gray), as described in Experimental Procedures. Acetylation of the H3 tail residues was analyzed via SRM mass spectrometry. ***p < 0.001.
TDG Stimulation of p300 Plateaus and Decreases, as High Levels of TDG Can Compete with H3/H4 for p300 Binding
As p300 is known to acetylate TDG,9 TDG must, under certain conditions, occupy the acetyltransferase domain of p300, raising the hypothetical possibility that at high concentrations, TDG might compete with histones as a p300 substrate. To test this possibility, we evaluated the ability of p300 to acetylate histones over a wide range of TDG concentrations (0.25 nM to 15 μM), with the highest concentration being equimolar to that of H3/H4 (Figure 3A).
Figure 3.
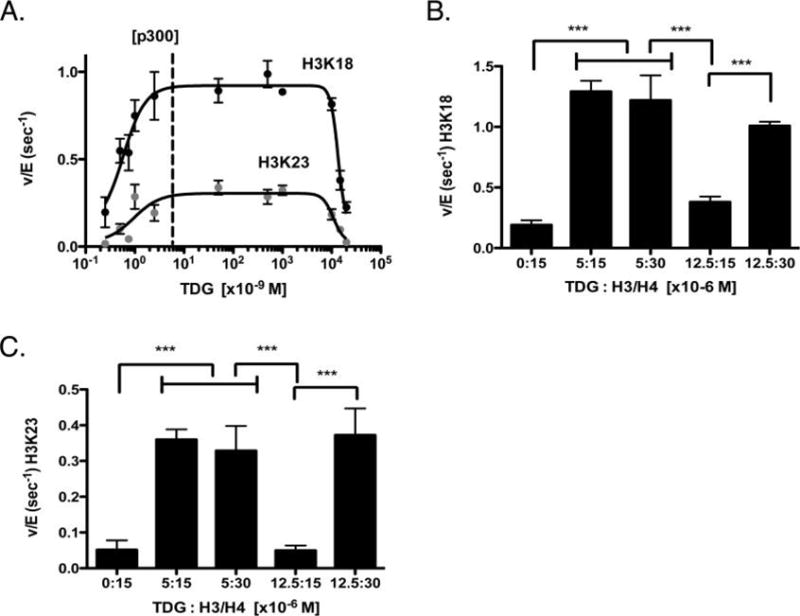
Concentration-dependent effects of TDG on the rate of p300 histone acetylation. (A) Rate of p300 histone acetylation in the presence of saturating H3/H4 and acetyl-CoA as a function of TDG concentration. The rate of acetylation for H3K18 and H3K23 is shown, with the dotted line indicating the amount of p300 utilized, for reference. (B and C) Comparative rates of acetylation with various ratios of TDG to H3/H4 (shown in micromolar), for H3K18 and H3K23, respectively. ***p < 0.001.
Titrating TDG at concentrations well below that of histones, we saw an increase in p300 activity, in agreement with the previous results. As TDG concentrations began to approach those of H3/H4, the stimulatory effect of TDG on H3K18 and H3K23 was reduced (Figure 3A). Importantly, when TDG and H3/H4 were equimolar, p300 HAT activity on histones was decreased to ~32% of the maximum seen at lower levels of TDG. We hypothesized that this was due to competitive inhibition, whereby TDG is competing with histones to bind to the KAT domain of p300. To test this hypothesis, we next determined whether increasing the concentration of H3/H4 would reverse the inhibition observed in our titrations. As we would predict from a competitive model, TDG inhibits p300 only when its concentration is close to that of H3/H4, whereas increasing the concentration of H3/H4 restores the higher rate of histone acetylation (Figure 3B,C). These data are consistent with competition between TDG and H3/H4 for the KAT domain. We chose this type of experiment because a classical competitive model is difficult to test in this system, which displays both high-affinity activation and inhibition at concentrations that approach the histone concentration. As a control, we also confirmed that, at a stimulatory concentration of TDG, increasing the H3/H4 concentration had no effect (Figure 3B,C). Taken together, these data suggest that at high concentrations, TDG is a competitive inhibitor of binding of H3/H4 to p300.
TDG Stimulation of p300 Requires the CH3 Domain of p300
We hypothesized that the bimodal behavior we observed might be due to the binding of TDG to two different regions of p300. This is based on the domain interaction mapping performed with CBP, where TDG is shown to bind to the CH3 and HAT domain of CBP.9 Thus, we hypothesize that TDG occupying the CH3 domain of p300 creates the stimulatory effect through an allosteric interaction, and once the CH3 domain becomes stably occupied, TDG binds the HAT domain (leading to a competitive inhibition with H3/H4). To refine this potential mechanism, we assessed histone acetylation by full length p300 or p300 lacking the ability to interact with TDG, under three incubation conditions: a low concentration of TDG, where stimulation is submaximal (10 nM TDG), a point at the plateau of stimulation (0.5 μM), and a point at which the rate of TDG stimulation of p300 is decreasing (15 μM). Assessment of the ability of each concentration of TDG to stimulate an isolated p300 HAT domain, lacking a CH3 domain, showed that no concentration of TDG stimulated activity of the p300 HAT domain alone (Figure 4A–D).
Figure 4.
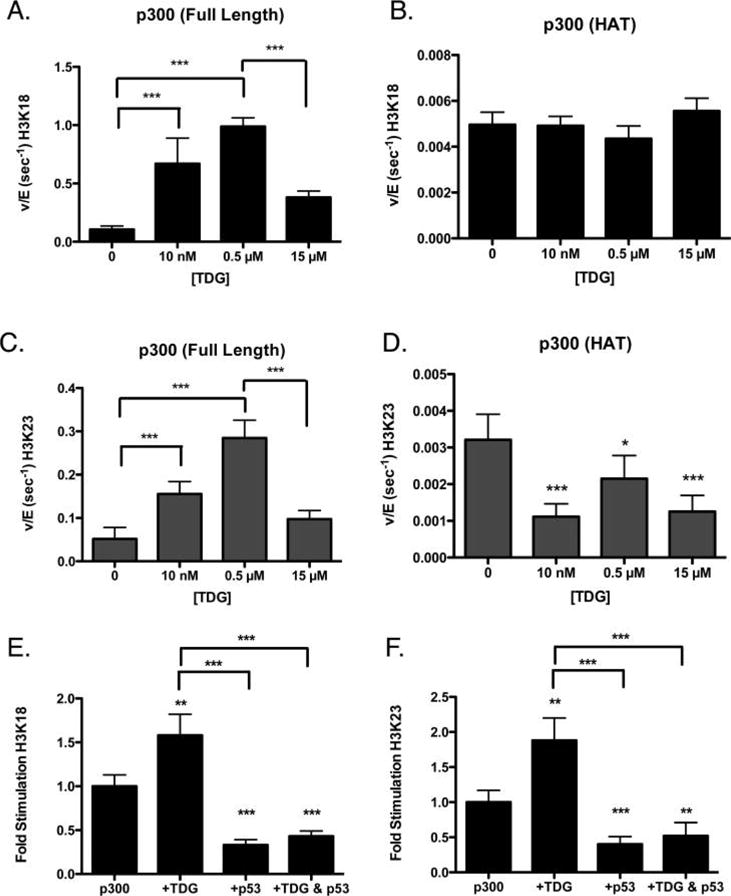
Isolated p300 KAT domain, lacking a CH3 domain, is not stimulated by TDG. The rate of full length p300 (A and C) or p300 KAT domain (B and D) acetylation of H3K18 (A and B) or H3K23 (C and D) is shown, in the presence of varying concentrations of wild-type TDG. The p53 peptide abrogates stimulation of p300 by TDG. The rate of acetylation at H3K18 (E) and H3K23 (F) decreases when p300 is bound by the p53 (amino acids 38–61) peptide. This interaction interferes with the stimulation caused by TDG. *p < 0.05; **p < 0.01; ***p < 0.001.
To further probe the importance of protein–protein interactions at the CH3 domain of p300, we also performed an experiment using a peptide of p53 (amino acids 38–61), which is able to bind to the CH3 domain.23 Interestingly, when both TDG and the p53 peptide were mixed together, even at nanomolar concentrations (5 nM p300, 50 nM TDG, and 50 nM p53), the p53 peptide was able to compete away the activation of TDG (Figure 4E,F). This loss of activation also suggests a more nuanced effect of the overall interaction of TDG with p300, as simply occupying the CH3 domain with the peptide was insufficient to yield a stimulatory effect.
Combining the information we had gained from these sets of experiments, we created a model of how TDG and p300 interaction influences histone acetylation (Figure 5). Our data are consistent with TDG having a high affinity for the CH3 domain of p300,9,24 and this complex is more active than p300 alone for certain residues. When TDG concentrations are sufficiently high, our model suggests that TDG can compete with histone for binding to the HAT domain of p300.
Figure 5.
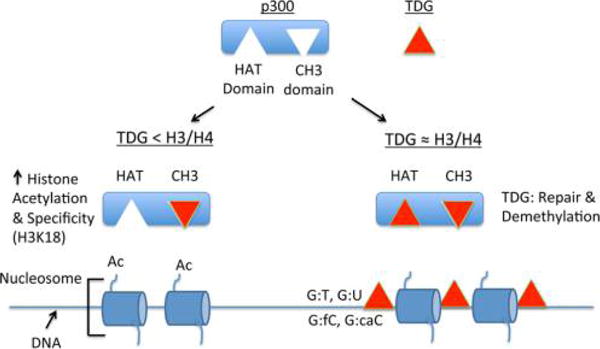
Model showing the effect of TDG concentration on stimulation or inhibition of p300 histone acetylation activity. TDG (red triangle) can bind two different domains of p300, the HAT domain, and the CH3 domain. At low concentrations, binding to the CH3 domain of p300 causes an allosteric activation of p300 histone acetylation, as well as increased specificity for H3K18. As concentrations of TDG approach the concentration of histone, TDG can compete for binding to the HAT domain of p300, decreasing the observed histone acetylation activity. Such a situation could potentially occur when high levels of TDG are localized sites of DNA damage or DNA demethylation.
Steady-State Analysis of p300 in the Presence of TDG
We have previously reported that under steady-state conditions, p300 preferentially acetylates the tail residues of the tetramer [lysine 9 (K9), K14, K18, and K23 in histone H3 and K5, K8, K12, and K16 in histone H4].11 While other residues can be acetylated by p300, acetylation of these sites is not observed under steady-state conditions.
Having observed the influence of TDG on p300 acetylation, we were interested in understanding how TDG influenced the specificity and selectivity of p300 for particular lysines on histones. Specificity is defined as and concerns the measurement of how an enzyme (in this case, p300) targets a particular substrate (in this case, one specific histone residue). To determine these kinetic values, we performed steady-state experiments with p300 in the presence of TDG (Figure 6 and Figure S1). For these experiments, we utilized 300 nM TDG, to ensure TDG concentrations were within the plateau of stimulatory activity. From these data, we are able to determine the kcat, K1/2, and Hill coefficient (nH) (Table 1). We were then able to compare the specificity of p300 in the presence of TDG to previous data for p300 alone (Figure 6D).25 For direct comparison, we again looked at each of the eight residues on H3 and H4 that undergo acetylation by p300 under steady-state conditions. Interestingly, in the presence of TDG, there is a decrease in the preference for H3K9 and H3K14, while there is a general increase in specificity for H3K18 and H3K23 (Figure 6D), consistent with the increased rate of acetylation we observed in previous experiments. In fact, upon examination of the kinetic parameters (Table 1), it becomes apparent that this increased specificity is largely driven by the increased kcat caused by the presence of TDG.
Figure 6.
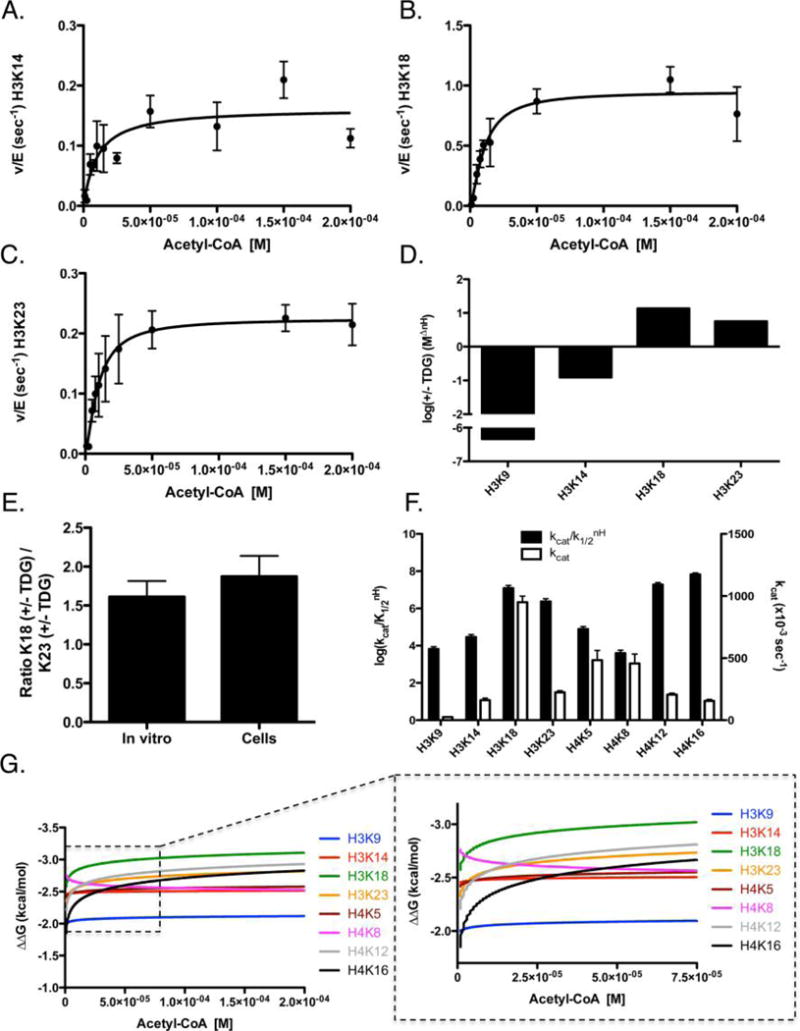
Determination of steady-state kinetic parameters of p300-mediated acetylation of histone H3/H4 tetramer in the presence of TDG. The data were fit by eq 2 for p300 acetylation of histone tetramer, with representative graphs shown for (A) H3K14, (B) H3K18, and (C) H3K23. (D) Log of the ratio of specificity between p300 in the presence and absence of TDG (+TDG/control). The remaining sites of acetylation for H3 and H4 can be found in Figure S1. The apparent kinetic parameters are summarized in Table 1. (E) Comparison of the ratio of K18 with and without TDG to the ratio of K23 with and without TDG, determined through kcat values (left bar) or through acetylation levels in cells (right bar). (F) Log of the specificity constant (black, left axis) and kcat (white, right axis) of p300 in the presence of 300 nM TDG. (G) ΔΔG for eight sites of H3/H4 was calculated from the steady-state parameters. These ΔΔG plots are graphed as a function of acetyl-CoA concentration in the presence of 300 nM TDG. Each line indicates how energetically favorable p300 acetylation of a particular residue is, as a function of acetyl-CoA concentration. Intersection points indicate the points at which acetylation of one site becomes more favorable than another; the insets show the corresponding graph with the axis magnified to better visualize these intersection points.
Table 1.
Steady-State Parameters of p300 Acetylation of H3/H4 Tetramer in the Absencea or Presence of 300 nM TDG
| kcat (×10−3 s−1) | K1/2 (×10−6 M) | kcat/K1/2 (×103 M−1 s−1) | nH (Hill coefficient) |
|
||
|---|---|---|---|---|---|---|
| p300 (alone) | ||||||
| H3K9 | 7.5 ± 0.4 | 8.6 ± 1.1 | 0.9 ± 0.1 | 2.4 ± 0.7 | (1.4 ± 0.2) × 1010 | |
| H3K14 | 30.6 ± 6.4 | 7.0 ± 5.0 | 4.4 ± 3.2 | 1.3 ± 0.2 | (2.4 ± 1.2) × 105 | |
| H3K18 | 380.5 ± 17.3 | 8.4 ± 1.3 | 45.1 ± 7.4 | 1.3 ± 0.1 | (9.0 ± 7.4) × 105 | |
| H3K23 | 145.0 ± 13.2 | 25.7 ± 6.2 | 5.6 ± 1.4 | 1.4 ± 0.1 | (4.2 ± 3.2) × 105 | |
| H4K5 | 36.1 ± 2.6 | 5.6 ± 1.5 | 6.4 ± 1.8 | not applicable | not applicable | |
| H4K8 | 24.0 ± 1.2 | 3.0 ± 0.8 | 7.9 ± 2.0 | not applicable | not applicable | |
| H4K12 | 35.9 ± 2.3 | 4.7 ± 1.2 | 7.6 ± 2.0 | not applicable | not applicable | |
| H4K16 | 32.4 ± 1.9 | 10.4 ± 2.2 | 3.1 ± 0.7 | not applicable | not applicable | |
| p300 and TDG | ||||||
| H3K9 | 25.0 ± 3.5 | 11.9 ± 4.5 | 2.1 ± 0.8 | 1.1 ± 0.4 | (6.6 ± 1.7) × 103 | |
| H3K14 | 161.2 ± 16.3 | 10.1 ± 3.1 | 16.0 ± 5.1 | 1.1 ± 0.3 | (2.9 ± 0.9) × 104 | |
| H3K18 | 950.6 ± 48.7 | 10.6 ± 1.5 | 89.7 ± 13.1 | 1.4 ± 0.3 | (1.2 ± 0.4) × 107 | |
| H3K23 | 224.7 ± 12.1 | 9.6 ± 1.3 | 23.5 ± 3.4 | 1.4 ± 0.3 | (2.4 ± 0.8) × 106 | |
| H4K5 | 483.7 ± 77.4 | 25.3 ± 11.1 | 19.2 ± 8.9 | 1.1 ± 0.4 | (7.8 ± 2.4) × 104 | |
| H4K8 | 457.3 ± 75.1 | 14.0 ± 7.8 | 32.8 ± 9.0 | 0.8 ± 0.3 | (3.9 ± 1.5) × 103 | |
| H4K12 | 206.4 ± 10.9 | 9.1 ± 1.2 | 22.6 ± 3.2 | 1.6 ± 0.4 | (1.9 ± 0.5) × 107 | |
| H4K16 | 156.0 ± 11.9 | 14.6 ± 2.7 | 10.7 ± 2.1 | 1.8 ± 0.5 | (6.6 ± 1.3) × 107 |
The kinetic parameters in italics were previously published25 and are included here only for ease of comparison.
In a past study, we examined the regulation of p300 activity by the small molecule C646 and noted that the ratio of the change in kcat values of K18 to K23 in vitro provided a useful tool for predicting changes in histone acetylation in cells.25 If the presence of a given factor, like TDG, leads to a 4-fold increase in the kcat of K18, and 2-fold in the kcat of K23, the ratio of change for K18/K23 is 2. Thus, if we introduce this factor into a cell, we would expect the change in the rate of K18 acetylation to be 2-fold higher than that of K23. Thus, we compared how the rates of acetylation changed in cells for H3K18 and H3K23, with and without TDG. This ratio was then compared against values obtained from our enzymatic assays of p300 (Table 1), to determine how the ratio of the kcat values changed in the presence of TDG. What we find is that these ratios are remarkably similar (Figure 6E), suggesting that the change in kinetic parameters we determined for TDG and p300 in vitro accurately described how the presence of TDG influences p300-mediated histone acetylation in cells.
Results were plotted to emphasize the specificity and kcat values (Figure 6F), while we also utilized the kinetic data to generate ΔΔG plots (Figure 6G), to visualize the effect of TDG on acetyl-CoA-dependent activity of p300 across a range of acetyl-CoA concentrations (as we have seen that p300 activity is dependent on acetyl-CoA concentration11,25). These data demonstrate a high specificity for H3K18 across a wide range of acetyl-CoA concentrations and a suppression of the acetyl-CoA-driven increase in the rate of acetylation of H3K9 that we had previously observed25 (Figure 6G).
DISCUSSION
Here we have set out to determine the mechanism for the role of TDG in the regulation of histone modification to improve our understanding of how protein–protein interactions influence KAT activity. In vitro, we demonstrate that TDG increases the rate of acetylation by p300 at some sites (H3K18 and H3K23) over others (H3K9 and H3K14). This increase is consistent with the decrease in the rate of acetylation observed in vivo with the loss of TDG. Utilizing the P65A TDG mutant, impaired in terms of p300 binding, we confirmed that the p300–TDG interaction was responsible for the activation of p300 at specific sites.
Our model of TDG–p300 interaction is composed of two parts: (1) the allosteric regulation of p300 by TDG binding to the CH3 domain of p300 and (2) TDG competing with histones for the HAT domain of p300 (Figure 5). Prior studies have suggested that CH3 engagement by other ligands such as Mastermind can stimulate p300 activity, although they have not investigated the impact on site selectivity as we have done here.26 Our model suggests that it is binding of TDG to the CH3 domain of p300 that stimulates p300 histone acetylation and modulates its selectivity (Figure 4). However, our observation that the p53 peptide inhibits p300 activity and negates the stimulatory effects of binding of TDG to p300 provides further insight into the complex nature of the regulation of lysine acetyltransferases. Clearly, binding to the CH3 domain in itself does not have a fixed biological response. These data suggest that CH3 is not simply an activation domain but likely serves as a more complex regulatory function. Such a function would emphasize the complex network of interactions that need to be unraveled to fully understand how the site-specific nature of histone modifications is regulated.
In addition to the observed effects at the CH3 domain of p300, TDG can compete with histones for binding to the KAT domain at higher concentrations. This is supported by the fact that during the inhibition phase, increasing histone levels restore their acetylation by p300 (Figure 3). These observations are relevant to the cellular behaviors: histone levels are likely present in vast excess over TDG, but in local contexts, e.g., during chromatin remodeling due to DNA damage or transcriptional activation, the two concentrations could become comparable.
It is important to emphasize that our findings show that the formation of the TDG–p300 complex is altering the specificity and selectivity of p300 histone acetylation. Because of the ability of p300 to target multiple residues, its specificity and selectivity (i.e., its preference for a particular site) need to be carefully regulated. As the site of modification on chromatin is vitally important to its function, identifying factors that can alter KAT specificity is key to understanding how the patterns of histone acetylation are regulated in the cell.27 In our previous studies, we have demonstrated the effects of acetyl-CoA levels on p300 specificity and have shown how this preference can be manipulated through the use of the drug C646, which binds to the acetyl-CoA binding pocket of p300.11,25 We have also demonstrated that the composition of the histone complex itself (histone H3 vs the H3/H4 tetramer) can influence the specificity of a KAT.11,28 Here we have observed that TDG is not only increasing the activity of p300 in general but also altering the specificity of p300, strengthening its preference for K18 on the H3 tail. This is important, as we have seen previously that p300 has a number of targets just on H3 and H4.11
Importantly, the changes in acetylation that we observe in MEFs (Figure 1A) also correspond with our in vitro kinetic data (Figure 6 and Table 1). In addition to observing a decrease in the rate of histone acetylation in MEFs in the absence of TDG, we also noted that the ratio of the change in K18/K23 in vivo correlated closely with the ratio of the change in kcat values of K18/K23 observed in vitro (Figure 6E). We have seen in the past that comparing ratios of kcat rates can be an important indicator of site-specific changes in cells.25 Thus, in addition to providing information about the roles of TDG, these results provide important insight into how protein–protein interactions regulate p300 activity and targeting and, on a broader scale, how KATs with the ability to target multiple sites can be regulated in vivo to fine-tune their acetylation preference. To the best of our knowledge, this is the first example of an allosteric activator regulating KAT specificity. Combined with the previously characterized ability of TDG to stimulate p300-dependent transcriptional activity and recruit p300 onto active promoters,5 our findings further emphasize the importance of the p300–TDG complex in proper development. The observation that TDG increases the specificity of p300 for H3K18 coincides with previous observations demonstrating the dynamic nature of this mark in mouse oocytes.8
In summary, we have observed that the presence of TDG influences the acetylation patterns of histone via its interaction with p300. While TDG stimulation of p300 acetylation occurs at almost all sites of the histone H3/H4 tail, the change in specificity favors acetylation of K18 on the H3 tail. Our data indicate TDG stimulation of p300 involves interaction with the CH3 domain of p300, while concentrations of TDG that are near equimolar with H3/H4 lead to a competition for p300 binding and inhibition of KAT activity. These results provide important information about the mechanism behind the role of TDG in regulating histone acetylation and may have implications for both embryonic development and cancer biology.
These studies provide further insight into the interactions that regulate p300 specificity (and KAT specificity in general) and create a more complete picture of how the biological activity of a KAT like p300 can be regulated within the cell by binding partners that in turn are affected by acetylation, thus providing a complex framework for transcriptional control. In the future, it will be interesting to explore how the stimulation of p300 by TDG compares to that of other proteins, as these interactions are likely important regulators that focus p300 to preferentially target one of the numerous residues it acetylates within the nucleosome. These experiments are necessary to gain greater insight into the complex network of interactions that control how the histone code is written.
Supplementary Material
Acknowledgments
We thank Dr. Timothy Yen for critical reading of the manuscript, comments, and advice. We gratefully thank the Fox Chase Cell Culture Facility.
Funding
This work was supported by National Institutes of Health (NIH) Grants CA78412 (to A.B.), GM62437 (to P.A.C.), and GM102503 (to A.J.A.), National Cancer Institute Grant CA06927 to the Fox Chase Cancer Center, a gift from John C. and Robin L. Spurlino with corporate matching funds from Johnson & Johnson, and an appropriation from the Commonwealth of Pennsylvania to the Fox Chase Cancer Center. The Pennsylvania Department of Health specifically disclaims responsibility for any analysis, interpretations, or conclusions. R.A.H. was supported by NIH Training Grant T32 CA009035-36A1.
ABBREVIATIONS
- acetyl-CoA
acetyl-coenzyme A
- DMSO
Dimethyl Sulfoxide
- TCA
trichloroacetic acid
- TDG
thymine DNA glycosylase
Footnotes
Supporting Information
The Supporting Information is available free of charge on the ACS Publications website at DOI: 10.1021/acs.biochem.6b00841.
Secondary plots of the remaining sites of H3/H4 for steady-state experiments with p300 in the presence of TDG (PDF)
Notes
The authors declare no competing financial interest.
References
- 1.Cortazar D, Kunz C, Selfridge J, Lettieri T, Saito Y, Macdougall E, Wirz A, Schuermann D, Jacobs AL, Siegrist F, Steinacher R, Jiricny J, Bird A, Schar P. Embryonic lethal phenotype reveals a function of TDG in maintaining epigenetic stability. Nature. 2011;470:419–423. doi: 10.1038/nature09672. [DOI] [PubMed] [Google Scholar]
- 2.Cortazar D, Kunz C, Saito Y, Steinacher R, Schar P. The enigmatic thymine DNA glycosylase. DNA Repair. 2007;6:489–504. doi: 10.1016/j.dnarep.2006.10.013. [DOI] [PubMed] [Google Scholar]
- 3.Bellacosa A, Drohat AC. Role of base excision repair in maintaining the genetic and epigenetic integrity of CpG sites. DNA Repair. 2015;32:33–42. doi: 10.1016/j.dnarep.2015.04.011. [DOI] [PMC free article] [PubMed] [Google Scholar]
- 4.Dalton SR, Bellacosa A. DNA demethylation by TDG. Epigenomics. 2012;4:459–467. doi: 10.2217/epi.12.36. [DOI] [PMC free article] [PubMed] [Google Scholar]
- 5.Cortellino S, Xu J, Sannai M, Moore R, Caretti E, Cigliano A, Le Coz M, Devarajan K, Wessels A, Soprano D, Abramowitz LK, Bartolomei MS, Rambow F, Bassi MR, Bruno T, Fanciulli M, Renner C, Klein-Szanto AJ, Matsumoto Y, Kobi D, Davidson I, Alberti C, Larue L, Bellacosa A. Thymine DNA glycosylase is essential for active DNA demethylation by linked deamination-base excision repair. Cell. 2011;146:67–79. doi: 10.1016/j.cell.2011.06.020. [DOI] [PMC free article] [PubMed] [Google Scholar]
- 6.Gregory DJ, Mikhaylova L, Fedulov AV. Selective DNA demethylation by fusion of TDG with a sequence-specific DNA-binding domain. Epigenetics. 2012;7:344–349. doi: 10.4161/epi.19509. [DOI] [PMC free article] [PubMed] [Google Scholar]
- 7.Gaudet F, Hodgson JG, Eden A, Jackson-Grusby L, Dausman J, Gray JW, Leonhardt H, Jaenisch R. Induction of tumors in mice by genomic hypomethylation. Science. 2003;300:489–492. doi: 10.1126/science.1083558. [DOI] [PubMed] [Google Scholar]
- 8.Kageyama S, Liu H, Kaneko N, Ooga M, Nagata M, Aoki F. Alterations in epigenetic modifications during oocyte growth in mice. Reproduction. 2007;133:85–94. doi: 10.1530/REP-06-0025. [DOI] [PubMed] [Google Scholar]
- 9.Tini M, Benecke A, Um SJ, Torchia J, Evans RM, Chambon P. Association of CBP/p300 acetylase and thymine DNA glycosylase links DNA repair and transcription. Mol Cell. 2002;9:265–277. doi: 10.1016/s1097-2765(02)00453-7. [DOI] [PubMed] [Google Scholar]
- 10.Kalkhoven E. CBP and p300: HATs for different occasions. Biochem Pharmacol. 2004;68:1145–1155. doi: 10.1016/j.bcp.2004.03.045. [DOI] [PubMed] [Google Scholar]
- 11.Henry RA, Kuo YM, Andrews AJ. Differences in specificity and selectivity between CBP and p300 acetylation of histone H3 and H3/H4. Biochemistry. 2013;52:5746–5759. doi: 10.1021/bi400684q. [DOI] [PMC free article] [PubMed] [Google Scholar]
- 12.Feller C, Forne I, Imhof A, Becker PB. Global and specific responses of the histone acetylome to systematic perturbation. Mol Cell. 2015;57:559–571. doi: 10.1016/j.molcel.2014.12.008. [DOI] [PubMed] [Google Scholar]
- 13.Madabushi A, Hwang BJ, Jin J, Lu AL. Histone deacetylase SIRT1 modulates and deacetylates DNA base excision repair enzyme thymine DNA glycosylase. Biochem J. 2013;456:89–98. doi: 10.1042/BJ20130670. [DOI] [PMC free article] [PubMed] [Google Scholar]
- 14.Chan HM, La Thangue NB. p300/CBP proteins: HATs for transcriptional bridges and scaffolds. J Cell Sci. 2001;114:2363–2373. doi: 10.1242/jcs.114.13.2363. [DOI] [PubMed] [Google Scholar]
- 15.Vo N, Goodman RH. CREB-binding protein and p300 in transcriptional regulation. J Biol Chem. 2001;276:13505–13508. doi: 10.1074/jbc.R000025200. [DOI] [PubMed] [Google Scholar]
- 16.Thompson PR, Wang D, Wang L, Fulco M, Pediconi N, Zhang D, An W, Ge Q, Roeder RG, Wong J, Levrero M, Sartorelli V, Cotter RJ, Cole PA. Regulation of the p300 HAT domain via a novel activation loop. Nat Struct Mol Biol. 2004;11:308–315. doi: 10.1038/nsmb740. [DOI] [PubMed] [Google Scholar]
- 17.Cortellino S, Turner D, Masciullo V, Schepis F, Albino D, Daniel R, Skalka AM, Meropol NJ, Alberti C, Larue L, Bellacosa A. The base excision repair enzyme MED1 mediates DNA damage response to antitumor drugs and is associated with mismatch repair system integrity. Proc Natl Acad Sci U S A. 2003;100:15071–15076. doi: 10.1073/pnas.2334585100. [DOI] [PMC free article] [PubMed] [Google Scholar]
- 18.Kuo YM, Andrews AJ. Quantitating the specificity and selectivity of Gcn5-mediated acetylation of histone H3. PLoS One. 2013;8:e54896. doi: 10.1371/journal.pone.0054896. [DOI] [PMC free article] [PubMed] [Google Scholar]
- 19.Smith CM, Gafken PR, Zhang Z, Gottschling DE, Smith JB, Smith DL. Mass spectrometric quantification of acetylation at specific lysines within the amino-terminal tail of histone H4. Anal Biochem. 2003;316:23–33. doi: 10.1016/s0003-2697(03)00032-0. [DOI] [PubMed] [Google Scholar]
- 20.Kim Y, Tanner KG, Denu JM. A continuous, nonradioactive assay for histone acetyltransferases. Anal Biochem. 2000;280:308–314. doi: 10.1006/abio.2000.4546. [DOI] [PubMed] [Google Scholar]
- 21.Kuo YM, Henry RA, Andrews AJ. A quantitative multiplexed mass spectrometry assay for studying the kinetic of residue-specific histone acetylation. Methods. 2014;70:127–133. doi: 10.1016/j.ymeth.2014.08.003. [DOI] [PMC free article] [PubMed] [Google Scholar]
- 22.Leger H, Smet-Nocca C, Attmane-Elakeb A, Morley-Fletcher S, Benecke AG, Eilebrecht S. A TDG/CBP/RARalpha ternary complex mediates the retinoic acid-dependent expression of DNA methylation-sensitive genes. Genomics, Proteomics Bioinf. 2014;12:8–18. doi: 10.1016/j.gpb.2013.11.001. [DOI] [PMC free article] [PubMed] [Google Scholar]
- 23.Ferreon JC, Lee CW, Arai M, Martinez-Yamout MA, Dyson HJ, Wright PE. Cooperative regulation of p53 by modulation of ternary complex formation with CBP/p300 and HDM2. Proc Natl Acad Sci U S A. 2009;106:6591–6596. doi: 10.1073/pnas.0811023106. [DOI] [PMC free article] [PubMed] [Google Scholar]
- 24.Teufel DP, Freund SM, Bycroft M, Fersht AR. Four domains of p300 each bind tightly to a sequence spanning both transactivation subdomains of p53. Proc Natl Acad Sci U S A. 2007;104:7009–7014. doi: 10.1073/pnas.0702010104. [DOI] [PMC free article] [PubMed] [Google Scholar]
- 25.Henry RA, Kuo YM, Bhattacharjee V, Yen TJ, Andrews AJ. Changing the Selectivity of p300 by Acetyl-CoA Modulation of Histone Acetylation. ACS Chem Biol. 2015;10:146–156. doi: 10.1021/cb500726b. [DOI] [PMC free article] [PubMed] [Google Scholar]
- 26.Hansson ML, Popko-Scibor AE, Saint Just Ribeiro M, Dancy BM, Lindberg MJ, Cole PA, Wallberg AE. The transcriptional coactivator MAML1 regulates p300 autoacetylation and HAT activity. Nucleic Acids Res. 2009;37:2996–3006. doi: 10.1093/nar/gkp163. [DOI] [PMC free article] [PubMed] [Google Scholar]
- 27.Peterson CL, Laniel MA. Histones and histone modifications. Curr Biol. 2004;14:R546–551. doi: 10.1016/j.cub.2004.07.007. [DOI] [PubMed] [Google Scholar]
- 28.Kuo YM, Henry RA, Huang L, Chen X, Stargell LA, Andrews AJ. Utilizing targeted mass spectrometry to demonstrate asf1-dependent increases in residue specificity for rtt109-vps75 mediated histone acetylation. PLoS One. 2015;10:e0118516. doi: 10.1371/journal.pone.0118516. [DOI] [PMC free article] [PubMed] [Google Scholar]
Associated Data
This section collects any data citations, data availability statements, or supplementary materials included in this article.


