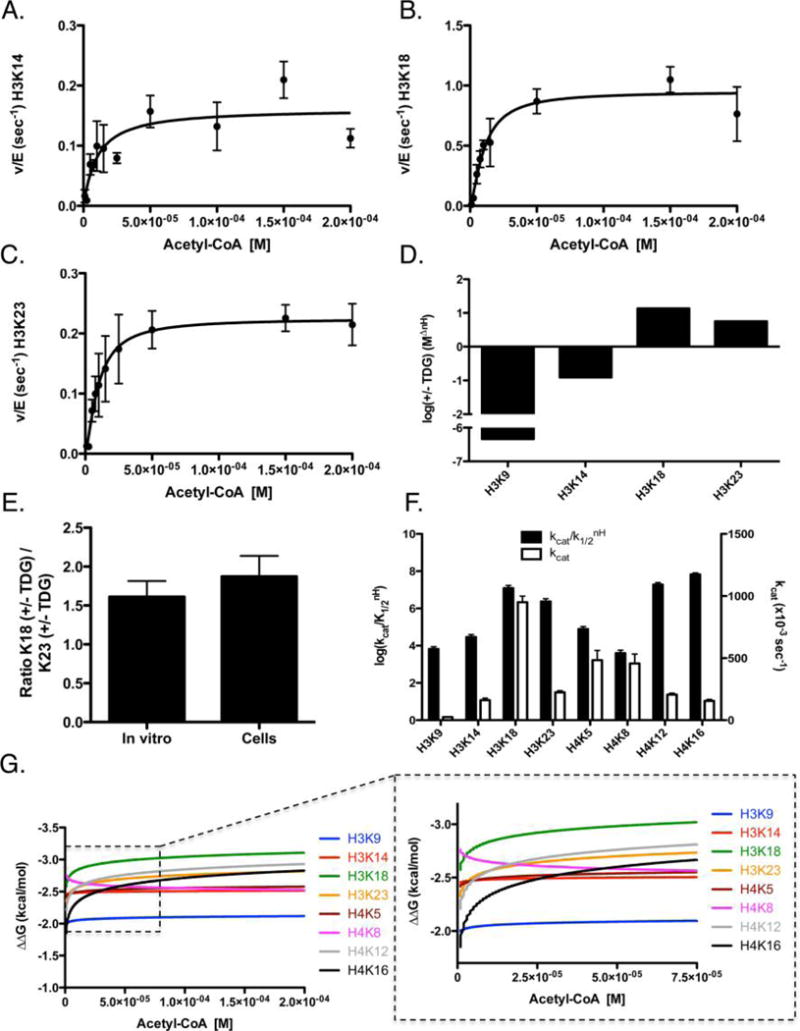
Figure 6.

Determination of steady-state kinetic parameters of p300-mediated acetylation of histone H3/H4 tetramer in the presence of TDG. The data were fit by eq 2 for p300 acetylation of histone tetramer, with representative graphs shown for (A) H3K14, (B) H3K18, and (C) H3K23. (D) Log of the ratio of specificity between p300 in the presence and absence of TDG (+TDG/control). The remaining sites of acetylation for H3 and H4 can be found in Figure S1. The apparent kinetic parameters are summarized in Table 1. (E) Comparison of the ratio of K18 with and without TDG to the ratio of K23 with and without TDG, determined through kcat values (left bar) or through acetylation levels in cells (right bar). (F) Log of the specificity constant (black, left axis) and kcat (white, right axis) of p300 in the presence of 300 nM TDG. (G) ΔΔG for eight sites of H3/H4 was calculated from the steady-state parameters. These ΔΔG plots are graphed as a function of acetyl-CoA concentration in the presence of 300 nM TDG. Each line indicates how energetically favorable p300 acetylation of a particular residue is, as a function of acetyl-CoA concentration. Intersection points indicate the points at which acetylation of one site becomes more favorable than another; the insets show the corresponding graph with the axis magnified to better visualize these intersection points.
