Abstract
High density lipoprotein (HDL) cholesterol levels are inversely correlated with the development of cardiovascular disease. To date, genetic association studies have only explained a small proportion of the overall variance in HDL. Further studies are needed, within practice-based cohorts, to place genetic findings into context alongside important clinical variables (e.g., age, gender, body mass index, medication use, and clinical co-morbidity). The Marshfield Clinic Personalized Medicine Research Project (PMRP) database was designed for large-scale studies of genetic epidemiology in a clinical practice-based setting. Because of its size and its unique practice-based design, this resource will provide adequate statistical power for the assessment of genetic findings related to HDL level within the context of covariates known to modify lipid homeostasis. We now report construction and validation of novel electronic phenotyping algorithms that can be used to model individual baseline HDL levels within this practice-based resource. Because these algorithms were developed in a setting that reflects routine clinical care, future genetic studies using these algorithms within practice-based DNA biobanks should facilitate the identification of markers with optimal effect size after adjustment for known clinical factors contributing to the overall variance in HDL level within the community.
Keywords: cholesterol, cardiovascular risk, risk reduction, populations, biobank
Introduction
High density lipoprotein (HDL) cholesterol levels are inversely correlated with coronary artery disease[1], and there is tremendous interest in characterizing the genetic architecture underlying this interaction[2–5]. Early work by our group leveraged linkage studies, in large extended families, to identify broad chromosomal loci associated with HDL[6, 7]. Subsequent work by our group led to the characterization of several positional candidate genes as well as a number of intriguing biological candidates.[8, 9] Other groups have utilized genome wide association studies (GWAS) to identify additional informative loci.[5] Despite these efforts, genes have explained only a small proportion of the overall variance in HDL.10–15 Large multi-institutional networks are therefore being constructed to facilitate genetic association studies of HDL level using electronic health care records (www.gwas.net).
The Marshfield Clinic Personalized Medicine Research Project (PMRP) was specifically designed for large-scale studies of genetic epidemiology in the community.[10] With ~20,000 participants, the PMRP database represents one of the largest population-based biobanks in the U.S.[11–13] This resource therefore provides adequate power for the assessment of HDL level, in the context of clinical covariates known to modify lipids. We now report the construction and validation of electronic algorithms that model baseline HDL level for PMRP participants, within the context of routine clinical care.
Methods
This study was approved by the Institutional Review Board of the Marshfield Clinic, and conducted in accordance with the basic principles of the Declaration of Helsinki. All study subjects have provided informed consent through their prior participation in the Marshfield Clinic Personalized Medicine Research Project (PMRP).[10]
Initial data extraction
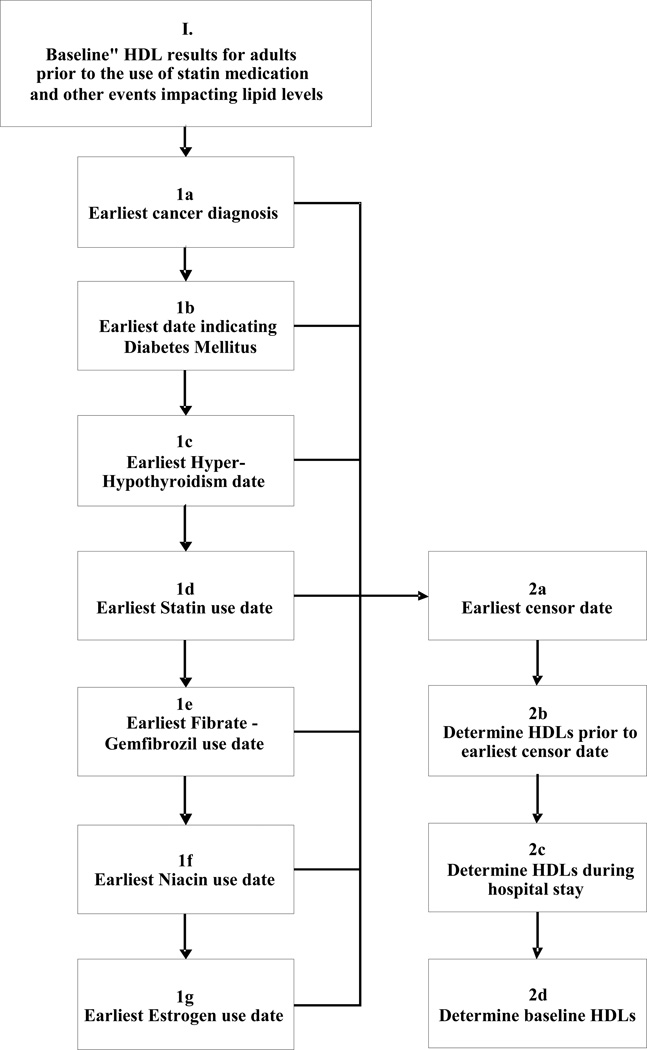
At present, approximately 20,000 Central Wisconsin residents participate in the PMRP. The clinical electronic medical record linked to the PMRP database provides access to over 55 million free-text electronic clinical documents dating back to 1988. As shown in Figure 1, all PMRP subject records were annotated to flag the first date of diagnosis for co-morbidities known to influence circulating lipid levels through alteration of catabolic/anabolic state: 1a (cancer), 1b (diabetes mellitus), and 1c (thyroid disease). These records were also annotated to flag the first date of prescription for medications known to alter circulating lipid levels: 1d (statins), 1e (fibric acid derivatives), 1f (niacin), and 1g (exogenous gonadal steroids, such as estrogen).
Figure 1.
Electronic characterization of baseline HDL. (1) All fasting lipid panels were extracted from the electronic medical record of each PMRP study participant. (1a – 1g) The record for each participant was interrogated identify the first date at which each subjects developed a comorbidity (or medication exposure) that would be expected to alter HDL cholesterol level: (1a) earliest cancer diagnosis in tumor registry; (1b) earliest date for diabetes mellitus based on an algorithm previously published in Wilke et al, 200723; (1c) earliest date of diagnosis for Hyperthyroidism or Hypothyroidism date (diagnostic codes 252.0–252.1, 253.0,253.9, prior to 1969 and 242.00–242.33, 242.90–242.93, 1969 to present) or exposure to levothyroxine, or TSH level outside normal range; (1d) earliest use of a commercially available statin; (1e) earliest use of gemfibrozil or fenofibrate; (1f) earliest use of niacin (restricted to prescription strength doses); (1g) earliest use non-contraceptive estrogen. Right panel: (2a–2b) Each individual’s HDL data string was censored according to diagnostic code and medication. (2c) Any datapoints obtained during hospitalization were filtered. (2d) All remaining data points were then used to model baseline HDL.
Estimation of baseline HDL
We assumed that baseline HDL levels vary widely among individuals, and that HDL levels within any given individual’s medical record would contain outlying values due to acute changes in health status. Each data string was therefore limited to include only those HDL values obtained in the outpatient setting. Estimates were calculated only for individuals having baseline HDL data available for at least two separate time points. An initial estimate was based on the simple baseline median HDL value across time for each individual. The simple within-patient standard deviation (SD) for the baseline HDL results was also calculated for each patient.
Adjustment for population trends
Changes in age and body mass index (BMI) are known to affect an individual's baseline HDL level. In order to control for differences in age and BMI among subjects, we used the trends in age and BMI observed in our population to adjust individual HDL estimates. To electronically screen gross errors in height and weight, the measures were normalized to data from the National Health and Nutrition Examination Survey[14], providing age and gender specific z-scores. Prior to normalization, the tabled U.S. percentiles were smoothed using the LMS method.[15] Heights and weights were also screened using an algorithm which evaluates previous and/or subsequent values and excludes values which result in sharp changes (e.g. a weight which exceeds both the previous and subsequent measures, and reflects a change exceeding 10 pounds per day). The screening parameters in these algorithms were subjectively tuned by reviewing scatter plots of serial height and weight in random samples from the cohort.
Data sharing
A general summary of our electronic algorithms may be viewed online (www.gwas.net). These algorithms are conservative, removing 65% of all raw HDL data points, and 22% of all subjects in the database. The size of our database preserves power despite this conservative approach.
Results
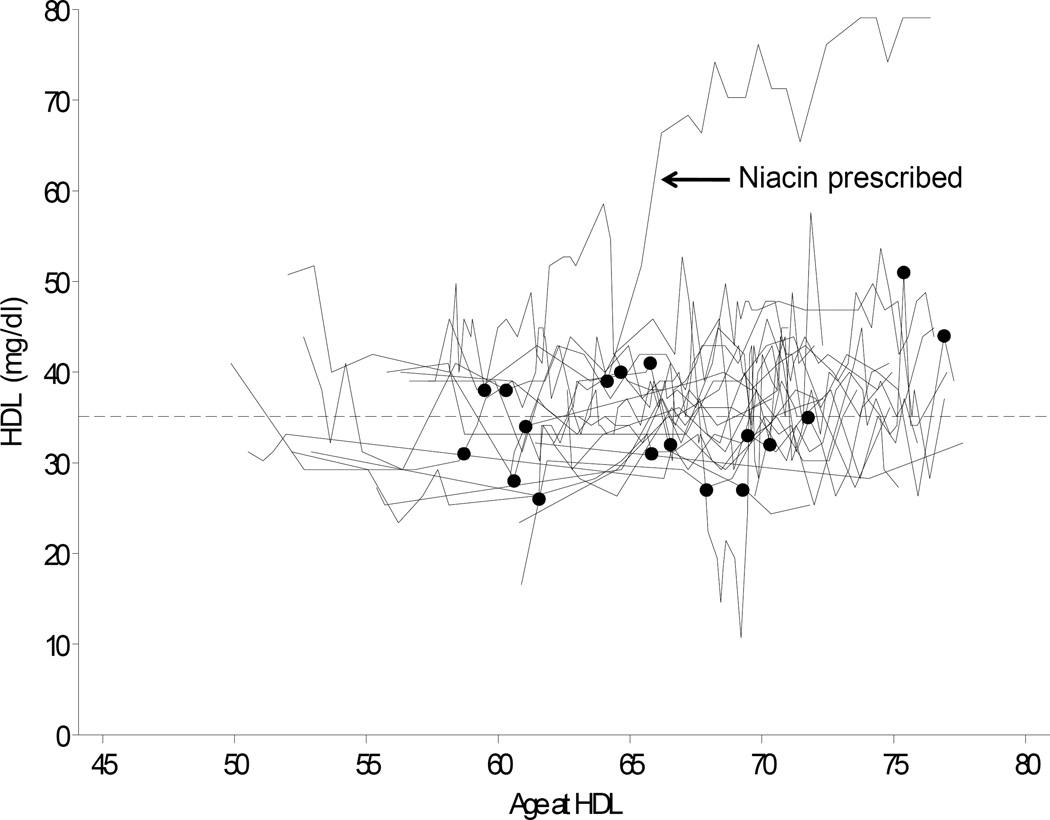
The dynamic PMRP biobank currently contains data from approximately 20,000 participants. Participants are ≥18 years of age at enrollment (range: 18 to 98 yrs, median 46 yrs). Nearly 17,000 of these subjects have clinical lipid data available in the database. All HDL levels were extracted for these individuals. As illustrated for a representative sample of 20 male PMRP participants in Figure 2, each data string was annotated at the first date of diagnosis for a relevant co-morbidity, or at first exposure to a lipid-altering medication (e.g., the arrow in Figure 2 indicates a subject exposed to niacin at age 64 years).
Figure 2.
Raw data for 20 representative male PMRP participants. HDL cholesterol levels are shown versus time, with filled circles representing initial comorbidity or initial exposure to a medication capable of modifying lipid levels. To illustrate the potential advantage of this approach, data are highlighted for an individual that received niacin as a therapeutic intervention (censored data indicated by arrow).
Determination of baseline HDL
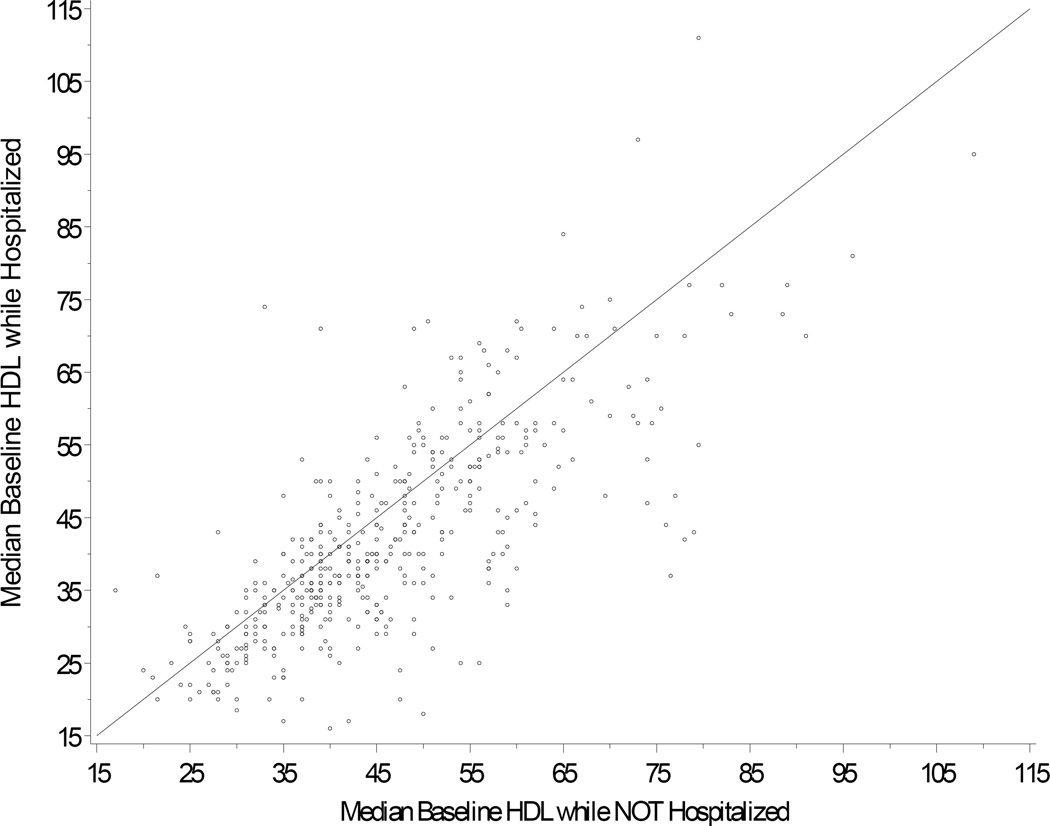
Each individual’s HDL data string was censored by co-morbidity and medication, and the resulting lipid values were used to derive an estimate of baseline HDL cholesterol level. Because acute illness can lower HDL cholesterol (personal communication, Dr Iftikhar Kullo), we removed all data obtained during time intervals bounded by hospital admission codes and hospital discharge codes. As shown in Figure 3, hospitalization was associated with lower HDL levels. Only 1.4% of the total HDL data were obtained during hospitalization. Excluding these levels removed only 109 study subjects.
Figure 3.
Inpatient HDL levels plotted against outpatient levels for each individual. The plot shows median HDL inpatient versus median HDL outpatient for subjects with both types of result. For the large majority of subjects (72% of subjects), HDL level was lower while hospitalized (i.e., 3.4 mg/dL lower in women, and 4.3 mg/dL lower in men).
Adjustment for age, gender and BMI
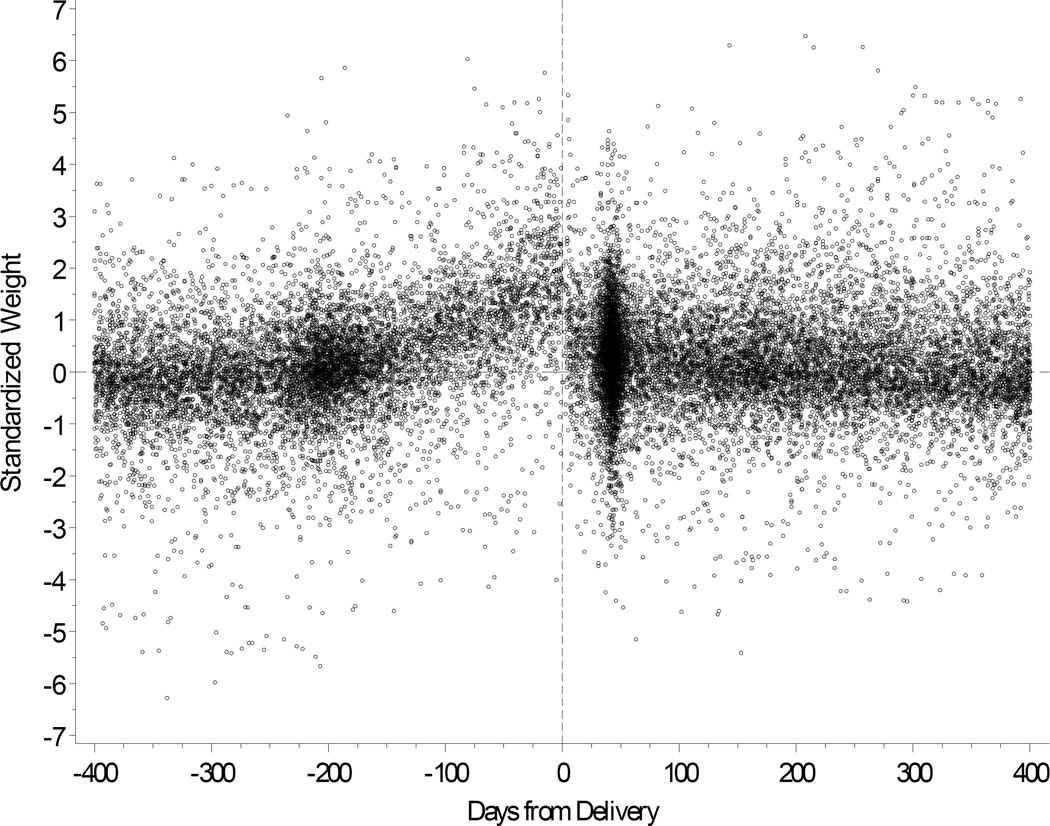
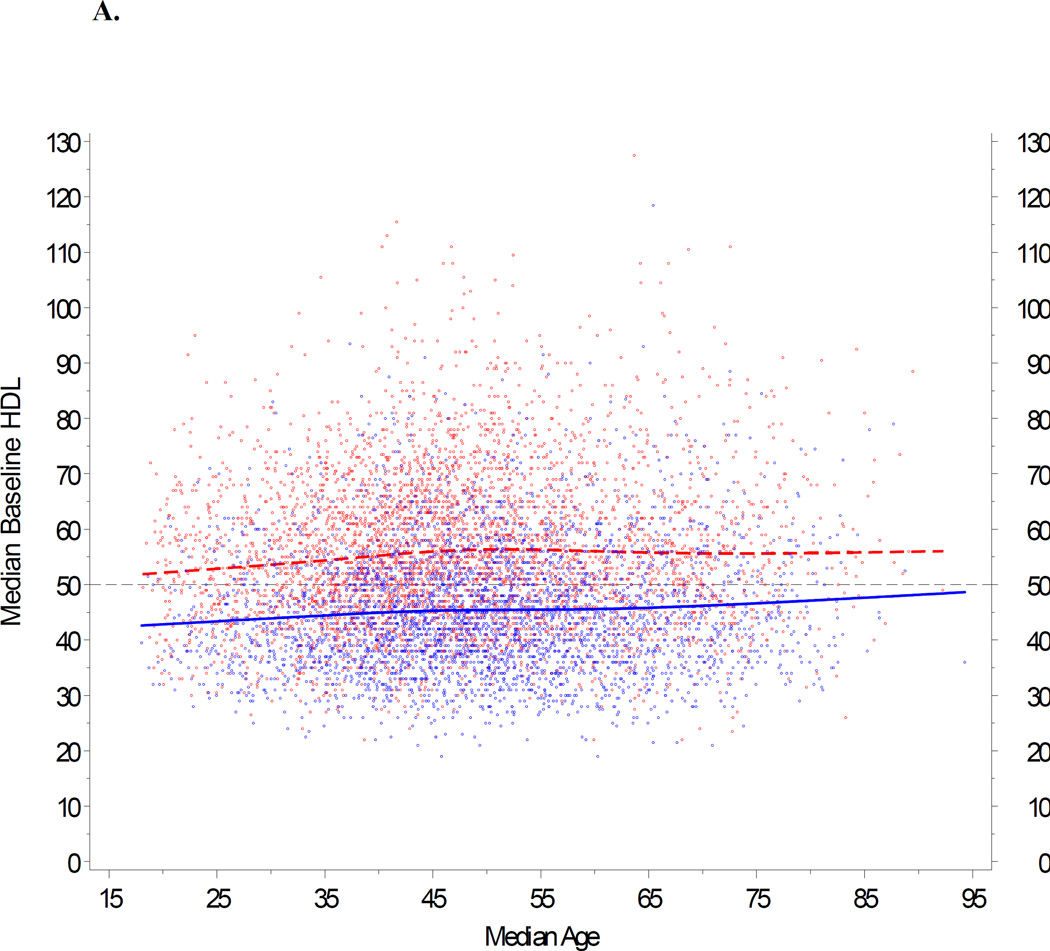
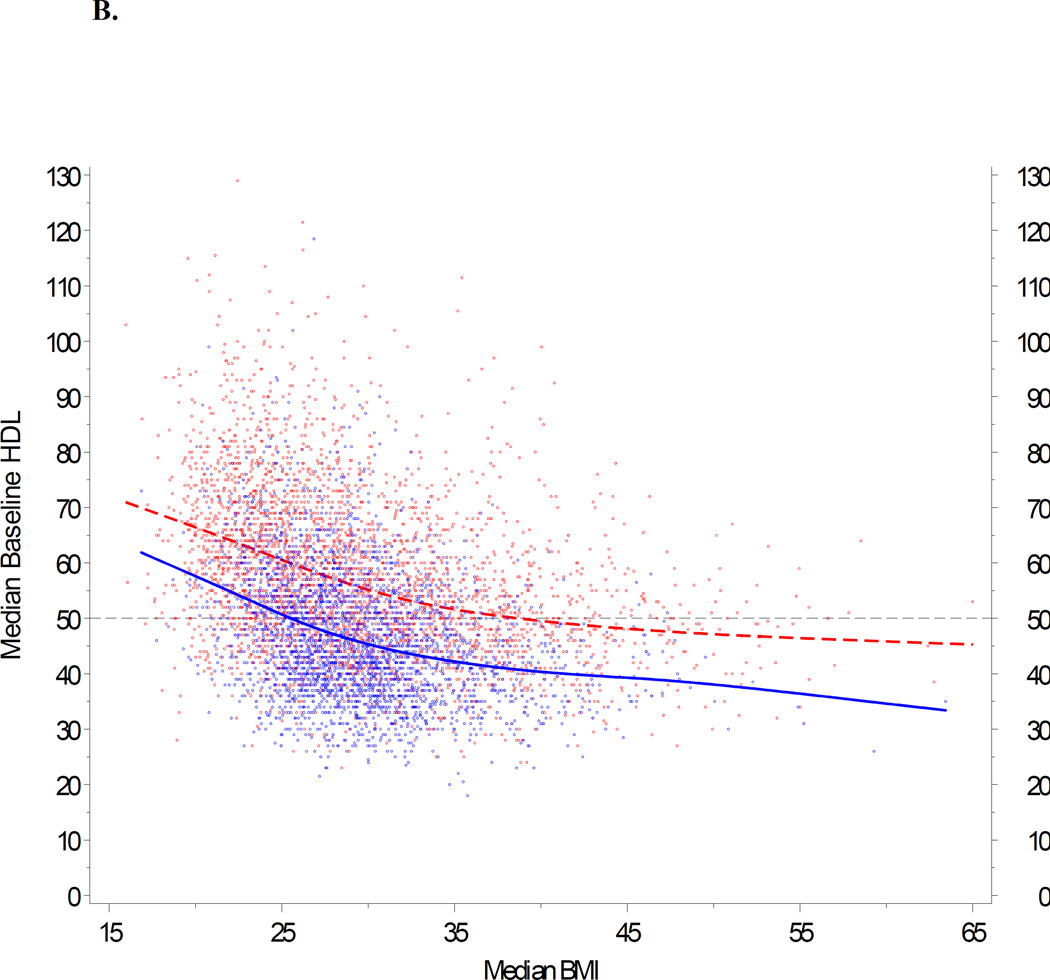
We next modeled age, gender and body mass index in our cohort. Based upon data shown in Figure 4, we first removed weights obtained from pregnant females during a period between 210 days before delivery and 30 days after delivery. For the remainder of the cohort, we utilized population trends to adjust age and BMI according to individual differences in the availability of HDL data over time. A repeated measures model was fit separately for males and females. Figures 5A and 5B show the observed trends. Our goal was to generate a comparable baseline HDL value for each individual. These modeled values are summarized for the entire study cohort in Table 1. Median HDL ranged from 41 mg/dl (age < 30 yrs) to 47 mg/dl (>70 yrs) in men, and 51 mg/dl (30 to 39 yrs) to 54 mg/dl (>70 yrs) in women.
Figure 4.
Body weight shown for pregnant females with reference to delivery date.
Figure 5.
Impact of age and BMI on baseline HDL. A repeated measures model was fit separately for males and females, with baseline HDL as the response, and age and BMI as predictors. The trends for age and BMI were modeled with restricted cubic splines (Stone CJ, Koo CY 1985). This approach provides a very flexible method for fitting trends without relying on any specific model formulation, with three knots located at approximately the 5th, 50th, and 95th percentiles (Durrleman 1989). 5A: HDL is plotted against age, stratified by gender, and adjusted for BMI 25 kg/m2. (BMI 25 represents the clinical threshold between normal weight and overweight.) 5B: HDL is plotted against BMI, stratified by gender, and adjusted for age 46. (Age 46 represents the median age in the PMRP population.) If BMI was not available on the exact date of a given HDL data point, an estimate was imputed from BMI measures calculated before and/or after the HDL value, or based upon gender when no valid BMIs were available for an individual study subject. In both panels (5A and 5B), female subjects are represented by red dots; male subjects by blue dots.
Table 1.
Baseline HDL Percentiles in PMRP Grouped According to Gender and Age
| Males | ||||||||
| Age Group | Baseline HDL (mg/dL) | |||||||
| # Results | 5% | 10% | 25% | 50% | 75% | 90% | 95% | |
| < 30 | 915 | 28 | 31 | 35 | 41 | 50 | 58 | 62 |
| 30–39 | 2579 | 28 | 31 | 35 | 41 | 49 | 58 | 64 |
| 40–49 | 5269 | 28 | 30 | 36 | 43 | 51 | 60 | 66 |
| 50–59 | 5074 | 28 | 31 | 36 | 44 | 52 | 62 | 68 |
| 60–69 | 3182 | 28 | 31 | 36 | 44 | 53 | 62 | 69 |
| 70+ | 1735 | 31 | 33 | 38 | 45 | 54 | 64 | 71 |
| Combined | 18754 | 28 | 31 | 36 | 43 | 52 | 61 | 67 |
| Females | ||||||||
| Age Group | Baseline HDL (mg/dL) | |||||||
| # Results | 5% | 10% | 25% | 50% | 75% | 90% | 95% | |
| < 30 | 1642 | 34 | 37 | 43 | 52 | 61 | 69 | 76 |
| 30–39 | 3930 | 33 | 36 | 43 | 51 | 61 | 70 | 76 |
| 40–49 | 6263 | 35 | 39 | 45 | 54 | 65 | 75 | 82 |
| 50–59 | 4936 | 36 | 39 | 46 | 54 | 65 | 77 | 85 |
| 60–69 | 3135 | 35 | 38 | 44 | 53 | 64 | 78 | 86 |
| 70+ | 1823 | 35 | 39 | 45 | 54 | 66 | 79 | 88 |
| Combined | 21729 | 35 | 38 | 45 | 53 | 64 | 75 | 83 |
Additional gender-specific modifications
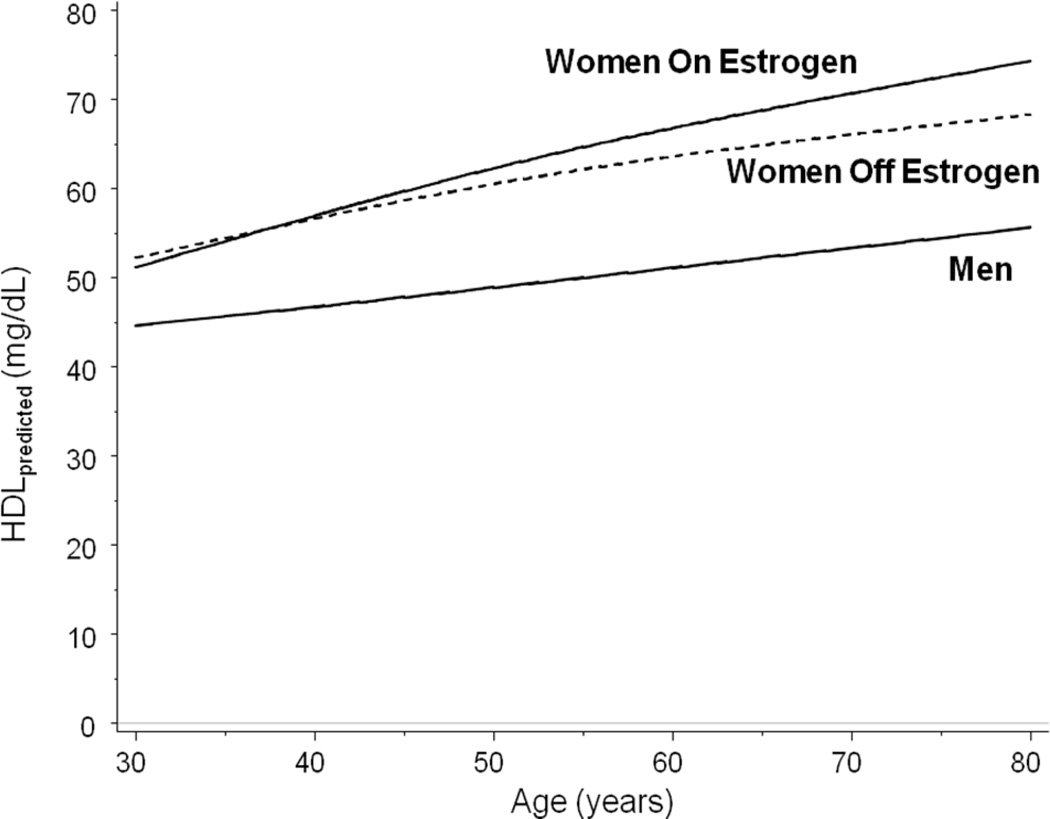
Gender differences in HDL cholesterol emerge at puberty, and women maintain approximately 10-mg/dl higher HDL levels than men throughout their lifetime.[16] Although the effect of contraceptive medications on HDL is relatively small, postmenopausal estrogen replacement may increase HDL level substantially.[17] We therefore adjusted the final baseline HDL level for women, by exposure to postmenopausal estrogen. Based upon an observed bimodal age distribution for estrogen exposure in our cohort, any participant with first estrogen exposure prior to 35.2 years was considered to be using estrogen for contraception. Individual HDL measures within 14 days of an estrogen event were excluded for those women, as well as for a small number of men (n = 38) with estrogen use (e.g. for prostate cancer).
Figure 6 illustrates the final modeled baseline HDL levels for the entire study population.
Figure 6.
Impact of HRT on HDL, shown as a function of age. Median HDL level is shown for women both off (dashed line) and on (solid line) estrogen. Median HDL level is also shown for men. Data are adjusted for BMI = 25 (the threshold between normal weight and overweight) using a mixed effects model with random intercepts.
Discussion
Large healthcare databases are increasingly being used for genetic epidemiology. With nearly 20,000 participants, the PMRP represents one of the largest population-based DNA biobanks in the world.[10–12] In the current study, we used a stepped approach to estimate baseline HDL for the large majority of PMRP participants. All available clinical lipid data were extracted electronically then censored according to medication history and relevant clinical co-morbidities. The resulting HDL levels demonstrated an age-dependent increase, consistent with prior studies in families[18] and within populations.[19] We also observed an inverse correlation between HDL and BMI, consistent with prior studies.[6, 9, 19] Collectively, these findings indicate that future epidemiologic studies need to consider factors that affect baseline HDL values when setting a reference category, to minimize the chance for spurious genotype-phenotype association results.
There are three distinct advantages to the characterization of HDL within the community. First, because our cohort is population-based, future genetic association studies conducted in this specific cohort will allow investigators to assess the relative impact of genetic risk determinants within the context of important clinical covariates. Second, our approach is portable, and should position other large academic centers to conduct similar work, as biobanks are constructed in parallel with existing electronic medical records around the world. We are engaged in efforts to standardize these algorithms, through a multi-institutional initiative called eMERGE (electronic medical records and genomics). Phenotyping strategies developed through this cross-institutional network are summarized at www.gwas.net. Third, while prior genome-wide studies have identified predictors of HDL level, these studies have not been conducted in individuals that were dyslipidemic.[20] Loci contributing to the more clinically relevant manifestations of this trait (i.e., low HDL dyslipidemia) therefore may have been missed.[21] The size of our database would facilitate such studies without compromising statistical power. Because clinicians often make treatment decisions using HDL level as a gender-stratified categorical trait,[16] this capability is important to the translation of genetic information into clinical practice.
Lastly, while therapeutic agents are capable of increasing HDL level, the effect of many such agents appears to be modest. Considerable resources have therefore been directed toward the development of drugs that increase HDL cholesterol through novel mechanisms.[22],[9] The future application of high-throughput genome scanning to cohorts such as ours will likely identify additional novel targets. The practice-based nature of our resource will allow us to focus on targets with the highest residual effect size, after adjustment for known clinical factors contributing to the overall variance in HDL within the community.
Acknowledgments
The authors wish to thank Dr Iftikhar Kullo, for helpful comments during the preparation of this manuscript. This work was funded through U01HG004608.
REFERENCES
- 1.Wilson PW, et al. Prevalence of coronary heart disease in the Framingham Offspring Study: role of lipoprotein cholesterols. Am J Cardiol. 1980;46(4):649–654. doi: 10.1016/0002-9149(80)90516-0. [DOI] [PubMed] [Google Scholar]
- 2.Wilke RA, Carrillo MW, Ritchie MD. Pacific Symposium on Biocomputing--computational approaches for pharmacogenomics. Pharmacogenomics. 2005;6(2):111–113. doi: 10.1517/14622416.6.2.111. [DOI] [PubMed] [Google Scholar]
- 3.Wilke RA, et al. Identifying genetic risk factors for serious adverse drug reactions: current progress and challenges. Nat Rev Drug Discov. 2007;6(11):904–916. doi: 10.1038/nrd2423. [DOI] [PMC free article] [PubMed] [Google Scholar]
- 4.Wilke RA, Mareedu RK, Moore JH. The pathway less traveled-moving from candidate genes to candidate pathways in the analysis of genome-wide data from large scale pharmacogenetic association studies. Current Pharmacogenomics and Personalized Medicine. 2008;6:150–159. doi: 10.2174/1875692110806030150. [DOI] [PMC free article] [PubMed] [Google Scholar]
- 5.Kathiresan S, et al. Six new loci associated with blood low-density lipoprotein cholesterol, high-density lipoprotein cholesterol or triglycerides in humans. Nat Genet. 2008;40(2):189–197. doi: 10.1038/ng.75. [DOI] [PMC free article] [PubMed] [Google Scholar]
- 6.Kissebah AH, et al. Quantitative trait loci on chromosomes 3 and 17 influence phenotypes of the metabolic syndrome. Proc Natl Acad Sci U S A. 2000;97(26):14478–14483. doi: 10.1073/pnas.97.26.14478. [DOI] [PMC free article] [PubMed] [Google Scholar]
- 7.Sonnenberg GE, et al. Genetic determinants of obesity-related lipid traits. J Lipid Res. 2004;45(4):610–615. doi: 10.1194/jlr.M300474-JLR200. [DOI] [PMC free article] [PubMed] [Google Scholar]
- 8.Smith EM, et al. Comparison of linkage disequilibrium patterns between the HapMap CEPH samples and a family-based cohort of Northern European descent. Genomics. 2006;88(4):407–414. doi: 10.1016/j.ygeno.2006.04.004. [DOI] [PMC free article] [PubMed] [Google Scholar]
- 9.Baye TM, et al. Genetic variation in cannabinoid receptor 1 (CNR1) is associated with derangements in lipid homeostasis, independent of body mass index. Pharmacogenomics. 2008;9(11):1647–1656. doi: 10.2217/14622416.9.11.1647. [DOI] [PMC free article] [PubMed] [Google Scholar]
- 10.McCarty CA, et al. Marshfield Clinic Personalized Medicine Research Project PMRP: Design, Methods and Recruitment for a large population-based biobank. Personalized Med. 2005;2:49–79. doi: 10.1517/17410541.2.1.49. [DOI] [PubMed] [Google Scholar]
- 11.Kaiser J. Biobanks. Population databases boom, from Iceland to the U.S. Science. 2002;298:1158–1161. doi: 10.1126/science.298.5596.1158. [DOI] [PubMed] [Google Scholar]
- 12.McCarty CA, Peissig P, Wilke RA. The Marshfield Clinic Personalized Medicine Research Project (PMRP) 2008 - scientific update and lessons learned in the first six years. Personalized Med. 2008;5:1–13. doi: 10.2217/17410541.5.5.529. [DOI] [PubMed] [Google Scholar]
- 13.McCarty CA, et al. The Marshfield Clinic Personalized Medicine Research Project (PMRP) - design, methods and initial recruitment results for a population-based DNA Biobank. Personalized Medicine. 2005;2 doi: 10.1517/17410541.2.1.49. [DOI] [PubMed] [Google Scholar]
- 14.McDowell MA, et al. Anthropometric Reference Data for Children and Adults: U.S. Population. :199–2202. [Google Scholar]
- 15.Cole TJ, Green PJ. Smoothing reference centile curves: the LMS method and penalized likelihood. Stat Med. 1992;11(10):1305–1319. doi: 10.1002/sim.4780111005. [DOI] [PubMed] [Google Scholar]
- 16.Expert Panel on Detection, Evaluation, and Treatment of High Blood Cholesterol in Adults Executive Summary of The Third Report of The National cholesterol Education Program (NCEP: Adult Treatment Panel III) JAMA. 2001;285:2486–2497. doi: 10.1001/jama.285.19.2486. [DOI] [PubMed] [Google Scholar]
- 17.Bittner V. Perspectives on dyslipidemia and coronary heart disease in women. J Am Coll Cardiol. 2005;46(9):1628–1635. doi: 10.1016/j.jacc.2005.05.089. [DOI] [PubMed] [Google Scholar]
- 18.Newman DL, et al. Major loci influencing serum triglyceride levels on 2q14 and 9p21 localized by homozygosity-by-descent mapping in a large Hutterite pedigree. Hum Mol Genet. 2003;12(2):137–144. doi: 10.1093/hmg/ddg012. [DOI] [PubMed] [Google Scholar]
- 19.Wilson PW, et al. Determinants of change in total cholesterol and HDL-C with age: the Framingham Study. J Gerontol. 1994;49(6):M252–M257. doi: 10.1093/geronj/49.6.m252. [DOI] [PubMed] [Google Scholar]
- 20.Hegele RA. Plasma lipoproteins: genetic influences and clinical implications. Nat Rev Genet. 2009;10(2):109–121. doi: 10.1038/nrg2481. [DOI] [PubMed] [Google Scholar]
- 21.Hegele RA, Pollex RL. Hypertriglyceridemia: phenomics and genomics. Mol Cell Biochem. 2009 doi: 10.1007/s11010-008-0005-1. [DOI] [PubMed] [Google Scholar]
- 22.Nissen SE, et al. Effect of torcetrapib on the progression of coronary atherosclerosis. N Engl J Med. 2007;356(13):1304–1316. doi: 10.1056/NEJMoa070635. [DOI] [PubMed] [Google Scholar]
- 23.Wilke RA, et al. Use of an electronic medical record for the identification of research subjects with diabetes mellitus. Clin Med Res. 2007;5(1):1–7. doi: 10.3121/cmr.2007.726. [DOI] [PMC free article] [PubMed] [Google Scholar]


