Abstract
Monte Carlo (MC)-based spot dose calculation is highly desired for inverse treatment planning in proton therapy because of its accuracy. Recent studies on biological optimization have also indicated the use of MC methods to compute relevant quantities of interest, e.g. linear energy transfer. Although GPU-based MC engines have been developed to address inverse optimization problems, their efficiency still needs to be improved. Also, the use of a large number of GPUs in MC calculation is not favorable for clinical applications. The previously proposed adaptive particle sampling (APS) method can improve the efficiency of MC-based inverse optimization by using the computationally expensive MC simulation more effectively. This method is more efficient than the conventional approach that performs spot dose calculation and optimization in two sequential steps. In this paper, we propose a computational library to perform MC-based spot dose calculation on GPU with the APS scheme. The implemented APS method performs a non-uniform sampling of the particles from pencil beam spots during the optimization process, favoring those from the high intensity spots. The library also conducts two computationally intensive matrix-vector operations frequently used when solving an optimization problem. This library design allows a streamlined integration of the MC-based spot dose calculation into an existing proton therapy inverse planning process. We tested the developed library in a typical inverse optimization system with four patient cases. The library achieved the targeted functions by supporting inverse planning in various proton therapy schemes, e.g. single field uniform dose, 3D intensity modulated proton therapy, and distal edge tracking. The efficiency was 41.6±15.3% higher than the use of a GPU-based MC package in a conventional calculation scheme. The total computation time ranged between 2 and 50 min on a single GPU card depending on the problem size.
1. Introduction
Pencil beam scanning has become increasingly common in proton therapy treatments. The adjusting intensity of each beam spot can achieve increased target coverage and critical organ sparing as compared to conventional passive scattering methods. Different treatment schemes can be used including single field uniform dose (SFUD), 3D intensity modulate proton therapy (IMPT), and distal edge tracking (DET) (Lomax, 1999). In these techniques, inverse treatment planning is based on adjusting the weights from individual spots to yield a satisfactory dose distribution during the optimization process.
The pencil-beam (PB) algorithm is typically used for spot dose calculations primarily because of its high computational speed and acceptable accuracy in most cases. However, in cases where the algorithm accuracy is degraded, the inaccurately calculated spot dose misleads the optimization process, compromising the resulting quality of the plan. The ultimate solution to this problem is to incorporate an accurate dose engine such as Monte Carlo (MC) for spot dose calculations (Tourovsky et al., 2005; Paganetti et al., 2008; Paganetti, 2012; Mairani et al., 2013). MC-based inverse planning is also important for biological optimization. To quantitatively assess the biological effect, the concept of relative biological effectiveness (RBE) is commonly used. It is defined as the ratio of the absorbed dose under the reference radiation, such as Co-60 gamma rays, and the dose under the specific radiation type that produces the same biological effect. Current treatment planning for standard proton therapy typically uses a constant value of 1.1 for the RBE. However, it has been observed that the RBE of a proton beam varies along its path and hence biological treatment plan optimization is needed (Wilkens and Oelfke, 2005; Frese et al., 2011; Grassberger et al., 2011; Wedenberg et al., 2013). It has also been proposed to consider physics quantities closely related to RBE in optimization, such as linear energy transfer (LET) (Romano et al., 2014; Giantsoudi et al., 2013). Yet, it is difficult for the conventional PB algorithms to accurately measure these quantities of interest in these scenarios. In contrast, MC simulation may be the ideal selection because of faithful simulation of the particle transport process via physics principles.
Despite its promise, MC-based inverse planning exhibits low computational efficiency. The total dose computation time for a typical IMPT case with ten thousand spots is too long for clinical use under the current MC packages, e.g. TOPAS/Geant4 (Perl et al., 2012). GPU-based proton MC packages have recently been developed (Jia et al., 2012; Wan Chan Tseung et al., 2015; Renaud et al., 2015; Yepes et al., 2009). The computation time was substantially reduced via both hardware accelerations and the use of simplified physics models, showing great promise for fast and accurate MC-based inverse plan optimization. For instance, a novel MC-based IMPT optimization system has been recently developed. With 24 GPUs, the computation time for a head and neck IMPT plan was ~ 20 min (Ma et al., 2014). This is a substantial improvement over the conventional CPU-based approach. Yet the system is still not ideal for clinical use. Although the cost for such a system is not a concern because of low GPU price nowadays, managing such a big platform may be a burden for clinical use. Meanwhile, in some complicated problems (e.g. robust optimization or biological optimization) or time-critical applications (e.g. online adaptive therapy), it is still desired to seek a more effective use of the computationally expensive MC simulation to further improve computational efficiency.
Existing MC-based inverse planning systems used the MC method to pre-compute spot dose distributions needed by the optimization algorithm before launching the optimization process. However, performing the dose calculation during optimization may be a better choice. This allows the use of spot intensity information obtained during the optimization process to guide MC sampling. The net effect is that the amount of MC simulation is reduced on the less important spots, i.e. those with small intensities after inverse optimization. This method, known as adaptive particles sampling (APS), has been successfully used in photon intensity modulated radiation therapy (IMRT) where an acceleration factor of ~5 was achieved, when compared with the conventional use of MC that pre-computes beamlet dose distributions (Li et al., 2015).
It is the objective of this paper to propose a new software framework to allow the streamlined integration of the MC-based spot dose calculation under the APS scheme into a proton therapy inverse planning system. A number of proton therapy inverse optimization systems have been developed over the years. When incorporating the MC-based spot dose calculation into these systems, a design that is maximally compatible with existing systems is needed to ensure practical applications of the developments. For instance, a library that can be readily plugged into an existing system without major modification on the system is preferred. If MC spot dose calculations were performed before plan optimization, the integration would be straightforward. The dose engine could be replaced at the spot dose calculation stage, and the optimization part would be left unchanged. However, if we would like to employ the aforementioned APS scheme, the integration requires a carefully designed interface between the MC component and the optimization system. In this paper, we will develop a library under a particularly designed framework to offer an existing inverse planning system the capability of GPU-enabled MC-based spot dose calculations. We will also extend the APS scheme previously developed in the photon therapy context to the proton therapy inverse planning regime.
2. Methods and Materials
2.1 Overall system structure
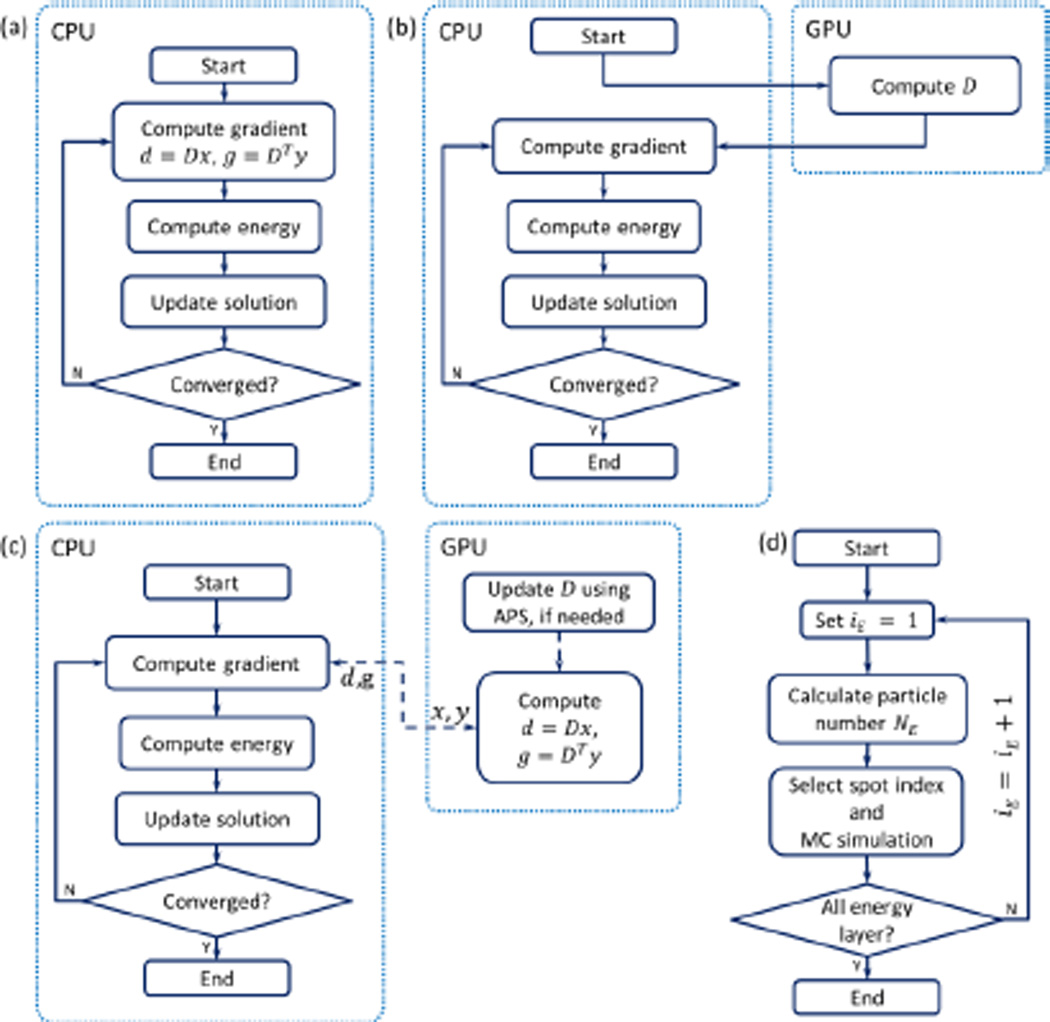
The general structure of an inverse optimization workflow employing a gradient-based algorithm is illustrated in Fig. 1(a). The algorithm iteratively performs several steps as follows: 1) computing gradients based on the current solution, 2) computing an objective function, and 3) updating the solution. The first step typically involves two matrix-vector operations, namely computing the dose distribution d = Dx and its adjoint operation g = DTy. Here, x or d and y or g are the vectors residing in the domain of the dose distribution and spot intensity, respectively. Specifically, x is the spot intensity, d is the dose distribution. Computing the gradient g typically involves multiplication with DT. The exact form of this computation depends on the specific objective function of interest. D is the dose deposition matrix (DDC) with its entry Dij as the dose deposit to a voxel i from a spot j at its unit intensity.
Figure 1.
(a) Typical CPU-based IMPT optimization workflow. (b) Structure to integrate MC simulation in to the optimization in the conventional approach. (c) Proposed structure with the development in the dot box on the right side. The dashed lines indicate data transfer. (d) Workflow for of updating D step using APS.
The role of the MC dose calculation in the optimization problem is reflected as the DDC matrix computation. In the conventional approach, this matrix is pre-calculated using the MC method, before the optimization starts, as illustrated in Fig. 1b). In contrast, we propose a GPU library that supports the optimization problem as a plug-in to the gradient computation step and that is responsible for the two matrix-vector operations d = Dx and g = DTy, as illustrated in Fig. 1c). The reason for this selection is to achieve a more effective use of MC than the conventional approach and to use the GPU processing power for matrix-vector operations that are known to be well suited for GPU-based parallel computation (Bell and Garland, 2008).
2.2 GPU modules supporting inverse optimization
The first time we launched our GPU library, an initialization function was called. The function initialized a GPU computational environment, patient data, physics data, and plan geometry. The GPU module mainly included two components: 1) updating the DDC matrix with APS and 2) forward and backward dose calculations.
2.2.1 Updating the DDC matrix with APS
Because we want to develop a library that supports an existing inverse optimization system, the iterative plan optimization process in the system should not be changed. Let us use k to index the iteration number of the inverse optimization process in the existing system. An input parameter NUpdate was set, such that the DDC matrix was updated every NUpdate iteration steps. In the steps when the DDC matrix was not updated, the matrix was directly used in the matrix-vector operations for optimization. When it came to the step of updating the DDC matrix, the matrix was first updated using the APS method. After that, it was used for optimization.
When the DDC matrix was updated, a user first specified a total number of source protons for MC simulation NMC. The APS method sampled particles from spot j, so that was approximately proportional to the currently optimized spot intensity . As an initial condition for the first iteration, we used equal spot intensities to guide the particle sampling, because the spot intensity was not yet available. This idea was first proposed in a previously published IMRT regime (Li et al., 2015). To adapt the APS method to the IMPT problem, we made the following modifications from the previous work.
Computing the DDC matrix is essentially the problem of calculating dose distribution for each proton spot. With multiple GPU threads, it is possible to simultaneously transport protons from different spots. In our implementation, we sequentially looped over energy layers and simultaneously transporting protons for spots in a layer, as illustrated in Fig. 1(c). Here iE is the index for the energy layer. For each layer, we first computed the total proton number as NE = NMC ∑j∈E(xj + ε) / ∑j(xj + ε), where the summation in the numerator is within the layer iE with respect to the spots, and the summation in the denominator is with respect to all the spots. ε is a parameter with a small value. It was introduced to avoid sampling zero particles from a spot, even when the spot intensity was zero (Li et al., 2015). With NE determined for the layer iE, we sampled the particles among the spots in the layer and simultaneously simulated the particles’ transport in the patient’s body. The reason for this layer-by-layer spot dose calculation was to avoid efficiency loss in parallel processing. In fact, the computation time to transport a proton is approximately proportional to its range, which is a function of particle energy. If protons with drastically different energies were transported simultaneously, those GPU threads transporting low-energy protons would be completed first, and would wait for those with high-energy protons to end, wasting computational resources.
To sample the particles from spots in an energy layer, we employed the Metropolis sampling method (Metropolis et al., 1953). Metropolis method is an iterative approach to draw samples from a given distribution. One sample is generated per iteration step, such that the distribution of all the generated samples approaches the desired one. In our implementation, all GPU threads ran the Metropolis algorithm but were independent of each other. Specifically, each GPU thread kept a variable Iprev to store the spot index from which a particle was sampled at the previous iteration step. In each iteration step, a trial spot index J was uniformly generated among all the candidate spots and accepted with a probability xJ/xIprev. If accepted, a proton was sampled from the spot J, if not, the proton was sampled from Iprev. In addition, if the trial spot index J was accepted, Iprev was set to J. The reason for this strategy was to mitigate the problem of the GPU memory-writing conflict (Jia et al., 2012). When multiple threads were transporting spatially-close protons, there was a high probability to access the same voxel while depositing the dose. Dose depositions among multiple threads have to be serialized, compromising the parallel efficiency of GPU. With the simple Metropolis algorithm, the spatial locations of sampled protons from different GPU threads were uncorrelated, which was expected to reduce the chance of having multiple protons from the same spot. This was an effective way to mitigate the memory conflict problem.
After each thread determined a proton spot index with the Metropolis method, a source proton was sampled in the thread. The GPU then simultaneously transported these protons and scored the dose deposition. In our implementation, we modified gPMC, a fast GPU-based MC package for proton dose calculation previously developed in our group (Jia et al., 2012), to tag each source proton with the spot index it came from. During transport simulations, the index was also passed on to all the secondary particles. Each dose deposition event was directed to the dose counter corresponding to the spot based on the tag value. After completing all the proton transports, the resulting dose distribution for each spot was normalized to yield the dose per source particle using the number of particles sampled from that spot. The dose values were further converted into dose per MU using the gPMC calibration factor.
2.2.2 Forward and backward dose calculation
After being updated, the DDC matrix was ready for the forward dose calculation Dx and its adjoint calculation DTy, where x and y are vectors in the spot weight and dose domains. These are the two most frequently used operations to evaluate the objective function and its gradient when solving an optimization problem. Hence their performances are critical to the overall system efficiency. In our implementation, the library took input of x and y from the optimization part and returned the calculated results. The computations were achieved on GPU via the algorithm previously reported by Bell and Garland (2008).
The matrix D storage needs special attention. This is a sparse matrix, because a spot only deposits the doses to a few voxels close to its central axis. During particle transport simulation, the dose deposition information was recorded in three vectors corresponding to the spot indices, the voxel indices, and the deposited dose value to a voxel from a spot at its unit weight, respectively. This storage method actually corresponds to the coordinate list (COO) format of a sparse matrix. For efficient matrix-vector multiplication Dx on GPU, a compressed sparse row (CSR) format is required (Bell and Garland, 2008; Men et al., 2009). For the efficient operation of DTy, a format compressed sparse column (CSC) format is needed. Hence, the immediate step after the DDC matrix update was to convert the matrix from the COO to the CSR and CSC formats using the cuSparse library provided by NVIDIA (NVIDIA, 2015). After this step, the computation of Dx and DTy was performed.
2.3 Integration of MC library in an optimization problem
In this section, we describe how the developed MC library was integrated into a representative inverse planning problem.
2.3.1 Spot arrangement
For a proton therapy plan optimization problem, the first step is to place the proton pencil beam spots within the target volume. We adopted a typical approach as follows. We first created a scanning target volume (STV) that was expanded from the optimization target volume (OTV) with a margin of 0.5 cm. Here we used the term OTV instead of planning target volume (PTV) to follow the ASTRO model policies for proton beam therapy (Ma et al., 2014; American Society of Radiation Oncology, 2014). We uniformly placed proton spots on a square grid in BEV with a resolution of 0.5 cm. To determine the energy layers for 3D-IMPT, we first calculated the minimum and maximum water equivalent distance from the patient’s body surface to the STV proximal and distal ends. The energy layers were determined by placing the Bragg peaks between the minimum and maximum depths among all the spots with an increment of 0.4 g/cm2. We finally removed all the spots with the Bragg peaks outside the STV and the remaining spots were used for optimization. For DET, we placed one proton spot on the distal edge, one inside the distal edge by one step, and one outside the distal edge by one step for each proton pencil beam (Li et al., 2008; Liu et al., 2012). For SFUD, the spot placement was similar to that of 3D-IMPT but the spots from each beam were positioned separately.
2.3.2 Inverse Optimization
We used a representative optimization model to demonstrate the effectiveness of our proposed GPU library. Of note, the structure of our system is not restricted to this particular optimization model but can be applied to any gradient-based optimization algorithm that attains the general structure shown in Fig. 1a). In this study, we used a popular two-sided quadratic objective function:
| (1) |
where S denotes the structure set including both targets and critical structures, and T is the set of targets. vs represents the set of voxels in a structure s ∈ S. xj is the intensity of spot j. The dose di at voxel i can be calculated as di = ∑j Dij · xj, where Dij is the element at voxel i from spot j in the DDC matrix. and are under-dose and over-dose organ weighting factors. Pi denotes the prescription dose for the target or the threshold dose for critical structures. C is the minimum MU constraint for proton spots.
The number of voxels and spots are large for a typical clinical case, requiring large GPU memory. To perform computations under a relatively small GPU memory, we only used some voxels in the optimization. As such, we first down-sampled the original CT image with a resolution of 512 × 512 voxels on a transverse plane to 256 × 256 voxels. The final image resolution on a transverse plane was ~2 mm × 2 mm. After that we singled out the voxels involved in the optimization. For OTV and organs at risks (OARs) with a relatively small volume (e.g., cord) we kept all the voxels for optimization. For other OARs we kept all the voxels on its surface and for the interior voxels we selected one in every 2 × 2 voxels on each transverse plane. For body structure, we used a more coarse resolution and selected one voxel in every 4 × 4 voxels on each transverse plane.
The Barzilai-Borwein gradient method with projections to the feasible set was used to solve the optimization problem (Barzilai and Borwein, 1988). During the iterations of the Barzilai-Borwein algorithm, forward and backward dose calculations were conducted with our proposed GPU modules. After calculating the dose and gradient vectors and transferring them back to CPU, the following objective function evaluation, step size search with the Barzilai-Borwein algorithm, and spot intensity updates were performed. To deal with the minimum MU constraint in each update stage of the spot intensity, we rounded the spot intensity down to 0 for spots with weights lower than 0.5C or alternatively up to C.
The stopping criterion for the optimization process was based on the relative difference between the dose vectors at two iterations corresponding to the last two DDC updates:
| (2) |
where|․|2 denotes the standard L2 norm of a dose vector. l is the index of the DDC update number, dk is the dose vector at the kth iteration step of the inverse optimization process, and Dp is the prescription dose. The use of the dose difference at two successive steps is a typical stopping criterion. However, since the DDC matrix was updated throughout the optimization process, we actually compared the dose vectors at two steps when two successive DDC updates were performed. This strategy was employed so the iteration would not appear converged, although changing the DDC matrix could further alter the solution. When a criterion of ε < 0.002 was met, we assumed that any further iterations and updates in the DDC matrix would not significantly change the resulting dose distribution. Hence the optimization was terminated. In SFUD, the optimized doses of different beams were added with the beam weighting factors manually adjusted for a good plan quality.
2.3.3 Evaluations
To evaluate our developments, we first tested a 3D-IMPT prostate cancer patient case. With a spot spacing of 0.5 cm and an energy layer spacing of 0.4 g/cm2, we found 4243 spots from two opposite lateral beam angles. The plan was first optimized with the MC-based spot dose calculation performed in a conventional fashion. MC was repeatedly used to perform dose calculations for each spot to generate the DDC matrix. After that, plan optimization was conducted to solve the problem in Eq. (1). The DDC matrix was stored on GPU during optimization. Matrix multiplications were conducted on GPU, because the GPU-based matrix-vector multiplication was faster than CPU. We conducted this conventional MC-based optimization method for several runs, each with a proton number per spot ranging from 103 to 107. The purpose of this step was to determine the minimum number of protons per spot required in the conventional approach to objectively demonstrate the advantages of the APS scheme. We proceeded with the study on the proposed scheme where MC-based spot dose calculations and optimizations were iteratively performed.
In both cases, after a plan was developed, a final forward MC dose calculation was performed using the optimized spot weights and 105 protons per spot. We compared the resulting differences in proton fluence, final dose, and dose volume histograms (DVH) between the conventional and the APS methods. For fair comparisons, identical parameters were used in all cases, including the number of particles used for the final dose calculations, the parameters in the optimization model in Eq. (1), and those in the optimization algorithm.
The efficiency improvement in our proposed GPU module was expected to come from two reasons other than the inherent fast GPU-based MC proton transportation simulation. The first was the APS technique that reduced the total simulated proton number in DDC calculation. The second was the GPU-based matrix-vector operations. To evaluate the efficiency improvements in these two aspects separately, we recorded the computation time for the DDC calculation and the matrix-vector multiplications in four different scenarios. In all the scenarios, GPU-based MC simulation was employed. The first scenario (S1) was the conventional approach to perform the MC-based spot dose calculation and optimization in two sequential steps. The matrix-vector operations were performed on the CPU side. The second scenario (S2) involved the use of the APS scheme to iteratively perform MC spot dose calculations and optimization. The third scenario (S3) was the same as S1 except for the matrix-vector operations being ported to the GPU platform. The last scenario (S4) represented the proposed approach that enabled MC-based dose calculations with the APS scheme. The matrix-vector operations were also performed on the GPU side. The computation time reported was for a single NVIDIA GTX Titan GPU.
We also evaluated the capability and efficiency of the proposed MC-based inverse optimization system in different planning schemes. We optimized the following cancer cases: one prostate, one pancreatic, one lung and one head and neck with SFUD, 3D-IMPT, and DET, respectively. SFUD and 3D-IMPT used three beams for the head and neck case and two beams for the other cases, while DET employed seven equally spaced beams. We did not intend to compare plan quality of these three different treatment techniques. The inclusion of different treatment techniques and clinical cases was to show the validity of our developments.
3. Results
3.1 Conventional optimization method
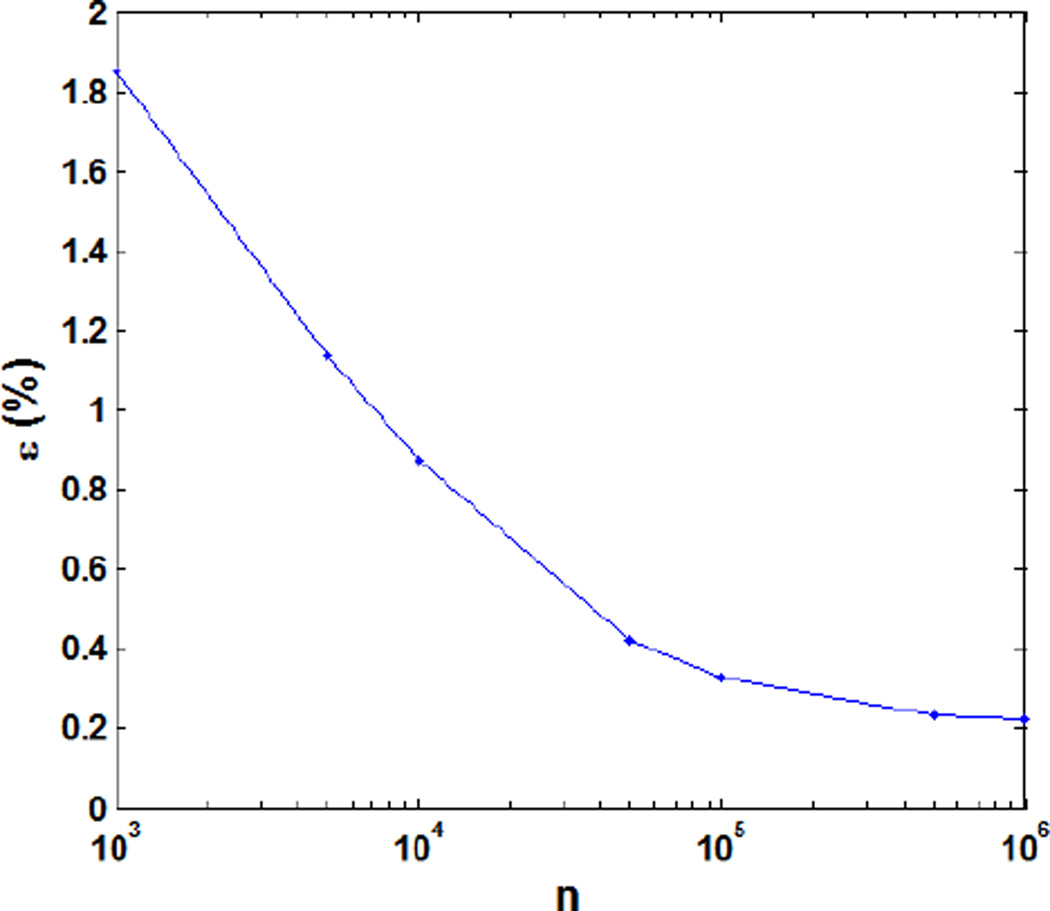
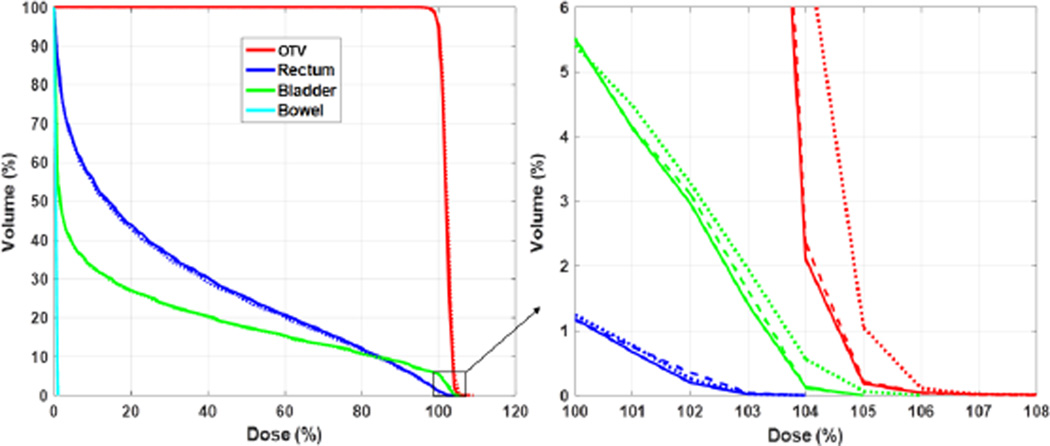
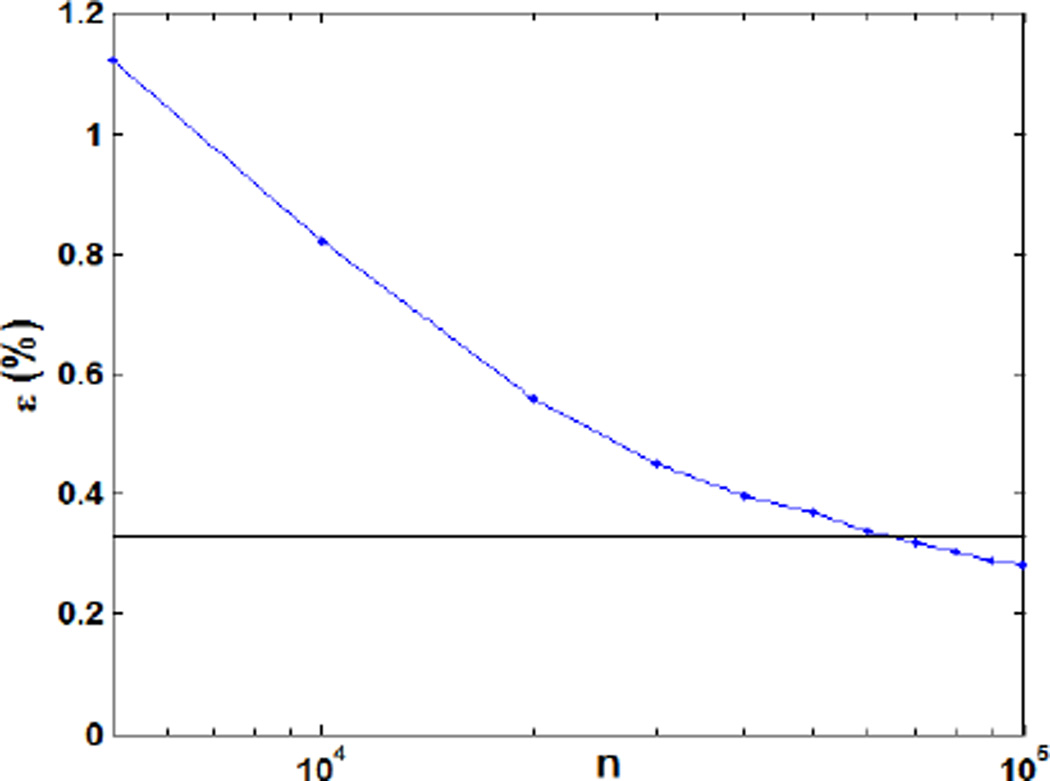
Fig. 2 shows the relative dose error for a prostate cancer 3D-IMPT plan resulting from the conventional use of MC with different number of particles per spot for the DDC matrix calculation. The relative dose error ε was defined as , where d* is the optimized dose distribution with 107 protons per spot. As expected, the relative dose error appeared as a monotonically decreasing function of the number of protons per spot. At 105 protons per spot the resulting error was 0.33%, a clinically acceptable result. Increasing the proton numbers further did not yield a significant error reduction. We also compared the DVHs for the optimized plan under 104~106 protons per spot as shown in Fig. 3. The DVHs for the cases using 106 and 105 protons per spot were very similar to each other. When reducing the particle to 104, clear deviations in DVHs were observed. Based on these results, we concluded that 105 protons per spot were sufficient for the use of MC in inverse optimization under the conventional framework.
Figure 2.
Relative dose error as a function of the particle numbers per spot in the conventional optimization method.
Figure 3.
DVH curves for the prostate 3D-IMPT case with 104 (dotted), 105 (dashed), and 106 (solid) particles per spot with the conventional optimization method.
3.2 Proposed optimization method
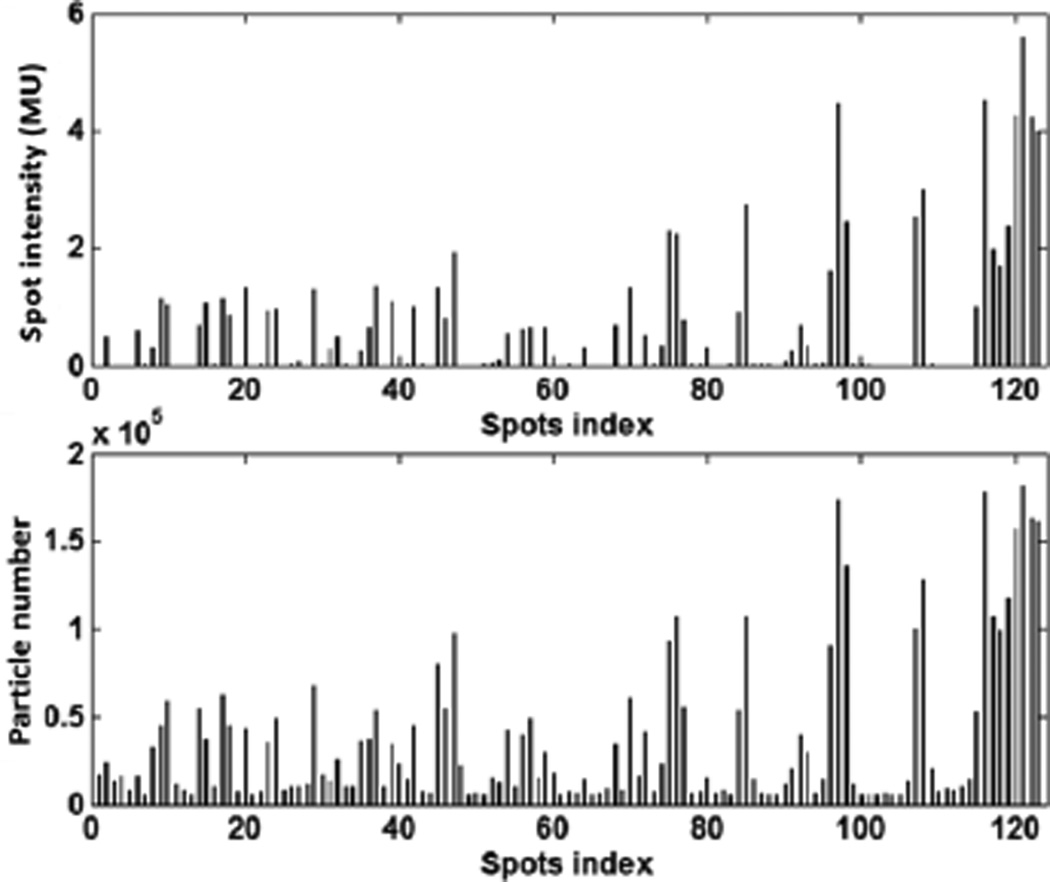
We then sought to study the use of the developed package for MC-based inverse optimization. In the case of prostate cancer 3D-IMPT, the number of protons sampled for each spot was found to be closely related to the resulting optimized spot weights by the Metropolis biased sampling (Fig. 4). The top panel in Fig. 4 depicts optimized intensities at different spots in an energy layer, while the bottom panel shows the sampled particle number from these spots. A clear correlation between the two quantities can be observed.
Figure 4.
Optimized proton spot intensities (top) and total sampled particles number (bottom) for the spots from one energy layer.
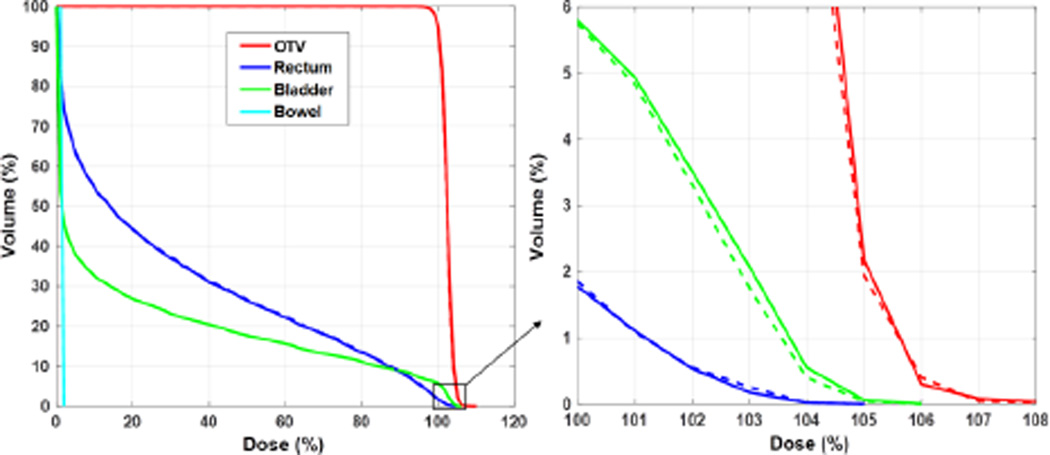
The comparison between the conventional optimization method and the APS method in terms of optimized DVH curves for the same prostate case is reported in Fig. 5. The two results were visually close to each other and the mean difference between the two set of curves was ~0.1%. Because the number of protons per spot varied in the adaptive sampling scheme, we used the average number of protons in MC over the total number of spots to characterize the computational loads. This number is simply expressed as NMCNiter/Ns, where NMC is the user-specified total number of particles each time the APS sampling was used. Ns is the number of spots and Niter is the number of iterations for APS. In this example case, we set NMC = 5000Ns. With the Niter = 12 iterations needed for the optimization to complete, the average number of protons per spot was 6 × 10⁴ with the APS method. In contrast, 105 proton spots were required in the conventional method to yield the same optimization results.
Figure 5.
DVH curves for the prostate 3D-IMPT case with 105 particles per spot in the conventional method (dashed lines) and 5000 particles per spot in each iteration with 12 iterations in our proposed method (solid lines).
Again, we plotted the error of the optimized dose distribution as a function of the average particle per spot (Fig. 6). d*, the optimized dose distribution with 107 protons per spot in the conventional approach, was regarded as the ground truth. We observed that at ~6 × 10⁴ protons per spot, the relative dose error reached 0.33%, the same level achieved by the conventional method with 105 protons per spot. This reduction in required number of particles directly led to an improvement in computational efficiency, which will be quantified later.
Figure 6.
Relative dose error as a function of the particle numbers averaged per spot for our proposed optimization method. The horizontal lines correspond to the results for the conventional method with 105 protons per spot.
3.3 Different proton therapy planning techniques
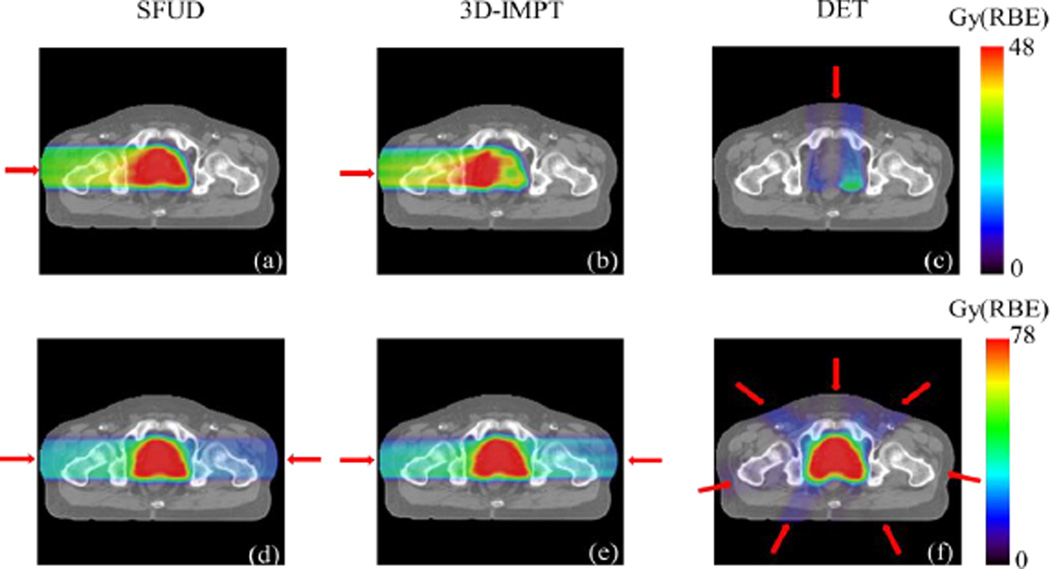
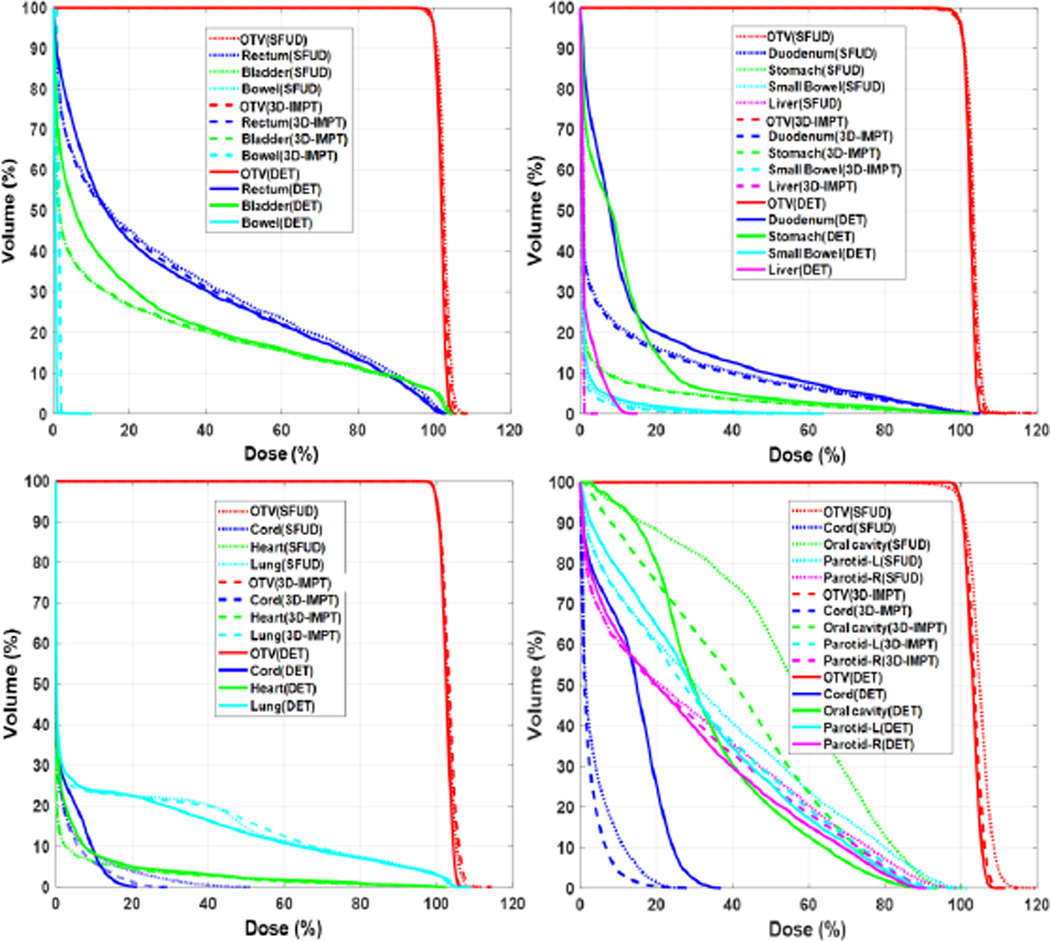
The optimized dose distribution for a representative prostate cancer case with three different treatment techniques is illustrated in Fig. 7. The top row displays the dose distribution from one of the beams. Subfigures in the bottom row illustrate the final dose distributions from all the beams in the three approaches. The target was well covered in all cases (V100%~95%). Optimized DVHs for prostate, lung, pancreatic, and head-and-neck cancer cases under the three different techniques are displayed in Fig. 8. These studies demonstrated the functionality of our proposed MC-based inverse optimization in different setups.
Figure 7.
Dose distribution for three different IMPT techniques from one beam (top row) and all beams (bottom row). Beam directions are indicated by the red arrows.
Figure 8.
DVH curves for prostate (top-left), pancreas (top-right), lung (bottom-left) and head-and-neck (bottom-right) cancer cases with three different planning techniques, SFUD (dotted lines), 3D-IMPT (dashed lines), and DET (solid lines).
3.4 Efficiency evaluation
The computation time for the prostate cancer 3D-IMPT case with four different scenarios is presented in table 1. The total time was slightly higher than the sum of the MC simulation time and the vector multiplications time due to an additional cost in other steps, e.g. the computation of step length in the Barzilai-Borwein algorithm and data communication between CPU and GPU.
Table 1.
Calculation time (in seconds) for each component and total computation time for the prostate 3D-IMPT case. MVO stands for matrix-vector operations.
| S1. Conventional use of MC with CPU-MVO |
S2. APS with CPU-MVO |
S3. Conventional use of MC with GPU-MVO |
S4. APS with GPU-MVO |
|
|---|---|---|---|---|
| MC | 396.9 | 231.9 | 397.6 | 233.5 |
| Dx and DTy | 48.3 | 701.8 | 1.5 | 27.6 |
| Total time | 450.0 | 962.4 | 403.8 | 284.5 |
In S1, the dose engine of an existing CPU-based IMPT optimization system was simply replaced with a GPU-based MC package. As expected, the majority of the computation was spent on dose calculations for the DDC matrix. With the GPU-based MC package for spot dose calculations, the total MC simulation time for 4243 spots with 105 protons per spot was about 397s, showing promise for fast MC-based inverse plan optimization. With the APS method, the MC simulation time can be further reduced to about 233s as shown in S2 and S4. Both scenarios demonstrated that the APS method used MC more effectively and yielded a lower computation time.
For the matrix-vector operations performed on the CPU side, the total time was 48.3s as shown in S1. When the operations were ported to the GPU platform, the time was substantially decreased to 1.5s in the S3 scenario, showing remarkable acceleration due to the GPU-based parallel processing for matrix-vector operations. For S2 and S4, the time for matrix-vector operations increased significantly as compared with S1 and S3, respectively, because of the increased iteration number in the APS scheme.
In S4 scenario, the computation time for the MC part was reduced, although the increased iteration number with APS prolonged the time of the matrix-vector operations as compared with S3. The total computation time was the lowest of all the scenarios. It improved efficiency by ~37% as compared with S1 and ~30% compared with S3.
The total calculation time for the prostate, pancreas, lung, and head-and-neck cancer cases for different treatment techniques with both conventional and APS methods are shown in table 2. In all cases, the matrix-vector operations were performed on the GPU side and hence, the time presented here are for the S3 and S4 scenarios. The proposed method was more efficient than the conventional use of GPU. On average, the computation time was reduced by 41.6±15.3%. We also noted that the computation time depended on the problem size. The OTV volume was larger for the tested head-and-neck case with a total of 30255 spots. Optimization by the proposed APS method was completed in ~50 min, as compared to the ~87 min needed for the conventional method.
Table 2.
Total calculation time (in seconds) for prostate, pancreas, lung, and head-and-neck cancer cases.
| SFUD | 3D-IMPT | DET | |||
|---|---|---|---|---|---|
| Prostate | Spots # | 4243 | 4243 | 2536 | |
| Proton # per spot |
Conventional | 105 | 105 | 105 | |
| Proposed | 6 × 10⁴ | 6 × 10⁴ | 6 × 10⁴ | ||
| Calculation Time |
Conventional | 377.6 | 403.8 | 388.7 | |
| Proposed | 332.5 | 284.5 | 239.0 | ||
| Pancreas | Spots # | 1434 | 1434 | 1739 | |
| Proton # per spot |
Conventional | 105 | 105 | 105 | |
| Proposed | 5 × 10⁴ | 5 × 10⁴ | 5 × 10⁴ | ||
| Calculation Time |
Conventional | 182.8 | 241.9 | 338.5 | |
| Proposed | 112.8 | 113.2 | 111.6 | ||
| Lung | Spots # | 14709 | 14709 | 11019 | |
| Proton # per spot |
Conventional | 105 | 105 | 105 | |
| Proposed | 5 × 10⁴ | 5 × 10⁴ | 5 × 10⁴ | ||
| Calculation Time |
Conventional | 2605.2 | 2542.0 | 1890.5 | |
| Proposed | 1503.2 | 1378.6 | 963.0 | ||
| Head and Neck |
Spots # | 30255 | 30255 | 15099 | |
| Proton # per spot |
Conventional | 105 | 105 | 105 | |
| Proposed | 5 × 10⁴ | 5 × 10⁴ | 5 × 10⁴ | ||
| Calculation Time |
Conventional | 5170.9 | 5211.1 | 2745.4 | |
| Proposed | 3206.0 | 3022.4 | 1537.4 | ||
4. Discussion and Conclusion
We have developed a library that enables a proton inverse optimization system to perform MC-based spot dose calculation on GPU. The APS method previously developed by our group in the photon IMRT regime was extended to the IMPT problem and modified to adapt to proton MC simulations. We tested the developed library in an example inverse optimization system with four patient cases. We found that the library could achieve the targeted functions to support various proton therapy schemes, e.g. SFUD, 3D-IMPT, and DET. Efficiency was 41.6±15.3% higher than in the conventional use of a GPU-based MC package for the IMPT optimization problem. On a single NVIDIA GTX Titan GPU card, the total computation time (including both dose calculation and optimization times) ranged from 2 to 50 min depending on the problem size.
The convergence process of the proposed approach was governed by two facts: 1) convergence of the inverse optimization algorithm with any given DDC matrix, and 2) convergence of MC updates of the DDC matrix. The latter was affected by the parameter NMC, the average number of protons per spot at each APS-based DDC matrix calculation, and NUpdate, the number of iteration steps after which the DDC update was performed. The smaller NUpdate is, the more frequent the DDC is updated. This result is favorable because the system will have more chances to distribute the MC particles among the spots under the guidance of the solution spot intensity, allowing a more effective use of the expensive MC simulations. However, frequently updating the DDC matrix, e.g. under the extreme of NUpdate = 1, is not ideal, because the inverse optimization algorithm may take a few steps to yield a reliable estimate for the solution. Similarly, an optimal NMC level was also observed. A small NMC cannot accurately estimate the DDC matrix in the initial stage of optimization, wasting the optimization process performed on an inaccurate DDC matrix. In contrast, although a large NMC can immediately yield a favorable result for the DDC matrix once optimization begins, it reduces the chances of distributing particles among the spots, making the APS scheme less effective. In our simulations, we manually selected these parameters to yield an acceptable efficiency. Future studies will be aimed to further improve efficiency by fine-tuning these two parameters.
A GPU-based MC dose calculation for IMPT optimization was also reported in a novel study recently (Ma et al., 2014). In this approach, a GPU-based MC package was adopted to calculate the DDC matrix before plan optimization with a total of 24 GPUs. Because of different GPU numbers, optimization algorithms, and problem sizes, the plan optimization efficiency cannot be directly compared with our findings. However, we believe that the APS technique introduced in this study may also be applied to their system to further improve computational efficiency. Meanwhile, a major advantage of using multiple GPUs is the large memory space. In our system, only one GPU card was used and the GPU memory was 6 GB. While this was sufficient for the four cases shown in this paper, the memory limitation may restrict our developments from lager cases. For instance, the head and neck cases studied in Ma et al. (2014) had bilateral tumors and hence the problem size was larger than ours. It would be challenging to handle these large cases in our current setting. The computation time for the head and neck case in our study was also longer, due to the computation power from only one GPU. Our future work will involve extending the system to a multi-GPU platform to enable applications for those large cases.
The APS method is expected to maintain the accuracy of the plan optimization. Along with the iteration (alternatively performing MC-based DDC calculations and plan optimization), more and more particles were transported for each spot and the statistical uncertainty for all the spots were continuously reduced. If the iteration could run indefinitely, the uncertainty of all the spot doses would be eventually small enough, and hence the optimization result would approach the ground truth one. Therefore, the APS approach always converges to the true solution. However, early termination of the iteration could lead to deviations of the solution from the truly optimized one. This problem can be mitigated by using a large enough particle number per spot per iteration, NMC. This makes the uncertainty in the DDC matrix small enough even in the first iteration. In our experiments, we empirically found NMC = 5000Ns was a good choice, as demonstrated by the agreement between the optimized solution obtained in our APS approach and that in the conventional approach.
The proposed GPU library can also be used for biological optimization problems. The RBE of protons depends on various factors such as LET, dose, endpoint, and tissue type. When including biological effect in the optimization problem, the objective function will be much more complicated than the simple quadratic form in Eq. (1) (Wilkens and Oelfke, 2005; Frese et al., 2011; Grassberger et al., 2011; Wedenberg et al., 2013). It has also been proposed to optimize physics quantities that are closely related to RBE in optimization, such as LET (Romano et al., 2014; Giantsoudi et al., 2013). In these scenarios, since the DDC matrix is still needed for the evaluation of physical doses and biological quantities, our library with the APS scheme is expected to be applicable and beneficial in terms of accelerating computations. It should be also noted that biological optimization relies on many not well-known quantities, e.g. alpha and beta of each tissue type. However, since the current study focuses on developing a GPU library for MC-based inverse optimization, this uncertainty issue is beyond the scope of this paper.
One particular benefit in our framework in terms of efficiency comes from the fact that the DDC matrix D is always kept on GPU. The plan optimization process requires the DDC matrix. Because the DDC matrix is frequently updated in the APS scheme, a straightforward idea is to transfer the updated matrix back to the optimizer. However, this leads to frequent transfer of a large amount of data (typically a few GB). In contrast, storing the DDC matrix on GPU reduces the amount of transferred data size, as only data transfer of vectors between GPU and the optimization system is involved. This approach also allows using GPU to perform matrix-vector operations, which is known suitable for the GPU platform.
Metropolis algorithm was used to sample particles from different proton spots. For an energy layer E, the problem was to sample particles from a group of spots, such that the number of particles from a spot j was approximately proportional to the spot intensity xj. Meanwhile, to reduce the memory-writing conflict, it was desired to make concurrently sampled particles in different GPU threads from spatially separated locations. This can be indeed achieved by using some complicated algorithms. Hence the Metropolis algorithm was not absolutely necessary. However, this algorithm was a simple but effective approach to achieve the goal. In our implementation, each GPU thread performed the Metropolis sampling independent of each other. The generated spot indices at different threads were uncorrelated. This was expected to reduce the chance of having multiple protons from the same spot. Moreover, in the simple Metropolis algorithm, all the threads performed the same operation with different data, which was favorable because of GPU’s single-instruction multiple-data scheme. We would also like to remark that the Metropolis sampling method is a statistical approach to achieve the biased sampling. It, however, does not strictly enforce that the number of particles is exactly proportional to the spot weight. This fact can be observed in Fig. 4. Nonetheless, because the biased sampling was realized, we achieved our goal of spending the MC computations on those important spots.
Acknowledgments
This study was supported by grants from NIH (5P20-CA183639-02) and the National Natural Science Foundation of China (No.11275105). The authors would like to thank Dr. Damiana Chiavolini for editing the manuscript.
Reference
- American Society of Radiation Oncology. ASTRO model policies, proton beam therapy (PBT) 2014 https://www.astro.org/uploadedFiles/Main_Site/Practice_Management/Reimbursement/ASTRO%20PBT%20Model%20Policy%20FINAL.pdf. [Google Scholar]
- Barzilai J, Borwein JM. 2-point step size gradient methods. IMA Journal of Numerical Analysis. 1988;8:141–148. [Google Scholar]
- Bell N, Garland M. Efficient Sparse Matrix-Vector Multiplication on {CUDA. NVIDIA Technical Report. 2008 NVR-2008-004. [Google Scholar]
- Frese MC, Wilkens JJ, Huber PE, Jensen AD, et al. Application of constant vs. variable relative biological effectiveness in treatment planning of intensity-modulated proton therapy. International journal of radiation oncology, biology, physics. 2011;79:80–88. doi: 10.1016/j.ijrobp.2009.10.022. [DOI] [PubMed] [Google Scholar]
- Giantsoudi D, Grassberger C, Craft D, Niemierko A, et al. Linear energy transfer-guided optimization in intensity modulated proton therapy: feasibility study and clinical potential. International journal of radiation oncology, biology, physics. 2013;87:216–222. doi: 10.1016/j.ijrobp.2013.05.013. [DOI] [PMC free article] [PubMed] [Google Scholar]
- Grassberger C, Trofimov A, Lomax A, Paganetti H. Variations in linear energy transfer within clinical proton therapy fields and the potential for biological treatment planning. International journal of radiation oncology, biology, physics. 2011;80:1559–1566. doi: 10.1016/j.ijrobp.2010.10.027. [DOI] [PMC free article] [PubMed] [Google Scholar]
- Jia X, Schumann J, Paganetti H, Jiang SB. GPU-based fast Monte Carlo dose calculation for proton therapy. Physics in medicine and biology. 2012;57:7783–7797. doi: 10.1088/0031-9155/57/23/7783. [DOI] [PMC free article] [PubMed] [Google Scholar]
- Li HS, Romeijn HE, Fox C, Palta JR, et al. A computational implementation and comparison of several intensity modulated proton therapy treatment planning algorithms. Medical Physics. 2008;35:1103–1112. doi: 10.1118/1.2836954. [DOI] [PubMed] [Google Scholar]
- Li YB, Tian Z, Shi F, Song T, et al. A new Monte Carlo-based treatment plan optimization approach for intensity modulated radiation therapy. Physics in medicine and biology. 2015;60:2903–2919. doi: 10.1088/0031-9155/60/7/2903. [DOI] [PubMed] [Google Scholar]
- Liu W, Li Y, Li X, Cao W, et al. Influence of robust optimization in intensity-modulated proton therapy with different dose delivery techniques. Med Phys. 2012;39:3089–3101. doi: 10.1118/1.4711909. [DOI] [PMC free article] [PubMed] [Google Scholar]
- Lomax A. Intensity modulation methods for proton radiotherapy. Physics in medicine and biology. 1999;44:185–205. doi: 10.1088/0031-9155/44/1/014. [DOI] [PubMed] [Google Scholar]
- Ma J, Beltran C, Seum Wan Chan Tseung H, Herman MG. A GPU-accelerated and Monte Carlo-based intensity modulated proton therapy optimization system. Med Phys. 2014;41:121707. doi: 10.1118/1.4901522. [DOI] [PubMed] [Google Scholar]
- Mairani A, Bohlen TT, Schiavi A, Tessonnier T, et al. A Monte Carlo-based treatment planning tool for proton therapy. Physics in medicine and biology. 2013;58:2471–2490. doi: 10.1088/0031-9155/58/8/2471. [DOI] [PubMed] [Google Scholar]
- Men C, Gu X, Choi D, Majumdar A, et al. GPU-based ultrafast IMRT plan optimization. Physics in medicine and biology. 2009;54:6565–6573. doi: 10.1088/0031-9155/54/21/008. [DOI] [PubMed] [Google Scholar]
- Metropolis N, Rosenbluth AW, Rosenbluth MN, Teller AH, et al. EQUATION OF STATE CALCULATIONS BY FAST COMPUTING MACHINES. Journal of Chemical Physics. 1953;21:1087–1092. [Google Scholar]
- NVIDIA. cuSPARSE Library. 2015 www.nvidia.com. [Google Scholar]
- Paganetti H. Range uncertainties in proton therapy and the role of Monte Carlo simulations. Physics in medicine and biology. 2012;57:R99–R117. doi: 10.1088/0031-9155/57/11/R99. [DOI] [PMC free article] [PubMed] [Google Scholar]
- Paganetti H, Jiang H, Parodi K, Slopsema R, et al. Clinical implementation of full Monte Carlo dose calculation in proton beam therapy. Physics in medicine and biology. 2008;53:4825–4853. doi: 10.1088/0031-9155/53/17/023. [DOI] [PubMed] [Google Scholar]
- Perl J, Shin J, Schümann J, Faddegon B, et al. TOPAS: An innovative proton Monte Carlo platform for research and clinical applications. Medical Physics. 2012;39:6818–6837. doi: 10.1118/1.4758060. [DOI] [PMC free article] [PubMed] [Google Scholar]
- Renaud MA, Roberge D, Seuntjens J. Latent uncertainties of the precalculated track Monte Carlo method. Med Phys. 2015;42:479–490. doi: 10.1118/1.4903502. [DOI] [PubMed] [Google Scholar]
- Romano F, Cirrone GA, Cuttone G, Rosa FD, et al. A Monte Carlo study for the calculation of the average linear energy transfer (LET) distributions for a clinical proton beam line and a radiobiological carbon ion beam line. Physics in medicine and biology. 2014;59:2863–2882. doi: 10.1088/0031-9155/59/12/2863. [DOI] [PubMed] [Google Scholar]
- Tourovsky A, Lomax AJ, Schneider U, Pedroni E. Monte Carlo dose calculations for spot scanned proton therapy. Physics in medicine and biology. 2005;50:971–981. doi: 10.1088/0031-9155/50/5/019. [DOI] [PubMed] [Google Scholar]
- Wan Chan Tseung H, Ma J, Beltran C. A fast GPU-based Monte Carlo simulation of proton transport with detailed modeling of nonelastic interactions. Med Phys. 2015;42:2967. doi: 10.1118/1.4921046. [DOI] [PubMed] [Google Scholar]
- Wedenberg M, Lind BK, Hardemark B. A model for the relative biological effectiveness of protons: the tissue specific parameter alpha/beta of photons is a predictor for the sensitivity to LET changes. Acta Oncol. 2013;52:580–588. doi: 10.3109/0284186X.2012.705892. [DOI] [PubMed] [Google Scholar]
- Wilkens JJ, Oelfke U. Optimization of radiobiological effects in intensity modulated proton therapy. Medical Physics. 2005;32:455–465. doi: 10.1118/1.1851925. [DOI] [PubMed] [Google Scholar]
- Yepes P, Randeniya S, Taddei PJ, Newhauser WD. Monte Carlo fast dose calculator for proton radiotherapy: application to a voxelized geometry representing a patient with prostate cancer. Physics in medicine and biology. 2009;54:N21–N28. doi: 10.1088/0031-9155/54/1/N03. [DOI] [PMC free article] [PubMed] [Google Scholar]


