

Abstract
Objective:
In this cross-sectional study, we aimed to evaluate brain structural abnormalities in relation to glial activation in the same cohort of participants.
Methods:
Ten individuals with amyotrophic lateral sclerosis (ALS) and 10 matched healthy controls underwent brain imaging using integrated MR/PET and the radioligand [11C]-PBR28. Diagnosis history and clinical assessments including Upper Motor Neuron Burden Scale (UMNB) were obtained from patients with ALS. Diffusion tensor imaging (DTI) analyses including tract-based spatial statistics and tractography were applied. DTI metrics including fractional anisotropy (FA) and diffusivities (mean, axial, and radial) were measured in regions of interest. Cortical thickness was assessed using surface-based analysis. The locations of structural changes, measured by DTI and the areas of cortical thinning, were compared to regional glial activation measured by relative [11C]-PBR28 uptake.
Results:
In this cohort of individuals with ALS, reduced FA and cortical thinning colocalized with regions demonstrating higher radioligand binding. [11C]-PBR28 binding in the left motor cortex was correlated with FA (r = −0.68, p < 0.05) and cortical thickness (r = −0.75, p < 0.05). UMNB was correlated with glial activation (r = +0.75, p < 0.05), FA (r = −0.77, p < 0.05), and cortical thickness (r = −0.75, p < 0.05) in the motor cortex.
Conclusions:
Increased uptake of the glial marker [11C]-PBR28 colocalizes with changes in FA and cortical thinning. This suggests a link between disease mechanisms (gliosis and inflammation) and structural changes (cortical thinning and white and gray matter changes). In this multimodal neuroimaging work, we provide an in vivo model to investigate the pathogenesis of ALS.
The pathophysiology of amyotrophic lateral sclerosis (ALS) is poorly understood, but the immune system has increasingly been implicated in the pathogenesis of the disease.1 Activated microglia are increased in postmortem brain and spinal cord tissue from people with ALS, and the number of activated microglia correlates with the rate of disease progression.2 A strong proinflammatory signature in ALS is found from gene expression profiling of postmortem spinal cord tissue.3 In addition, proinflammatory cytokines are increased in CSF.4 Studies in the widely used SOD1G93A transgenic ALS mouse model showed activated microglia near the motor neurons before the onset of weakness and the inflammatory response in these mice correlates with disease progression.5
[11C]-PBR28 is a PET radiotracer that selectively binds to the translocator protein (TSPO). TSPO is upregulated in activated microglia and reactive astrocytes.6,7 We previously reported increased glial activation measured by [11C]-PBR28 uptake in the motor cortices in people with ALS.8
We hypothesize that glial activation measured by [11C]-PBR28 binding is anatomically correlated with microstructural tissue damage including subcortical white matter changes and cortical thinning. Our hypothesis is anchored on ALS postmortem and mouse model pathology showing active microglia and astrogliosis surrounding degenerating motor neurons.5,9
This study demonstrates the value of simultaneous MR/PET in vivo imaging techniques in measuring structural and molecular changes in patients with ALS compared to healthy controls (HC).
METHODS
Standard protocol approvals, registrations, and patient consents.
This study was approved by the local institutional review board and the Radioactive Drug Research Committee. All participants provided written informed consent for study participation.
Study participants.
In this study, we investigated a cohort of previously reported participants.8 The participants are 10 individuals diagnosed with ALS and 10 HC matching in age, sex, and [11C]-PBR28 binding affinity. Demographic information and clinical assessment are summarized in table 1. [11C]-PBR28 binding affinity studies using postmortem human brain tissue revealed substantial variation (low, mixed, high) in binding affinity of [11C]-PBR28 for TSPO.10 This variation is due to a single nucleotide polymorphism (rs6971) in the gene encoding TSPO, which causes a substitution of threonine and alanine at position 147 (Ala147Thr). All participants were tested for this polymorphism and groups were matched for the number of medium and high affinity binders.
Table 1.
Demographic data, amyotrophic lateral sclerosis (ALS) history, and clinical assessment
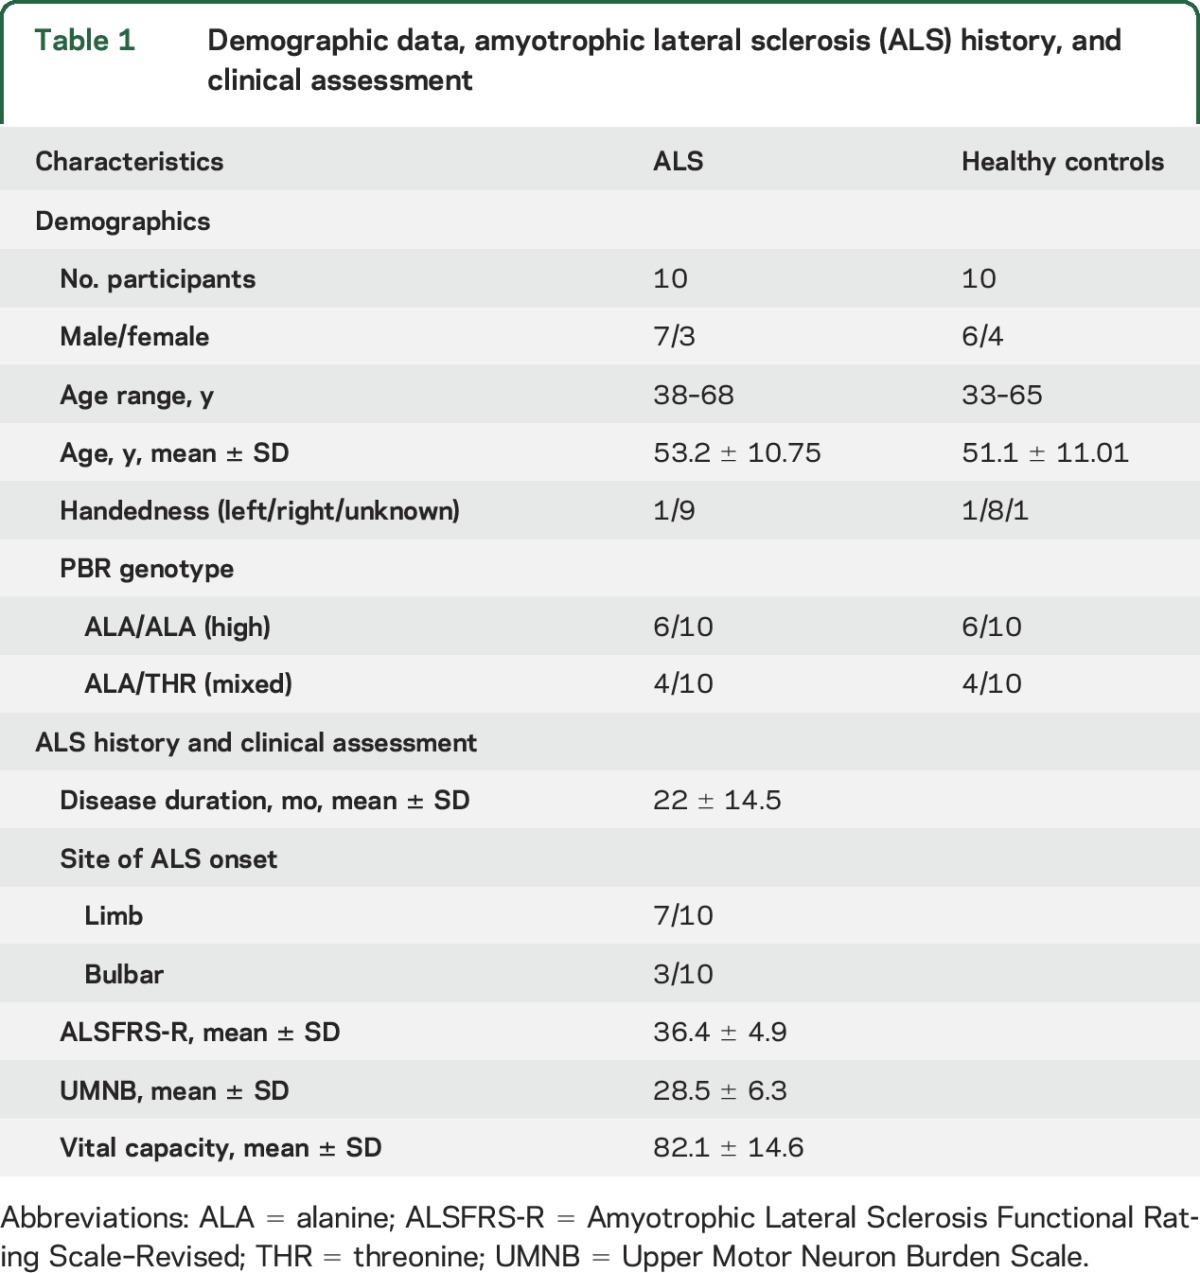
Participants with ALS were diagnosed with possible, probable, probable laboratory-supported, or definite ALS, according to modified El Escorial criteria.11 None of the ALS participants had clinical signs of frontotemporal dementia and none of the study participants were taking benzodiazepines, immunosuppressants, or anti-inflammatory medications.
ALS evaluation.
The Upper Motor Neuron Burden Scale (UMNB) was obtained from all participants with ALS. This scale measures the following deep tendon reflexes: biceps, brachioradialis, triceps, knee jerk, ankle jerk (scores 0–4); and pathologic reflexes: Hoffman, Babinski, and jaw jerk (present, 1; or absent, 0). All reflexes are assessed bilaterally except for jaw jerk, producing a scale ranging between 0 and 45. Higher scores indicate a greater extent of upper motor neuron dysfunction. The Revised ALS Functional Rating Scale (ALSFRS-R) was administered to all participants with ALS.12 ALSFRS-R is a quantitative measure of ALS-related physical and functional deficits and ranges from 0 to 48, with lower scores representing more disability.
[11C]-PBR28 radiotracer administration.
[11C]-PBR28 was produced in-house as described previously.8 The radioligand was injected as slow IV bolus, with a mean administered dose of 430 MBq ± 34 for participants with ALS and 424 MBq ± 42 for HC.
MR/PET data acquisition.
Imaging data were collected at the Martinos Center for Biomedical Imaging at the Massachusetts General Hospital, using a Siemens 3T Magnetom Tim Trio scanner (Siemens, Erlangen, Germany). This magnetic resonance (MR) scanner is equipped with an 8-channel head coil and a dedicated brain avalanche photodiode-based PET scanner operating in the bore of the 3T whole-body MR scanner. MRI scans included diffusion-weighted imaging and a T1-weighted 3D multiecho magnetization-prepared rapid acquisition gradient echo. The acquisition parameters are listed in table e-1 at Neurology.org. A multislice single-shot echo planar spin echo pulse sequence was employed to obtain measurements at a diffusion weighting of b = 3,000 s/mm2 and the diffusion-encoding directions were distributed uniformly over the surface of a sphere using electrostatic repulsion. Images were acquired using a single-shot, spin echo, and echo planar imaging sequence with twice refocused spin echo diffusion preparation (Q-ball imaging). Each series included 60 images acquired with diffusion weighting and 8 noncollinear directions. PET data and structural scans were acquired simultaneously for all 20 participants and diffusion data were acquired for all but 4 HC participants due to scanning time limitations.
MR/PET data preprocessing.
PET images were reconstructed as previously described.8 The images of standardized uptake value (SUV) were created for radioactivity in the field of view 60–90 minutes post radioligand injection. These images were normalized to the whole brain mean (SUV ratio [SUVR] 60–90 minutes) as previously reported.8,13 Preprocessing of raw diffusion data was performed using FMRIB software library (FSL; Oxford, UK) version 5.0.7.14 The following measures were applied to determine whether diffusion tensor imaging (DTI) scans acquired were of sufficient quality15: percentage of slices with signal dropout score and motion parameters as well as signal to noise ratio evaluation for every scan. Cortical and subcortical segmentation of the T1 images was carried out in Freesurfer version 5.3.
MR/PET data analyses.
Diffusion analyses and correlation with [11C]-PBR28 SUVR.
Tract-based spatial statistical analysis (TBSS).
TBSS, part of FSL,16 was applied to study white matter changes in ALS. The fractional anisotropy (FA) and non-FA maps (mean diffusivity [MD], axial diffusivity [AD], and radial diffusivity [RD]) were fed consecutively into the TBSS processing pipeline.16 Voxelwise analyses were performed by FSL randomise17 using threshold-free cluster enhancement18 and 5,000 permutations. The resultant statistical maps were family-wise error (FWE) adjusted and thresholded to pFWE < 0.05. The anatomical locations were determined by using the JHU White-Matter Tractography Atlas.19 In addition, age was included as a covariate in these analyses, to control for the potential confounding effect of this factor.
Precentral gyrus (PCG) region of interest (ROI) analyses.
The predetermined ROIs for the left and right PCG for both the gray matter and the underlying white matter were derived from the automatic T1 segmentation in Freesurfer.20 Those ROIs were used to estimate FA, diffusivities, and [11C]-PBR28 SUVR. All statistical analyses were performed using JMP pro 12.0.1 (SAS Institute Inc., Cary, NC). Between-group differences were tested using independent samples t test. Effect size (Cohen d and 95% confidence interval) was calculated based on differences between groups. Spearman correlation coefficients were calculated.
DTI-derived corticospinal tract (CST) tractography.
Depending on TBSS findings and in order to obtain a mask for the upper part of CST, our other ROI, local probabilistic tractography of CST was carried out using FSL tools. We used masks from the output of T1 segmentation in Freesurfer as seed and target. The seed was located in the cortical parcellate of the PCG and the target mask at the level of the basal ganglia. FMRIB's linear image registration tool (FLIRT) was used to linearly transform each FA and non-FA map to T1 and the reverse matrix was applied to move each mask (seed and target) from T1 to diffusion space. BedpostX/ProbTrackX algorithm was run with its default parameters: 2-fiber model per voxel, 5,000 probabilistic streamlines for each tract with a fixed separation distance of 0.5 mm between successive points to generate the underlying white matter connectivity data.21 In order to measure [11C]-PBR28 SUVR within CST, the CST probabilistic distribution map (derived from ProbTrackX and thresholded for values >0.20 to constrain the resultant pathway to white matter voxels) was used as an ROI. The analysis was conducted in MNI152 standard space. FLIRT and FMRIB's nonlinear image registration tool were used to transform each SUVR map to MNI152 and FLIRT was used to linearly transform each DTI map to MNI152. Each CST ROI was also transformed into MNI152.
Correlation between DTI metrics and [11C]-PBR28 SUVR in PCG.
Spearman analyses were conducted to investigate the relationship between DTI metrics and [11C]-PBR28 SUVR within the gray and white matter parcellates of the left and right PCG. The significance threshold was set at (p < 0.05).
Cortical thickness analysis and correlation with [11C]-PBR28 SUVR.
Whole brain surface-based morphometric analysis.
The thickness of the motor cortex was measured using Freesurfer v.5.3.22,23 Surface-based cortical thickness comparison between ALS and HC was performed in Qdec V1.5, a statistical tool part of Freesurfer. False discovery rate (FDR) was applied to correct the results for multiple comparisons (p < 0.05).
Correlation between cortical thickness and [11C]-PBR28 uptake in PCG.
Spearman correlation was carried out to investigate the relationship between cortical thickness and [11C]-PBR28 SUVR in PCG.
Correlations between clinical UMNB score and DTI metrics, cortical thickness, and [11C]-PBR28 uptake.
Spearman correlations were employed to evaluate the relationship between UMNB and DTI metrics, UMNB and cortical thickness, and UMNB and [11C]-PBR28 SUVR within the bilateral PCG (right and left PCG).
Correlations among rate of disease progression (RDP), [11C]-PBR28 uptake in the motor cortex, cortical thickness, and DTI metrics.
RDP was measured using the following formula:
RDP = (total ALSFRS [48] − ALSFRS at time of scan)/disease duration at time of scan
Spearman analysis was used to test the relationship between RDP and MR/PET measures.
RESULTS
Diffusion analyses and correlation with [11C]-PBR28 SUVR.
TBSS whole brain white matter skeleton.
TBSS revealed widespread decreased FA values (pFWE < 0.05) in ALS compared to HC in multiple white matter tracts (table e-2). By far, the largest reduction in FA (smaller p value) was observed along the upper part of the left CST (figure 1A, table e-1), which anatomically colocalized with the most increased [11C]-PBR28 uptake in ALS compared to HC (figure 1B, table 2). Feeding non-FA images into TBSS yielded no difference between the groups. Including age as a covariate led to the same findings for both FA and non-FA images as when age was not included.
Figure 1. [11C]-PBR28 uptake colocalizes with reduced fractional anisotropy (FA) in the motor cortex.

(A) Tract-based spatial statistical analysis (TBSS) for 10 participants with amyotrophic lateral sclerosis (ALS) and 6 healthy controls (HC) revealed decreased FA values in ALS (pFWE < 0.05). Blue represents decreased FA in ALS in comparison with HC. Green shows the mean FA skeleton calculated for all participants by TBSS. The statistical map and the skeleton were transformed from FMRIB58 space to Montreal Neurological Institute (MNI) 152-T1-1 mm standard space and are shown at coordinates x = 8, y = −20, z = 64. (B) Voxel-wise whole brain analysis for 10 participants with ALS and 10 controls shows differences in [11C]-PBR28 binding in ALS (pFWE < 0.05). Red to yellow represents higher [11C]-PBR28 binding in ALS in comparison with HC. The statistical map is displayed in MNI 152-T1-1 mm standard space and shown at coordinates x = 8, y = −20, z = 64. (C) Boxplot representation (box contains median, 25th, and 75th percentiles) of FA values as measured in the left and right precentral gyrus (PCG). The left orange box corresponds to FA values in ALS and the right blue box to HC. The horizontal white line in each box represents the median. (D) Scatterplot shows the correlation between FA values and [11C]-PBR28 SUVR as measured in the left PCG in ALS. FWE = family-wise error; SUVR = standardized uptake value ratio.
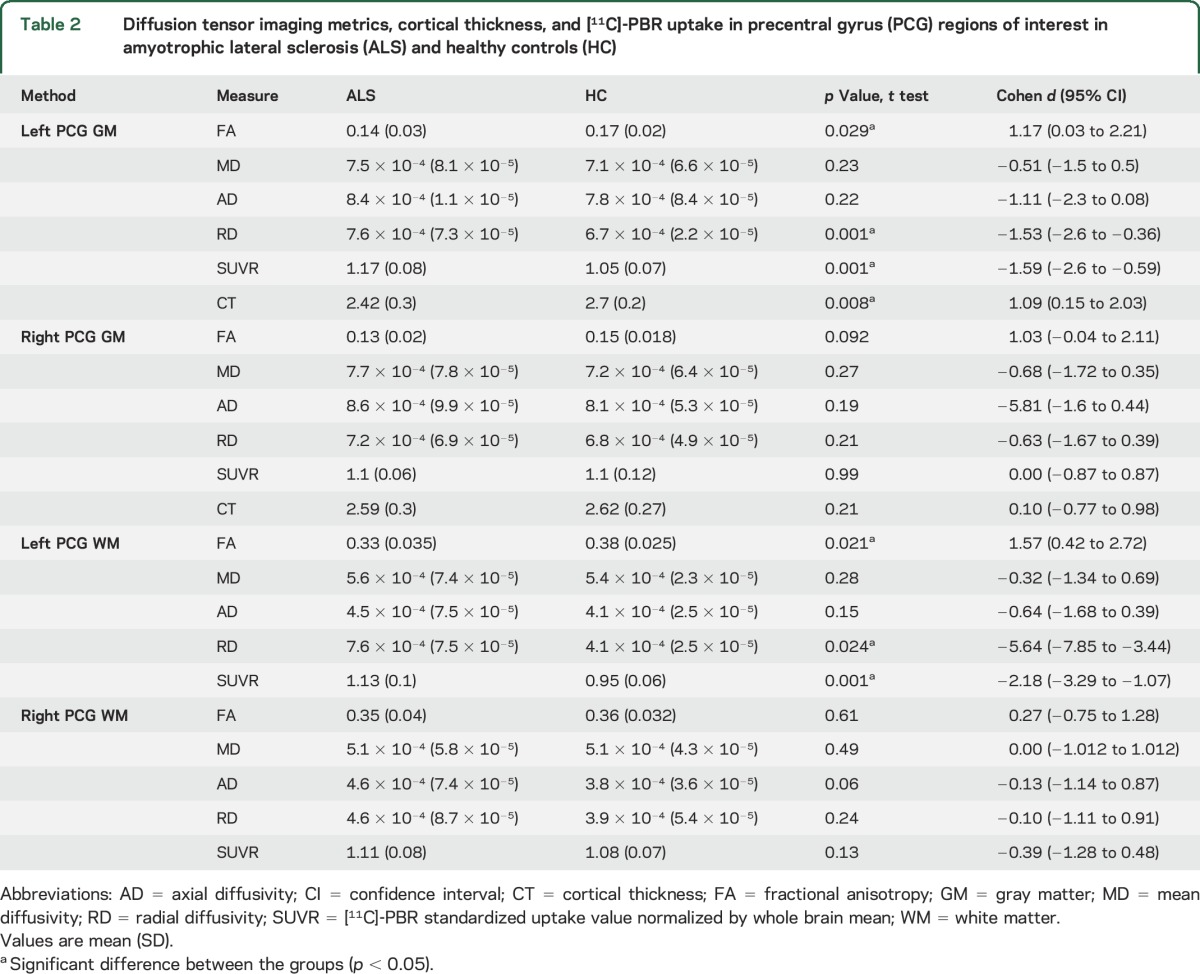
Table 2.
Diffusion tensor imaging metrics, cortical thickness, and [11C]-PBR uptake in precentral gyrus (PCG) regions of interest in amyotrophic lateral sclerosis (ALS) and healthy controls (HC)
ROI-PCG gray and white matter.
ROI analysis in the cortical parcellate (gray matter) of the left PCG showed an 18% decrease in FA and a 10% increase in [11C]-PBR28 SUVR in ALS compared to HC (figure 1C). ROI analysis of the white matter parcellate of the left PCG showed 13% decreased FA and 16% increased [11C]-PBR28 SUVR in the ALS group compared to HC (all, p < 0.05) (table 2).
Neither FA nor [11C]-PBR28 SUVR values were different between the groups in the right PCG (gray and white matter) (table 2).
RD was higher in the left PCG (gray and white matter) in ALS compared to HC (p < 0.05), but not the right PCG (table 2).
DTI-derived CST tractography.
Local tractography analysis revealed decreased FA values (p < 0.05) and increased diffusivities within the left and right CST in ALS compared to HC. Using the probabilistic distribution map of CST as ROI, [11C]-PBR28 SUVR was higher (p < 0.05) in the left but not the right CST in ALS (table e-3).
Correlation between DTI metrics and [11C]-PBR28 SUVR in PCG and CST.
The reduction in FA was correlated with increased [11C]-PBR28 SUVR in the cortical parcellate (gray matter) of the left PCG (r = −0.69, p = 0.028) (figure 1D) but not in the right PCG (r = −0.31, p = 0.32) in ALS. No correlations were detected among FA, diffusivities, and [11C]-PBR28 SUVR in ALS in the white matter parcellates of PCG for both hemispheres or in the reconstructed CST for both hemispheres.
Cortical thickness analysis and correlation with [11C]-PBR28 SUVR.
Whole brain surface-based morphometric analysis.
Group comparisons reveal a difference in cortical thickness between ALS and HC in the left PCG (p < 0.05, FDR-corrected) (figure 2A, table 2). The ALS group showed 16% thinning of the cortical parcellate of the left PCG compared to HC (p < 0.05). Cortical thinning colocalizes anatomically with the region of increased PBR28 uptake (figure 2, A and B). In this cohort, there was no difference in cortical thickness of the right PCG between ALS and HC (figure 2C, table 2).
Figure 2. [11C]-PBR28 uptake colocalizes with cortical thinning.

(A) Statistical map of cortical thickness differences between patients with amyotrophic lateral sclerosis (ALS) and healthy controls (HC) shows cortical thinning in the left precentral gyrus (PCG) in ALS. The results are FDR corrected. (B) Projection onto the surface of voxel-wise whole brain analysis for 10 patients with ALS and 10 HC shows brain regions of higher [11C]-PBR28 binding in ALS compared to controls (pFWE < 0.05). (C) Boxplot representation (box contains median, 25th, and 75th percentiles) of cortical thickness in the left and right PCG. The left orange box shows cortical thickness in ALS and the right blue box in HC. The horizontal white line in each box represents the median. (D) Scatterplot shows the correlation between cortical thickness and [11C]-PBR28 standardized uptake value ratio (SUVR) as measured in the left PCG in ALS. (E) Scatterplot shows the correlation between cortical thickness and radial diffusivity in the left PCG in ALS. FWE = family-wise error.
Correlation between cortical thickness and [11C]-PBR28 uptake in PCG.
The correlation between cortical thickness and [11C]-PBR28 SUVR was r = −0.75 (p = 0.011) in the left PCG and r = +0.03 (p = 0.93) in the right PCG in ALS (figure 2D).
Correlation between cortical thickness and DTI metrics in the PCG.
Cortical thickness and RD were correlated only in the left PCG (r = −0.73, p = 0.011) (figure 2E). No correlations were detected between FA, MD, AD, and cortical thickness in the left or right PCG.
Correlations between clinical UMNB score, DTI metrics, cortical thickness, and [11C]-PBR28 uptake.
The UMNB score was correlated with FA (r = −0.77; p = 0.011), cortical thickness (r = −0.75, p = 0.011) (figure 3, A and B), and [11C]-PBR28 SUVR (r = +0.75, p < 0.05) (figure 3C) in the bilateral PCG. No correlations were detected between diffusivities and UMNB.
Figure 3. Correlations with Upper Motor Neuron Burden Scale (UMNB).

(A) Correlation between UMNB and fractional anisotropy (FA) within the bilateral precentral gyrus (PCG). (B) Correlation between UMNB and bilateral PCG thickness. (C) Correlation between UMNB and standardized uptake value ratio within the bilateral PCG. ALS = amyotrophic lateral sclerosis.
Correlations between RDP, [11C]-PBR28 uptake, cortical thickness, and DTI metrics in bilateral PCG.
No correlations were detected between RDP, [11C]-PBR28 uptake, cortical thickness, and DTI metrics in the bilateral PCG.
DISCUSSION
We found anatomical links between molecular changes (expression of the glial marker TSPO) and structural anomalies (decreased FA, increased diffusivity and cortical thinning) in patients with ALS compared to HC. We previously provided in vivo evidence for glial activation in the motor cortices and subcortical white matter in ALS using [11C]-PBR28 PET.8 Here, we report altered white and gray matter integrity in the same regions of increased glial activation, in the same cohort of participants. Specifically, increased [11C]-PBR28 uptake in the motor cortex (gray matter) in participants with ALS was associated with cortical thinning and loss of tissue integrity as indicated by decreased FA and increased diffusivity. All 3 measures including [11C]-PBR28, cortical thickness, and FA were strongly correlated with clinical upper motor neuron dysfunction as measured by UMNB.
In this cohort, structural abnormalities and increased glial activation were more statistically significant in the left PCG. Unilateral effects have been described in the literature (e.g., only in the right PCG,24–27 only in the left PCG,28 or bilateral motor cortices29–33).
Several factors can contribute to the laterality of our results, as well as those reported by groups. These factors include different phenotypes of study populations and the thresholds applied to the statistical maps. When examining the data using lower statistical thresholds, it becomes apparent that both hemispheres are affected. Therefore, it is possible that statistical threshold may be partly responsible for the observed laterality. On the other hand, the colocalization we saw in this study between different imaging modalities strengthens the relevance of these results and demonstrates the power of multimodal neuroimaging approaches.
Our results indicate a mechanistic link between tissue integrity and glial activation in people with sporadic ALS. In neuroimaging studies, combining multiple advanced neuroimaging modalities has contributed to a better understanding of disease mechanism in ALS. For example, using DTI and MR spectroscopic imaging (MRSI) to evaluate structural and neurochemical characteristics of brain in ALS has demonstrated in vivo evidence of neuroinflammation, gliosis, and degeneration of the motor cortices and CST.34,35 Although MRSI metabolites (e.g., myo-inositol) are not specific for neuroinflammation or gliosis, the relationship between these measures and the metrics of DTI is interesting. On the other hand, MRI measures and the molecular markers of inflammation assessed with PET have been reported in few diseases. For example, in secondary progressive multiple sclerosis, adenosine A2A receptor availability, which is upregulated during inflammation, was correlated with FA in the normal-appearing white matter.36 This is additional evidence highlighting the link between increases in CNS inflammation and decreases in tissue integrity.
Cortical thinning and decreases in FA and increased diffusivity have been reported previously in ALS cross-sectional studies.37 Here, we were able to replicate these findings, and in addition, show colocalization with a molecular marker of glial activation. One can speculate that we are observing both cause and effect of neurodegeneration. In other words, when cortical motor neurons degenerate, they lose their intrinsic axons, which may trigger regional reactive glial activation, and vice versa. The proinflammatory mediators expressed by activated glia can lead to axonal loss and neurodegeneration.38
It is debated whether glial activation is protective or toxic in neurodegeneration; however, prior studies in ALS mouse models suggest that inflammation and glial activation play an important role in accelerating disease progression.39,40
In this study, the structural and molecular changes of neuroimaging analyses were strongly correlated with clinical signs of upper motor neuron dysfunction, demonstrating the clinical relevance of our findings. On the other hand, the rate of disease progression did not correlate with the imaging findings. It is possible that the relationship between the anatomical changes and disease progression is nonlinear or the sample size is too small to show statistical significance. Future longitudinal studies with and without therapeutic interventions are needed to address the temporal sequence of events, including changes in FA within gray and white matter regions, inflammation, cortical thinning, and clinical disease progression.
Small sample size is the major limitation of this study. We consider our results as exciting preliminary data that need further replication in larger studies. At the same time, our data demonstrate concordance across multiple imaging modalities that solidifies the validity of our findings within this small cohort.
Our findings, although preliminary, could still have direct implications on clinical drug development for ALS and other neurodegenerative disorders. Historically, most phase II clinical trials that assess preliminary efficacy in ALS have been significantly underpowered because of the use of clinical measures such as ALSFRS-R as primary trial outcomes. This phenomenon resulted in a number of false-positive phase II trials of drug candidates that failed in later and more expensive stages of development. Using molecular outcomes such as [11C]-PBR28-PET in early phase II clinical trials could provide invaluable information on the biological activity of the experimental treatment at the relevant site of action (motor cortex, for example). This could also help with dose selection and eventually making go-no-go decisions based on molecular and mechanism-based evidence of target engagement.
Supplementary Material
ACKNOWLEDGMENT
The authors thank Chris Moseley, Steve Carlin, Nathan Schauer, and Ehimen Aisaborhale for the radiotracer synthesis and Grae Arabasz, Shirley Hsu, Patricia McCarthy, Marlene Wentworth, and Alina Stout for assistance with MR/PET. The study was conducted at the A.A. Martinos Center for Biomedical Imaging.
GLOSSARY
- AD
axial diffusivity
- ALS
amyotrophic lateral sclerosis
- ALSFRS-R
ALS Functional Rating Scale–Revised
- CST
corticospinal tract
- DTI
diffusion tensor imaging
- FA
fractional anisotropy
- FDR
false discovery rate
- FLIRT
FMRIB's linear image registration tool
- FSL
FMRIB software library
- FWE
family-wise error
- HC
healthy controls
- MD
mean diffusivity
- MR
magnetic resonance
- MRSI
magnetic resonance spectroscopic imaging
- PCG
precentral gyrus
- RD
radial diffusivity
- RDP
rate of disease progression
- ROI
region of interest
- SUV
standardized uptake value
- SUVR
standardized uptake value ratio
- TBSS
tract-based spatial statistical analysis
- TSPO
translocator protein
- UMNB
Upper Motor Neuron Burden Scale
Footnotes
Supplemental data at Neurology.org
Editorial, page 2508
AUTHOR CONTRIBUTIONS
Mohamad J. Alshikho: study concept and design, analysis and interpretation of data. Nicole R. Zurcher: study concept and design, analysis and interpretation of data. Marco L. Loggia, study concept and design, interpretation of data. Paul Michael Cernasov: acquisition of data. Daniel B. Chonde: data analysis. David Izquierdo-Garcia: data analysis. Julia E. Yasek: acquisition of data. Oluwaseun Johnson-Akeju: acquisition of data. Ciprian Catana: data analysis. Bruce R. Rosen: study concept and design, study supervision. Merit E. Cudkowicz: study concept and design, study supervision. Jacob M. Hooker: study concept and design, study supervision. Nazem Atassi: study concept and design, study supervision.
STUDY FUNDING
Funded by a grant from the Harvard NeuroDiscovery Center (PI: Dr. Atassi) and 1K23NS083715-01A1 grant from NINDS (PI: Dr. Atassi).
DISCLOSURE
M. Alshikho, N. Zurcher, M. Loggia, P. Cernasov, D. Chonde, D. Izquierdo-Garcia, J. Yasek, O. Johnson-Akeju, C. Catana, and B. Rosen report no disclosures relevant to the manuscript. M. Cudkowicz consulted for Cytokinetics, AstraZeneca, Biohaven, Karyopharm, and Genentech. J. Hooker reports no disclosures relevant to the manuscript. N. Atassi consulted for Biogen and Mitsubishi Tanabe. Go to Neurology.org for full disclosures.
REFERENCES
- 1.McCombe PA, Henderson RD. The role of immune and inflammatory mechanisms in ALS. Curr Mol Med 2011;11:246–254. [DOI] [PMC free article] [PubMed] [Google Scholar]
- 2.Brettschneider J, Toledo JB, Van Deerlin VM, et al. Microglial activation correlates with disease progression and upper motor neuron clinical symptoms in amyotrophic lateral sclerosis. PLoS One 2012;7:e39216. [DOI] [PMC free article] [PubMed] [Google Scholar]
- 3.Lobsiger CS, Boillee S, Pozniak C, et al. C1q induction and global complement pathway activation do not contribute to ALS toxicity in mutant SOD1 mice. Proc Natl Acad Sci USA 2013;110:E4385–E4392. [DOI] [PMC free article] [PubMed] [Google Scholar]
- 4.Rentzos M, Rombos A, Nikolaou C, et al. Interleukin-15 and interleukin-12 are elevated in serum and cerebrospinal fluid of patients with amyotrophic lateral sclerosis. Eur Neurol 2010;63:285–290. [DOI] [PubMed] [Google Scholar]
- 5.Keller AF, Gravel M, Kriz J. Live imaging of amyotrophic lateral sclerosis pathogenesis: disease onset is characterized by marked induction of GFAP in Schwann cells. Glia 2009;57:1130–1142. [DOI] [PubMed] [Google Scholar]
- 6.Brown AK, Fujita M, Fujimura Y, et al. Radiation dosimetry and biodistribution in monkey and man of 11C-PBR28: a PET radioligand to image inflammation. J Nucl Med 2007;48:2072–2079. [DOI] [PubMed] [Google Scholar]
- 7.Lavisse S, Guillermier M, Herard AS, et al. Reactive astrocytes overexpress TSPO and are detected by TSPO positron emission tomography imaging. J Neurosci 2012;32:10809–10818. [DOI] [PMC free article] [PubMed] [Google Scholar]
- 8.Zurcher NR, Loggia ML, Lawson R, et al. Increased in vivo glial activation in patients with amyotrophic lateral sclerosis: assessed with [11C]-PBR28. Neuroimage Clin 2015;7:409–414. [DOI] [PMC free article] [PubMed] [Google Scholar]
- 9.Saberi S, Stauffer JE, Schulte DJ, Ravits J. Neuropathology of amyotrophic lateral sclerosis and its variants. Neurol Clin 2015;33:855–876. [DOI] [PMC free article] [PubMed] [Google Scholar]
- 10.Guo Q, Owen DR, Rabiner EA, Turkheimer FE, Gunn RN. A graphical method to compare the in vivo binding potential of PET radioligands in the absence of a reference region: application to [11C]PBR28 and [18F]PBR111 for TSPO imaging. J Cereb Blood Flow Metab 2014;34:1162–1168. [DOI] [PMC free article] [PubMed] [Google Scholar]
- 11.Brooks BR, Miller RG, Swash M, Munsat TL. World Federation of Neurology research group on motor neuron diseases: El Escorial revisited: revised criteria for the diagnosis of amyotrophic lateral sclerosis. Amyotroph Lateral Scler Other Motor Neuron Disord 2000;1:293–299. [DOI] [PubMed] [Google Scholar]
- 12.Cedarbaum JM, Stambler N, Malta E, et al. The ALSFRS-R: a revised ALS functional rating scale that incorporates assessments of respiratory function: BDNF ALS study group (phase III). J Neurol Sci 1999;169:13–21. [DOI] [PubMed] [Google Scholar]
- 13.Loggia ML, Chonde DB, Akeju O, et al. Evidence for brain glial activation in chronic pain patients. Brain 2015;138:604–615. [DOI] [PMC free article] [PubMed] [Google Scholar]
- 14.Jenkinson M, Beckmann CF, Behrens TE, Woolrich MW, Smith SM. FSL. Neuroimage 2012;62:782–790. [DOI] [PubMed] [Google Scholar]
- 15.Yendiki A, Koldewyn K, Kakunoori S, Kanwisher N, Fischl B. Spurious group differences due to head motion in a diffusion MRI study. Neuroimage 2013;88C:79–90. [DOI] [PMC free article] [PubMed] [Google Scholar]
- 16.Smith SM, Jenkinson M, Johansen-Berg H, et al. Tract-based spatial statistics: voxelwise analysis of multi-subject diffusion data. Neuroimage 2006;31:1487–1505. [DOI] [PubMed] [Google Scholar]
- 17.Nichols TE, Holmes AP. Nonparametric permutation tests for functional neuroimaging: a primer with examples. Hum Brain Mapp 2002;15:1–25. [DOI] [PMC free article] [PubMed] [Google Scholar]
- 18.Smith SM, Nichols TE. Threshold-free cluster enhancement: addressing problems of smoothing, threshold dependence and localisation in cluster inference. Neuroimage 2009;44:83–98. [DOI] [PubMed] [Google Scholar]
- 19.Wakana S, Jiang H, Nagae-Poetscher LM, Van Zijl PC, Mori S. Fiber tract–based atlas of human white matter anatomy 1. Radiology 2004;230:77–87. [DOI] [PubMed] [Google Scholar]
- 20.Dale AM, Fischl B, Sereno MI. Cortical surface-based analysis: I: segmentation and surface reconstruction. Neuroimage 1999;9:179–194. [DOI] [PubMed] [Google Scholar]
- 21.Behrens TE, Berg HJ, Jbabdi S, Rushworth MF, Woolrich MW. Probabilistic diffusion tractography with multiple fibre orientations: what can we gain? Neuroimage 2007;34:144–155. [DOI] [PMC free article] [PubMed] [Google Scholar]
- 22.Fischl B, van der Kouwe A, Destrieux C, et al. Automatically parcellating the human cerebral cortex. Cereb Cortex 2004;14:11–22. [DOI] [PubMed] [Google Scholar]
- 23.Dale AM, Fischl B, Sereno MI. Cortical surface-based analysis: I: segmentation and surface reconstruction. Neuroimage 1999;9:179–194. [DOI] [PubMed] [Google Scholar]
- 24.Kassubek J, Unrath A, Huppertz HJ, et al. Global brain atrophy and corticospinal tract alterations in ALS, as investigated by voxel-based morphometry of 3-D MRI. Amyotroph Lateral Scler Other Motor Neuron Disord 2005;6:213–220. [DOI] [PubMed] [Google Scholar]
- 25.Grossman M, Anderson C, Khan A, Avants B, Elman L, McCluskey L. Impaired action knowledge in amyotrophic lateral sclerosis. Neurology 2008;71:1396–1401. [DOI] [PMC free article] [PubMed] [Google Scholar]
- 26.Agosta F, Pagani E, Rocca MA, et al. Voxel-based morphometry study of brain volumetry and diffusivity in amyotrophic lateral sclerosis patients with mild disability. Hum Brain Mapp 2007;28:1430–1438. [DOI] [PMC free article] [PubMed] [Google Scholar]
- 27.Grosskreutz J, Kaufmann J, Fradrich J, Dengler R, Heinze HJ, Peschel T. Widespread sensorimotor and frontal cortical atrophy in amyotrophic lateral sclerosis. BMC Neurol 2006;6:17. [DOI] [PMC free article] [PubMed] [Google Scholar]
- 28.Bede P, Bokde A, Elamin M, et al. Grey matter correlates of clinical variables in amyotrophic lateral sclerosis (ALS): a neuroimaging study of ALS motor phenotype heterogeneity and cortical focality. J Neurol Neurosurg Psychiatry 2013;84:766–773. [DOI] [PubMed] [Google Scholar]
- 29.Chang JL, Lomen-Hoerth C, Murphy J, et al. A voxel-based morphometry study of patterns of brain atrophy in ALS and ALS/FTLD. Neurology 2005;65:75–80. [DOI] [PubMed] [Google Scholar]
- 30.Filippini N, Douaud G, Mackay CE, Knight S, Talbot K, Turner MR. Corpus callosum involvement is a consistent feature of amyotrophic lateral sclerosis. Neurology 2010;75:1645–1652. [DOI] [PMC free article] [PubMed] [Google Scholar]
- 31.Verstraete E, Veldink JH, Hendrikse J, Schelhaas HJ, van den Heuvel MP, van den Berg LH. Structural MRI reveals cortical thinning in amyotrophic lateral sclerosis. J Neurol Neurosurg Psychiatry 2012;83:383–388. [DOI] [PubMed] [Google Scholar]
- 32.Thivard L, Pradat PF, Lehericy S, et al. Diffusion tensor imaging and voxel based morphometry study in amyotrophic lateral sclerosis: relationships with motor disability. J Neurol Neurosurg Psychiatry 2007;78:889–892. [DOI] [PMC free article] [PubMed] [Google Scholar]
- 33.Bede P, Bokde AL, Byrne S, et al. Multiparametric MRI study of ALS stratified for the C9orf72 genotype. Neurology 2013;81:361–369. [DOI] [PMC free article] [PubMed] [Google Scholar]
- 34.Pyra T, Hui B, Hanstock C, et al. Combined structural and neurochemical evaluation of the corticospinal tract in amyotrophic lateral sclerosis. Amyotroph Lateral Scler 2010;11:157–165. [DOI] [PubMed] [Google Scholar]
- 35.Lombardo F, Frijia F, Bongioanni P, et al. Diffusion tensor MRI and MR spectroscopy in long lasting upper motor neuron involvement in amyotrophic lateral sclerosis. Arch Ital Biol 2009;147:69–82. [PubMed] [Google Scholar]
- 36.Rissanen E, Virta JR, Paavilainen T, et al. Adenosine A2A receptors in secondary progressive multiple sclerosis: a [(11)C]TMSX brain PET study. J Cereb Blood Flow Metab 2013;33:1394–1401. [DOI] [PMC free article] [PubMed] [Google Scholar]
- 37.Zhang J, Yin X, Zhao L, et al. Regional alterations in cortical thickness and white matter integrity in amyotrophic lateral sclerosis. J Neurol 2014;261:412–421. [DOI] [PubMed] [Google Scholar]
- 38.Lull ME, Block ML. Microglial activation and chronic neurodegeneration. Neurotherapeutics 2010;7:354–365. [DOI] [PMC free article] [PubMed] [Google Scholar]
- 39.Boillee S, Yamanaka K, Lobsiger CS, et al. Onset and progression in inherited ALS determined by motor neurons and microglia. Science 2006;312:1389–1392. [DOI] [PubMed] [Google Scholar]
- 40.Appel SH, Zhao W, Beers DR, Henkel JS. The microglial-motoneuron dialogue in ALS. Acta Myol 2011;30:4–8. [PMC free article] [PubMed] [Google Scholar]
Associated Data
This section collects any data citations, data availability statements, or supplementary materials included in this article.