Cardiac chemical exchange saturation transfer MR imaging enabled longitudinally noninvasive in vivo imaging of cell survival or rejection in preclinical models of cardiac cell therapy.
Abstract
Purpose
To examine whether cardiac chemical exchange saturation transfer (CEST) imaging can be serially and noninvasively used to probe cell survival or rejection after intramyocardial implantation in mice.
Materials and Methods
Experiments were compliant with the National Institutes of Health Guidelines on the Use of Laboratory Animals and approved by the Institutional Animal Care and Use Committee. One million C2C12 cells labeled with either europium (Eu) 10-(2-hydroxypropyl)-1,4,7-tetraazacyclododecane-1,4,7-triacetic acid (HP-DO3A) or saline via the hypotonic swelling technique were implanted into the anterior-lateral left ventricular wall in C57BL/6J (allogeneic model, n = 17) and C3H (syngeneic model, n = 13) mice. Imaging (frequency offsets of ±15 parts per million) was performed 1, 10, and 20 days after implantation, with the asymmetrical magnetization transfer ratio (MTRasym) calculated from image pairs. Histologic examination was performed at the conclusion of imaging. Changes in MTRasym over time and between mice were assessed by using two-way repeated-measures analysis of variance.
Results
MTRasym was significantly higher in C3H and C57BL/6J mice in grafts of Eu-HP-DO3A–labeled cells (40.2% ± 5.0 vs 37.8% ± 7.0, respectively) compared with surrounding tissue (−0.67% ± 1.7 vs −1.8% ± 5.3, respectively; P < .001) and saline-labeled grafts (−0.4% ± 6.0 vs −1.2% ± 3.6, respectively; P < .001) at day 1. In C3H mice, MTRasym remained increased (31.3% ± 9.2 on day 10, 28.7% ± 5.2 on day 20; P < .001 vs septum) in areas of in Eu-HP-DO3A–labeled cell grafts. In C57BL/6J mice, corresponding MTRasym values (11.3% ± 8.1 on day 10, 5.1% ± 9.4 on day 20; P < .001 vs day 1) were similar to surrounding myocardium by day 20 (P = .409). Histologic findings confirmed cell rejection in C57BL/6J mice. Estimation of graft area was similar with cardiac CEST imaging and histologic examination (R2 = 0.89).
Conclusion
Cardiac CEST imaging can be used to image cell survival and rejection in preclinical models of cell therapy.
© RSNA, 2016
Introduction
Over a decade of investigation into cardiac regeneration with cell therapy has demonstrated limited regenerative capacity due to low survival of injected cells (1). The inability to track in vivo cell fate, including survival or rejection without using ex vivo tissue staining, remains an obstacle to further progress, including the development of methods to enhance cell survival (2). Magnetic resonance (MR) imaging is used for in vivo imaging of infarct healing through characterization of cardiac structure, function, perfusion, and fibrosis (3). MR imaging cell tracking in cell therapy with iron oxide nanoparticle–labeled cells (4–7) has raised concerns of altered gene expression, tissue retention of particles after cell death, and difficulty in differentiating between labeled cells and tissue necrosis (2,8–13).
Chemical exchange saturation transfer (CEST) MR imaging is an emerging molecular imaging technique wherein the contrast (change in signal intensity) of either paramagnetic CEST agents (14,15) or CEST-active reporter genes (16–18) is selectively activated by using radiofrequency irradiation at target specific offset frequencies (19). Subsequently, paramagnetic CEST–labeled cells or CEST MR imaging reporter gene–expressing cells can be visualized without disruption of underlying MR image integrity. Prior CEST MR imaging studies have been conducted to track paramagnetic CEST–labeled cells in subcutaneous tumor models in mice (14,15) and image CEST reporter gene–expressing cells implanted in the rodent brain (16–18). While CEST MR imaging is suited for cell tracking in cardiac cell therapy, conventional CEST approaches are unsuitable for preclinical cardiac imaging and have been limited to stationary organs and the lungs (20). Recently, we designed a CEST MR imaging method specifically for preclinical cardiac imaging, termed cardiac CEST imaging (21,22) and demonstrated the ability to visualize paramagnetic CEST–labeled cells 24 hours after intramyocardial implantation (22).
In this study, we used two mouse models of cardiac cell therapy: one syngeneic model in which implanted cells derived from the same genetic strain of mice survive and proliferate over time (C3H genetic background) and one allogeneic model in which identical cells implanted into mice on a different genetic background (C57BL/6J) undergo complete rejection after implantation. We hypothesized that CEST contrast generated by paramagnetic CEST–labeled cells is preserved in surviving cell grafts and eliminated in instances of cell rejection. The purpose of this study was to examine whether cardiac CEST can serially and noninvasively be used to demonstrate cell survival or rejection after intramyocardial implantation in mice.
Materials and Methods
Cell Culture and Labeling
Immortalized mouse skeletal myoblasts (C2C12) were labeled with either europium (Eu) 10-(2-hydroxypropyl)-1,4,7-tetraazacyclododecane-1,4,7-triacetic acid (HP-DO3A, provided by Dr Silvio Aime at the University of Turin, Turin, Italy) or saline by using a hypotonic swelling technique (23). For control experiments, cells were exposed to hypotonic solution with saline substituted for Eu-HP-DO3A solution. Full details of cell culture and labeling can be found in Appendix E1 (online).
Cell Transplantation
Experiments were performed according to the National Institutes of Health Guidelines on the Use of Laboratory Animals and were approved by the Institutional Animal Care and Use Committee. Cardiac implantation of cells involved the use of the “pop-out” technique (24). Mice were anesthetized and maintained with 2% isoflurane in oxygen, the pectoral muscles were dissected at the fourth intercostal space, mosquito clamps were used to open the pleural membrane, and the heart was pressed toward the surface while maintaining pressure on the thorax. Approximately 106 cells in 10 μL were injected into the anterior-lateral left ventricular midwall by using a 27-gauge needle. Afterward, the heart was returned to the intrathoracic space, followed by evacuation of air and incision closure to prevent pneumothorax. The mice were removed from anesthesia and allowed to recover in room air.
Mouse Models
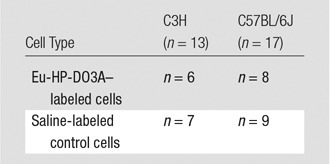
A total of 17 male C57BL/6J mice and 13 C3H mice (The Jackson Laboratory, Bar Harbor, Maine) were used. Mice from both genetic strains underwent transplantation of either cells labeled with Eu-HP-DO3A or saline-labeled control cells (Table). Imaging was performed 1 week before cell transplantation and 1, 10, and 20 days after cell transplantation, after which hearts were excised, sectioned, and stained by using hematoxylin-eosin. Separately, the cellular fraction of murine macrophages was quantified from tissue sections from C3H (n = 2) and C57BL/6J (n = 2) mice that received Eu-HP-DO3A–labeled cells via immunostaining (Appendix E1 [online]) with a rat antimouse F4/80 antibody (clone BM8, catalog no. 14–4801–85; eBioscience, San Diego, Calif). C2C12 cells are derived from C3H mice (syngeneic model) and will survive and proliferate after implantation in C3H mice but undergo rejection (allogeneic model) in C57BL/6J mice.
Sample Sizes for Four Experimental Cohorts Used in the Study
Imaging
Imaging was performed with a 7-T horizontal imaging unit (ClinScan; Bruker Biospin MR Imaging, Ettlingen, Germany) by using a cylindrical volume coil for excitation (outer diameter, 11.2 cm; inner diameter, 8.6 cm) and a four-channel phased-array surface coil for detection. Anesthesia involved the use of 1.5% isoflurane in oxygen, and body temperature was maintained (at 37°C) by using circulating water. Electrocardiographic and respiratory gating was performed with a Small Animal Instruments system (SAI, Stonybrook, NY). The site of cell injection was identified 1 day after implantation as areas of disrupted pericardium on long-axis images. For subsequent imaging, the same section location was identified by using the distance from the left ventricular apex and anatomic features, including papillary muscles. To further ensure that data were repeatedly acquired in the same section location, pairs of cardiac CEST images were acquired in two to three sections around the initial site. Briefly, the cardiac CEST pulse sequence uses a constant repetition time gradient-echo readout to drive initial CEST weighting into the steady-state longitudinal magnetization of the myocardium (22). The acquisition of cine images is electrocardiographically and respiratory gated, with dummy excitation pulses maintaining steady-state conditions. This strategy enables reliable CEST imaging of the rapidly beating mouse heart in the presence of free breathing. Imaging parameters included field of view, 2.56 × 2.56 cm; matrix, 256 × 128; true in-plane resolution, 200 × 100 μm; section thickness, 1 mm; repetition time (msec)/echo time (msec), 6.92/3.42; four signals acquired; and 15° flip angle. For CEST saturation, a train of spatially nonselective Gaussian pulses (8.8 msec; 200-Hz bandwidth; 1-msec interpulse delay; number of pulses, 196; flip angle, 720°; and mean induced transverse magnetic field, or B1, 14 μT) was applied at offset frequencies of ±15 parts per million (ppm). The total acquisition time was 2.5–3.0 minutes per cine image or 5–6 minutes per pair.
Data Analysis
Data analysis was performed in Matlab version R2012b (The MathWorks, Natick, Mass) by using custom-built software. For each mouse and time point, one section was selected from acquired data to ensure consistent section position across time points. The end-diastolic image acquired after saturation at 15 ppm was registered to the corresponding image acquired after saturation at −15 ppm. Maps of the asymmetrical magnetization transfer ratio (MTRasym) were then calculated on a voxelwise basis as MTRasym = [(S-15 ppm – S15 ppm)/S-15 ppm] · 100. Maps of MTRasym are processed such that only voxels from the left ventricle are superimposed on corresponding magnitude reconstructed images. On the basis of our previous findings, regions of interest that encompassed the cell graft were defined on day 1 by using a threshold MTRasym value of up to 15% for mice that received Eu-HP-DO3A–labeled cells (22). At subsequent time points, the same regions of interest were applied by using anatomic details, such as papillary muscles and polar distance from right ventricular insertion points, to guide placement. For mice that received saline-labeled cells, a region of interest was defined retrospectively on the appropriate section on the basis of histologic identification of the cell graft for C3H mice and the identification of the injection site for C57BL/6J mice. Finally, in all mice, an internal control measurement was obtained in the interventricular septum on the section that contained injected cells.
Estimation of Graft Size
Cardiac CEST measurement of graft size was performed on data acquired 20 days after implantation of Eu-HP-DO3A–labeled cells. On the basis of our prior findings of appropriate threshold values for identifying cell grafts, an MTRasym threshold of up to 15% was used to calculate graft size as a percentage of total myocardial area (22). Corresponding measures from hematoxylin-eosin–stained tissue sections were calculated by manually contouring blue-stained graft tissue and were expressed as a percentage of total myocardial area.
Statistics
Statistical analysis was performed with SigmaPlot version 13 software (Systat Software, San Jose, Calif). Comparison of MTRasym values between Eu-HP-DO3A–labeled cell grafts, septal regions, and saline-labeled cell grafts and values over time was performed by using two-way repeated-measures analysis of variance, with pairwise comparisons made by using the Holm-Sidak method, which was also used for comparison of MTRasym values over time in Eu-HP-DO3A–labeled cell grafts between C3H and C57BL/6J mice. The Student t test was used to compare MTRasym measurements prior to cell implantation and to compare quantification of graft size according to histologic findings. The association of graft size between MR imaging and histologic findings was examined by using Bland-Altman analysis. A Shapiro-Wilk test was used to confirm the normal distribution of all data. A P value of less than .05 was used to indicate a significant difference.
Results
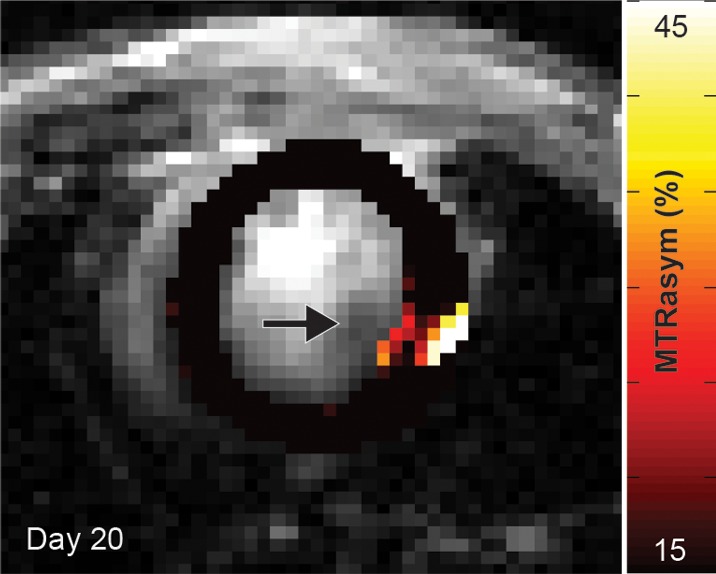
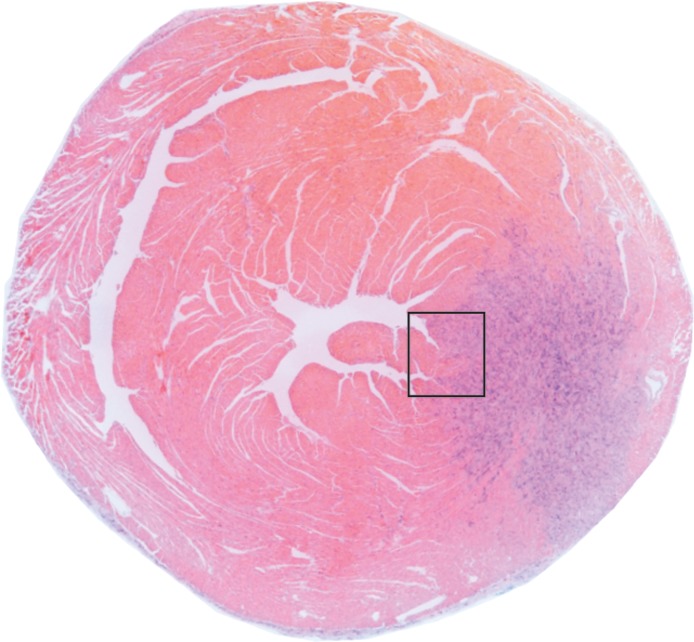
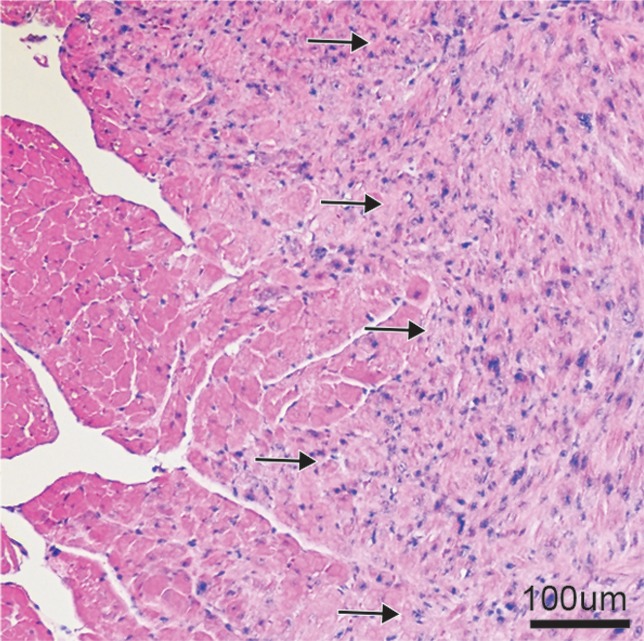
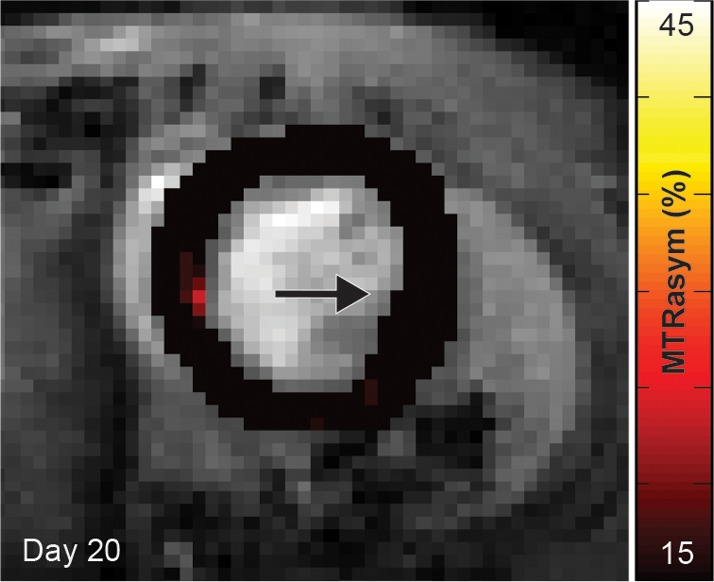
CEST imaging of the heart with the parameters selected for this study yielded a mean signal-to-noise ratio ± standard deviation of 19.8 arbitrary units (a.u.) ± 4.1 and contrast-to-noise ratios of 7.3 a.u. ± 2.9 and 7.3 a.u. ± 5.6 between myocardium and blood or lung, respectively. The mean MTRasym values measured in the anterior-lateral wall (−0.3% ± 1.9 for C3H vs −1.5% ± 1.1 for C57BL/6J, P = .608) and in the septum (1.8% ± 2.2 for C3H vs 0.6% ± 1.1 for C57BL/6J, P = .595) prior to cell transplantation were similar in C3H (n = 7) and C57BL/6J (n = 5) mice (representative images are shown in Fig E1 [online]). The mean heart rates during the study time course were 499 beats per minute ± 76 and 513 beats per minute ± 63 for C3H and C57BL/6J mice, respectively. Repeated imaging of C3H mice in which implanted C2C12 cells survived demonstrated significantly increased MTRasym values in grafts of Eu-HP-DO3A–labeled cells compared with surrounding myocardium. Representative MTRasym maps acquired 1 and 20 days after implantation and corresponding histologic images (Fig 1) demonstrate the capacity to identify surviving Eu-HP-DO3A–labeled cells on the basis of increased CEST contrast at 15 ppm. Identical imaging of C57BL/6J mice, in which implanted cells underwent rejection, demonstrated increased MTRasym values in the area of implanted Eu-HP-DO3A–labeled cells 24 hours after implantation (Fig 2). However, rejection of labeled cells and clearance of Eu-HP-DO3A eliminated the previously observed CEST contrast in areas of implanted cells within 20 days and was confirmed at histologic examination (Fig E2 [online]). In both C3H and C57BL/6J mice, the implantation of saline-labeled (control) C2C12 cells did not result in any change in CEST contrast in areas of either surviving cells or rejected cells (Fig E3 [online]).
Figure 1a:
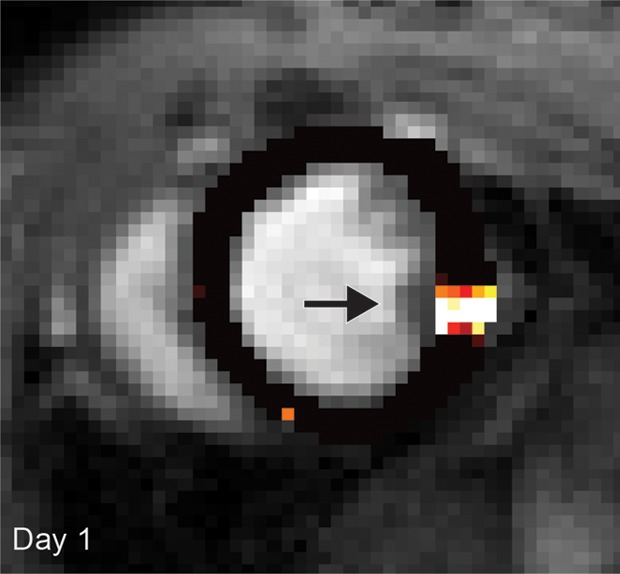
(a, b) Longitudinal cardiac CEST images of the survival of Eu-HP-DO3A–labeled cells in C3H mice. Twenty-four hours after implantation (a), significantly increased MTRasym values were observed adjacent to the inferior papillary muscle (arrow), corresponding to the location of Eu-HP-DO3A–labeled cells. After 20 days (b), increased MTRasym was still observed in the same myocardial region surrounding the inferior papillary muscle (arrow). The proliferation of labeled cells and the likely dilution of Eu-HP-DO3A with cell division reduced the MTRasym values of the graft relative to day 1. (c) Photomicrograph (hematoxylin-eosin stain; original magnification, ×4) of the corresponding histologic slice demonstrates a graft of proliferating cells (blue) adjacent to the inferior papillary muscle in a similar location to increased MTRasym values seen on b. (d) Higher magnification photomicrograph (hematoxylin-eosin stain; original magnification, ×20) of the area on c enclosed within the black box demonstrates the presence of proliferating cells (arrows) near the endocardial surface at the boundary of the papillary muscle.
Figure 2a:
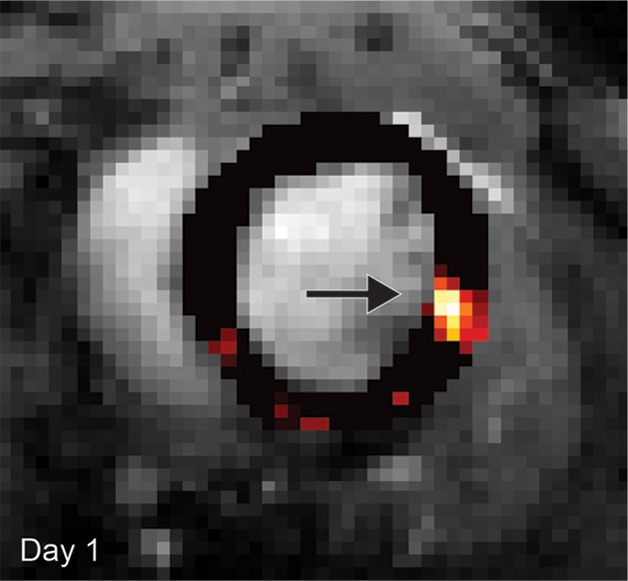
Cardiac CEST images show how the rejection of implanted Eu-HP-DO3A–labeled cells in C57BL/6J mice leads to elimination of initial CEST contrast. (a) Implantation of Eu-HP-DO3A–labeled cells in a representative C57BL/6J mouse resulted in increased MTRasym values in the lateral ventricular wall in close proximity to the inferior papillary muscle 24 hours after implantation (arrow), similar to that observed in C3H mice. (b) However, at 20 days after implantation, MTRasym values in the same myocardial region (arrow) decreased and were indistinguishable from surrounding myocardium.
Figure 1b:
(a, b) Longitudinal cardiac CEST images of the survival of Eu-HP-DO3A–labeled cells in C3H mice. Twenty-four hours after implantation (a), significantly increased MTRasym values were observed adjacent to the inferior papillary muscle (arrow), corresponding to the location of Eu-HP-DO3A–labeled cells. After 20 days (b), increased MTRasym was still observed in the same myocardial region surrounding the inferior papillary muscle (arrow). The proliferation of labeled cells and the likely dilution of Eu-HP-DO3A with cell division reduced the MTRasym values of the graft relative to day 1. (c) Photomicrograph (hematoxylin-eosin stain; original magnification, ×4) of the corresponding histologic slice demonstrates a graft of proliferating cells (blue) adjacent to the inferior papillary muscle in a similar location to increased MTRasym values seen on b. (d) Higher magnification photomicrograph (hematoxylin-eosin stain; original magnification, ×20) of the area on c enclosed within the black box demonstrates the presence of proliferating cells (arrows) near the endocardial surface at the boundary of the papillary muscle.
Figure 1c:
(a, b) Longitudinal cardiac CEST images of the survival of Eu-HP-DO3A–labeled cells in C3H mice. Twenty-four hours after implantation (a), significantly increased MTRasym values were observed adjacent to the inferior papillary muscle (arrow), corresponding to the location of Eu-HP-DO3A–labeled cells. After 20 days (b), increased MTRasym was still observed in the same myocardial region surrounding the inferior papillary muscle (arrow). The proliferation of labeled cells and the likely dilution of Eu-HP-DO3A with cell division reduced the MTRasym values of the graft relative to day 1. (c) Photomicrograph (hematoxylin-eosin stain; original magnification, ×4) of the corresponding histologic slice demonstrates a graft of proliferating cells (blue) adjacent to the inferior papillary muscle in a similar location to increased MTRasym values seen on b. (d) Higher magnification photomicrograph (hematoxylin-eosin stain; original magnification, ×20) of the area on c enclosed within the black box demonstrates the presence of proliferating cells (arrows) near the endocardial surface at the boundary of the papillary muscle.
Figure 1d:
(a, b) Longitudinal cardiac CEST images of the survival of Eu-HP-DO3A–labeled cells in C3H mice. Twenty-four hours after implantation (a), significantly increased MTRasym values were observed adjacent to the inferior papillary muscle (arrow), corresponding to the location of Eu-HP-DO3A–labeled cells. After 20 days (b), increased MTRasym was still observed in the same myocardial region surrounding the inferior papillary muscle (arrow). The proliferation of labeled cells and the likely dilution of Eu-HP-DO3A with cell division reduced the MTRasym values of the graft relative to day 1. (c) Photomicrograph (hematoxylin-eosin stain; original magnification, ×4) of the corresponding histologic slice demonstrates a graft of proliferating cells (blue) adjacent to the inferior papillary muscle in a similar location to increased MTRasym values seen on b. (d) Higher magnification photomicrograph (hematoxylin-eosin stain; original magnification, ×20) of the area on c enclosed within the black box demonstrates the presence of proliferating cells (arrows) near the endocardial surface at the boundary of the papillary muscle.
Figure 2b:
Cardiac CEST images show how the rejection of implanted Eu-HP-DO3A–labeled cells in C57BL/6J mice leads to elimination of initial CEST contrast. (a) Implantation of Eu-HP-DO3A–labeled cells in a representative C57BL/6J mouse resulted in increased MTRasym values in the lateral ventricular wall in close proximity to the inferior papillary muscle 24 hours after implantation (arrow), similar to that observed in C3H mice. (b) However, at 20 days after implantation, MTRasym values in the same myocardial region (arrow) decreased and were indistinguishable from surrounding myocardium.
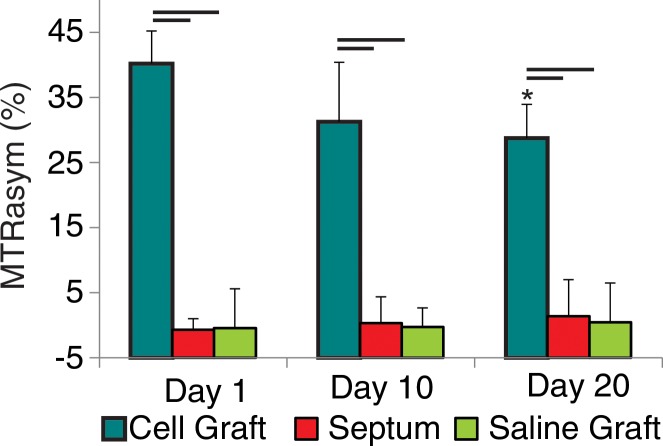
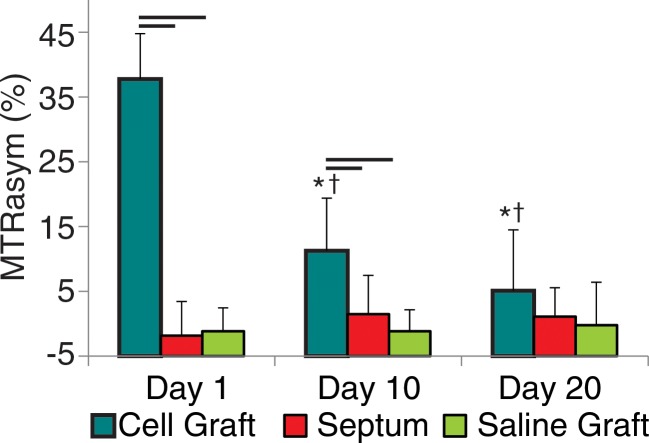
Repeated measurement of MTRasym in areas of implanted cells and internal septal control regions demonstrated different patterns for surviving cells when compared with cells undergoing rejection (Fig 3). In C3H mice, the CEST contrast in tissue regions containing Eu-HP-DO3A–labeled cells remained significantly increased throughout the time course of examination in comparison to internal control regions of interest in the septum and in comparison to regions of interest that contained implanted saline-labeled cells in genetically identical mice (Fig 3). Within regions of Eu-HP-DO3A–labeled cells, MTRasym values declined gradually after implantation and were significantly reduced by 20 days after implantation compared with initial measurements (Fig 3). In C57BL/6J mice, CEST contrast was significantly increased within grafts of Eu-HP-DO3A–labeled cells 1 day after implantation when compared with septal regions of interest and saline-labeled cell grafts (Fig 3). However, MTRasym values within regions of labeled cell grafts decreased significantly within 10 days of implantation. By 20 days after implantation, MTRasym values were indistinguishable from either surrounding myocardium (P = .409) or saline-labeled control animals (P = .254). MTRasym values within Eu-HP-DO3A–labeled cell grafts were statistically similar (P = .564) in C3H and C57BL/6J mice 1 day after implantation but were significantly (P < .001) lower in C57BL/6J mice 10 and 20 days after implantation (Fig 3).
Figure 3a:
Bar graphs illustrate the measurement of MTRasym, which allows differentiation of (a) cell survival from (b) cell rejection. In C3H mice (a), MTRasym values in the region that contains Eu-HP-DO3A–labeled cells (cell graft) were significantly higher compared with septal regions (septum) in the same hearts and compared with corresponding regions after implantation of saline-labeled control cells (saline graft) in genetically identical mice at all measured time points. By 20 days after implantation, the mean MTRasym values in cell grafts were significantly lower when compared with values 1 day after implantation. In C57BL/6J mice (b), MTRasym values were increased 1 day after implantation in areas of Eu-HP-DO3A–labeled cells when compared with septal regions and saline-labeled controls and remained significantly increased 10 days after implantation but were similar 20 days after implantation. By 10 days, MTRasym values in the region of implanted Eu-HP-DO3A–labeled cells were significantly reduced compared with both the initial values 1 day after implantation and the corresponding values in C3H mice at identical time points. Bars represent P values less than .05 at identical time points. * = P < .05 versus day 1 in the same region, † = P < .05 versus cell graft in C3H mice at the same time point.
Figure 3b:
Bar graphs illustrate the measurement of MTRasym, which allows differentiation of (a) cell survival from (b) cell rejection. In C3H mice (a), MTRasym values in the region that contains Eu-HP-DO3A–labeled cells (cell graft) were significantly higher compared with septal regions (septum) in the same hearts and compared with corresponding regions after implantation of saline-labeled control cells (saline graft) in genetically identical mice at all measured time points. By 20 days after implantation, the mean MTRasym values in cell grafts were significantly lower when compared with values 1 day after implantation. In C57BL/6J mice (b), MTRasym values were increased 1 day after implantation in areas of Eu-HP-DO3A–labeled cells when compared with septal regions and saline-labeled controls and remained significantly increased 10 days after implantation but were similar 20 days after implantation. By 10 days, MTRasym values in the region of implanted Eu-HP-DO3A–labeled cells were significantly reduced compared with both the initial values 1 day after implantation and the corresponding values in C3H mice at identical time points. Bars represent P values less than .05 at identical time points. * = P < .05 versus day 1 in the same region, † = P < .05 versus cell graft in C3H mice at the same time point.
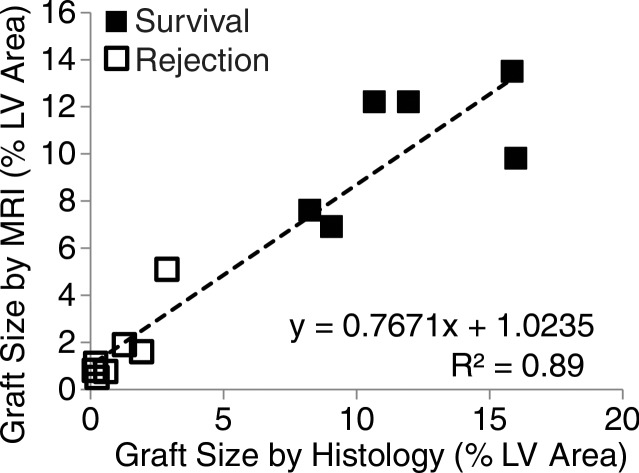
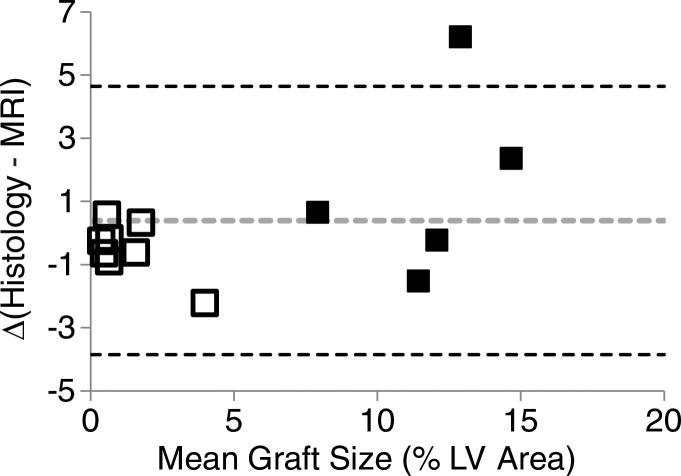
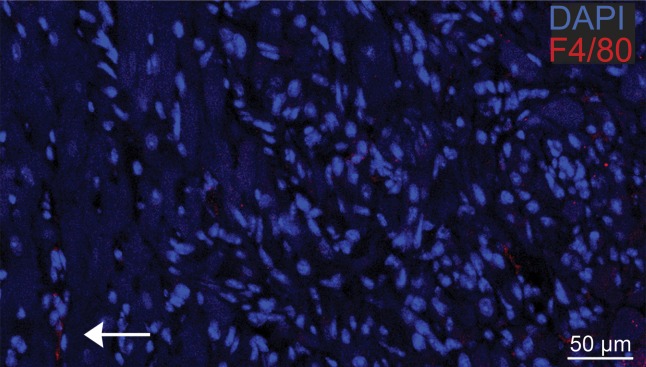
The survival or rejection of C2C12 cell grafts was confirmed by hematoxylin-eosin staining and assessed as the percentage of total left ventricular myocardial area. In C3H mice, surviving C2C12 cells resulted in similar graft sizes in Eu-HP-DO3A and saline-labeled cell grafts (12.0% ± 3.3 for Eu-HP-DO3A vs 12.9% ± 9.3 for saline, P = .825). The rejection of C2C12 cell grafts in C57BL/6J mice was similar for both Eu-HP-DO3A and saline-labeled cells (1.0% ± 1.0 for Eu-HP-DO3A vs 0.7% ± 0.5 for unlabeled cells, P = .409). Assessment of Eu-HP-DO3A–labeled graft size was similar between cardiac CEST imaging and histologic examination for most grafts but was underestimated by using MR imaging for grafts larger than 12% of ventricular mass (Fig 4). The coefficient of variation in calculation of graft size was 17%. Staining of isolated tissue sections for murine macrophages (Fig 5) demonstrated that F4/80-positive macrophages accounted for 1.2% ± 0.3 and 0.9% ± 0.1 of the cells in the graft regions for C3H and C57BL/6J mice, respectively.
Figure 4a:
Plots show the comparison of graft size according to cardiac CEST imaging and histologic findings. (a) The quantification of graft size measured as a percentage of left ventricular (LV) myocardial area according to cardiac CEST imaging across all mice in which Eu-HP-DO3A cells were implanted demonstrated association with corresponding histologic measurements. (b) Bland-Altman analysis demonstrated close agreement in graft size, with slight underestimation of graft size according to MR imaging in grafts larger than 12% of left ventricular area.
Figure 5a:
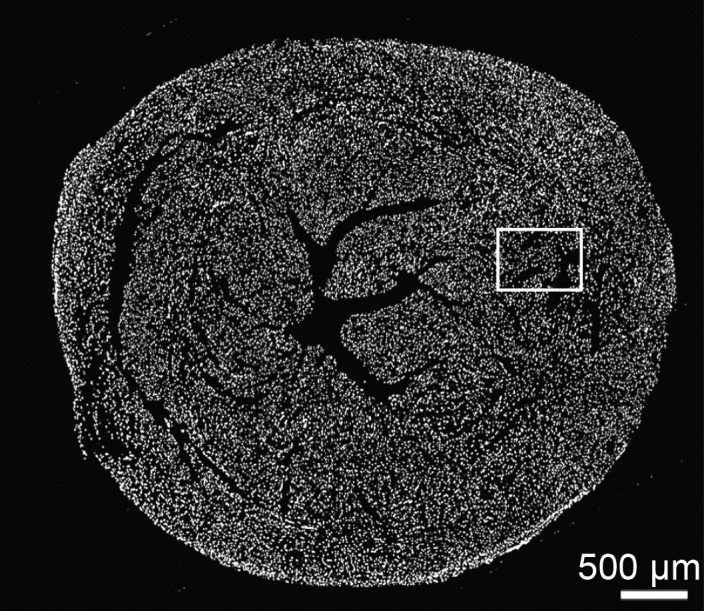
Photomicrographs show macrophage staining in C3H cardiac tissue. (a) Nuclear staining (4ʹ6-diamidino-2-phenylindole·2HCl, or DAPI; original magnification, ×40 composite) of a cross-section of cardiac tissue from a mouse that underwent implantation of Eu-HP-DO3A–labeled C2C12 cells. (b) Photomicrograph with higher magnification of a region of interest within the cell graft (original magnification, ×400 composite) is shown after immunostaining for murine macrophages (F4/80, red) and cell nuclei (DAPI, blue). Murine macrophages (arrow) were not present in high numbers in C3H cardiac tissue 20 days after cell implantation. Corresponding images from a C57BL/6J mouse are found in Figure E4 (online).
Figure 4b:
Plots show the comparison of graft size according to cardiac CEST imaging and histologic findings. (a) The quantification of graft size measured as a percentage of left ventricular (LV) myocardial area according to cardiac CEST imaging across all mice in which Eu-HP-DO3A cells were implanted demonstrated association with corresponding histologic measurements. (b) Bland-Altman analysis demonstrated close agreement in graft size, with slight underestimation of graft size according to MR imaging in grafts larger than 12% of left ventricular area.
Figure 5b:
Photomicrographs show macrophage staining in C3H cardiac tissue. (a) Nuclear staining (4ʹ6-diamidino-2-phenylindole·2HCl, or DAPI; original magnification, ×40 composite) of a cross-section of cardiac tissue from a mouse that underwent implantation of Eu-HP-DO3A–labeled C2C12 cells. (b) Photomicrograph with higher magnification of a region of interest within the cell graft (original magnification, ×400 composite) is shown after immunostaining for murine macrophages (F4/80, red) and cell nuclei (DAPI, blue). Murine macrophages (arrow) were not present in high numbers in C3H cardiac tissue 20 days after cell implantation. Corresponding images from a C57BL/6J mouse are found in Figure E4 (online).
Discussion
The results of this study demonstrate the application of cardiac CEST MR imaging for serial tracking of cell survival or rejection after cardiac transplantation. In both models, grafts of viable Eu-HP-DO3A–labeled cells were clearly distinguishable from surrounding myocardium immediately after implantation. The implantation of saline-labeled cells as controls resulted in no changes in MTRasym values, regardless of cell fate and time. While tissues that contained surviving Eu-HP-DO3A–labeled cells demonstrated preserved CEST contrast for 20 days, the rejection of identical cells led to immediate reductions in MTRasym by 10 days after implantation and complete loss of CEST contrast within 20 days. Finally, assessment of graft size by applying a threshold MTRasym value was similar to that measured at histologic examination.
Myocardial implantation of C2C12 cells is an established cardiac cell therapy model for evaluating MR imaging cell-tracking techniques (13,25,26). In a prior study, transgenic ferritin heavy-chain overexpressing C2C12 cells implanted into the hearts of C3H mice were visualized by using T2*-weighted MR imaging 3 weeks after implantation (25). We observed similar engraftment of C2C12 cells in C3H mice by 20 days after implantation. Importantly, labeling of C2C12 cells with Eu-HP-DO3A generated robust CEST contrast at the time of implantation that was preserved throughout the course of our study and did not affect the growth rate of C2C12 grafts. By 20 days after implantation, the moderate reduction in MTRasym values in Eu-HP-DO3A–labeled grafts likely resulted from dilution of label with cell division, which presents a boundary condition for the detection of surviving cells. In our study, we did not observe an eventual loss of CEST contrast; however, we were unable to perform continued examination beyond 20 days after implantation owing to an increase in arrhythmias and death caused by the growth of C2C12 grafts.
MR imaging tracking of cells after cardiac transplantation was previously widely explored via iron oxide nanoparticle labeling; however, tissue retention of nanoparticles for up to 6 weeks after the death of labeled cells results in inaccurate detection of cell survival (2,8–13). In this study, the rejection of Eu-HP-DO3A–labeled C2C12 cells in C57BL/6J mice resulted in rapid loss of CEST contrast. The clearance of Eu-HP-DO3A from myocardium after intravenous injection was previously demonstrated by using dynamic measurement of cardiac MTRasym for 30 minutes after injection (21). In Eu-HP-DO3A–labeled cells undergoing rejection, Eu-HP-DO3A that is released after cell rupture is likely cleared through mechanisms similar to those observed previously. However, in this study, we did not examine whether removal of Eu-HP-DO3A by means of inflammatory mechanisms contributes to MTRasym normalization after rejection. Importantly, given renewed concerns about the accumulation of gadolinium in regions of the brain, even in individuals with preserved renal function (27,28), further studies are necessary to understand clearance of paramagnetic CEST agents after cell death.
The implantation of C2C12 cells in C3H and C57BL/6J mice models the two extreme outcomes of cell therapy: high survival with rapid proliferation that borders on teratoma formation (C3H) and complete rejection of implanted cells (C57BL/6J). With existing cell therapy approaches, near-complete rejection of implanted cells is typically observed, similar to that observed in our C57BL/6J model, with an ultimate goal of increasing cell survival in the direction observed in our C3H model. A number of combined therapeutic approaches are under investigation, including incorporation of biomaterials (29), combined cell and gene therapy (30), and pharmacologic stimulation to enhance recruitment of native mesenchymal cells (31). The ability to noninvasively monitor the success of secondary interventions in promoting increased cell survival will be crucial in pushing forward the next generation of cell therapy approaches. While we accurately quantified the rejection of Eu-HP-DO3A–labeled cells in C57BL/6J mice, the sensitivity limits of cardiac CEST need to be investigated further.
The use of lanthanide (Ln)-based paramagnetic CEST agents (Ln-HP-DO3A) represents a potential translational limitation, given renewed concern surrounding similarly formulated gadolinium-based contrast agents. While the concentration of chelated lanthanide metals is as high as 3–5 mmol/L in cells after hypotonic swelling (22), even the immediate release of all intracellular Ln-HP-DO3A into the blood pool would result in concentrations that are orders of magnitude lower than those that occur after intravenous injection of similar contrast agents as part of routine MR imaging examination (Appendix E1 [online]). Further study is warranted as to whether labeling of cells with paramagnetic CEST agents induces changes in gene expression similar to those observed with iron oxide–based agents. However, emerging CEST MR imaging labels, including CEST-active reporter genes (16,18,32) and engineered nonmetallic CEST macromolecules (33,34), could be used in place of lanthanide metal-based labels. A secondary limitation to our study is the use of high radiofrequency saturation power to generate CEST contrast that would not be possible in clinical settings. While this may present an immediate obstacle, further development of continuous wave approaches by using multichannel parallel transmit and receive technology will enable substantial reductions in required saturation energy. Finally, confining CEST imaging and histologic analysis to a limited number of sections limited the ability to obtain volumetric information about graft size. A more thorough validation of graft size measurement should be performed in a future study by comparing whole-heart cardiac CEST imaging to whole-heart histologic findings.
In conclusion, cardiac CEST cell tracking can serve as a tool for preclinical research of emerging methods to enhance the survival of implanted stem cells. Since CEST contrast is selectively activated, the combined use of CEST-active biomaterials (33), CEST MR imaging reporter genes (16,18,32), and multiagent paramagnetic CEST labeling of different cell populations (15) has the potential to demonstrate multiple processes that drive cell fate decisions in regenerative therapy.
Advances in Knowledge
■ Cardiac chemical exchange saturation transfer (CEST) MR imaging can be used to serially image the fate of implanted cells in preclinical models of cell therapy.
■ CEST contrast (change in signal intensity), measured as the asymmetrical magnetization transfer ratio, is preserved in surviving paramagnetic CEST-labeled cells for 20 days after cardiac implantation in C3H mice (28.75 ± 5.2 for cell graft vs 1.4% ± 5.6 for septum, P < .001).
■ CEST contrast is eliminated in rejected paramagnetic CEST-labeled cells within 20 days after implantation in C57BL/6J mice (5.1% ± 9.4 for cell graft vs 1.1% ± 4.5 for septum, P = .41).
■ Measurement of CEST contrast can be used to differentiate surviving cells from those undergoing rejection as early as 10 days after implantation (31.3% ± 9.2 for surviving cells vs 11.3% ± 8.1 for cell rejection, P < .001).
■ Assessment of graft size at cardiac CEST MR imaging demonstrates a positive association with graft size according to histologic findings (R2 = 0.89, covariance = 17%).
APPENDIX
SUPPLEMENTAL FIGURES
Received December 15, 2015; revision requested February 8, 2016; revision received April 14; accepted May 12; final version accepted May 24.
Study supported by the National Institutes of Health (P20GM103527sub5039, R01HL128592). M.H.V. supported by a grant from the Slomo and Cindy Silvian Foundation.
Disclosures of Conflicts of Interest: A.L.P. disclosed no relevant relationships. S.Y. disclosed no relevant relationships. Z.Y. disclosed no relevant relationships. J.S. disclosed no relevant relationships. J.C.G. disclosed no relevant relationships. A.A.L. disclosed no relevant relationships. M.H.V. disclosed no relevant relationships.
Abbreviations:
- CEST
- chemical exchange saturation transfer
- HP-DO3A
- 10-(2-hydroxypropyl)-1,4,7-tetraazacyclododecane-1,4,7-triacetic acid
- MTRasym
- asymmetrical magnetization transfer ratio
References
- 1.Karantalis V, Hare JM. Use of mesenchymal stem cells for therapy of cardiac disease. Circ Res 2015;116(8):1413–1430. [DOI] [PMC free article] [PubMed] [Google Scholar]
- 2.Wu JC. Molecular imaging: antidote to cardiac stem cell controversy. J Am Coll Cardiol 2008;52(20):1661–1664. [DOI] [PubMed] [Google Scholar]
- 3.Pennell DJ. Cardiovascular magnetic resonance. Circulation 2010;121(5):692–705. [DOI] [PubMed] [Google Scholar]
- 4.Frank JA, Miller BR, Arbab AS, et al. Clinically applicable labeling of mammalian and stem cells by combining superparamagnetic iron oxides and transfection agents. Radiology 2003;228(2):480–487. [DOI] [PubMed] [Google Scholar]
- 5.Hill JM, Dick AJ, Raman VK, et al. Serial cardiac magnetic resonance imaging of injected mesenchymal stem cells. Circulation 2003;108(8):1009–1014. [DOI] [PMC free article] [PubMed] [Google Scholar]
- 6.Kraitchman DL, Bulte JW. Imaging of stem cells using MRI. Basic Res Cardiol 2008;103(2):105–113. [DOI] [PMC free article] [PubMed] [Google Scholar]
- 7.Kraitchman D, Kedziorek D, Bulte JM. MR imaging of transplanted stem cells in myocardial infarction. In: Shah K, ed. Molecular imaging. Totowa, NJ: Humana, 2011; 141–152. [DOI] [PMC free article] [PubMed] [Google Scholar]
- 8.Amsalem Y, Mardor Y, Feinberg MS, et al. Iron-oxide labeling and outcome of transplanted mesenchymal stem cells in the infarcted myocardium. Circulation 2007;116(11 Suppl):I38–I45. [DOI] [PubMed] [Google Scholar]
- 9.Higuchi T, Anton M, Dumler K, et al. Combined reporter gene PET and iron oxide MRI for monitoring survival and localization of transplanted cells in the rat heart. J Nucl Med 2009;50(7):1088–1094. [DOI] [PubMed] [Google Scholar]
- 10.Terrovitis J, Stuber M, Youssef A, et al. Magnetic resonance imaging overestimates ferumoxide-labeled stem cell survival after transplantation in the heart. Circulation 2008;117(12):1555–1562. [DOI] [PubMed] [Google Scholar]
- 11.Winter EM, Hogers B, van der Graaf LM, Gittenberger-de Groot AC, Poelmann RE, van der Weerd L. Cell tracking using iron oxide fails to distinguish dead from living transplanted cells in the infarcted heart. Magn Reson Med 2010;63(3):817–821. [DOI] [PubMed] [Google Scholar]
- 12.Zhang WY, Ebert AD, Narula J, Wu JC. Imaging cardiac stem cell therapy: translations to human clinical studies. J Cardiovasc Transl Res 2011;4(4):514–522. [DOI] [PMC free article] [PubMed] [Google Scholar]
- 13.Naumova AV, Balu N, Yarnykh VL, Reinecke H, Murry CE, Yuan C. Magnetic resonance imaging tracking of graft survival in the infarcted heart: iron oxide particles versus ferritin overexpression approach. J Cardiovasc Pharmacol Ther 2014;19(4):358–367. [DOI] [PMC free article] [PubMed] [Google Scholar]
- 14.Aime S, Carrera C, Delli Castelli D, Geninatti Crich S, Terreno E. Tunable imaging of cells labeled with MRI-PARACEST agents. Angew Chem Int Ed Engl 2005;44(12):1813–1815. [DOI] [PubMed] [Google Scholar]
- 15.Ferrauto G, Delli Castelli D, Terreno E, Aime S. In vivo MRI visualization of different cell populations labeled with PARACEST agents. Magn Reson Med 2013;69(6):1703–1711. [DOI] [PubMed] [Google Scholar]
- 16.Bar-Shir A, Liu G, Chan KW, et al. Human protamine-1 as an MRI reporter gene based on chemical exchange. ACS Chem Biol 2014;9(1):134–138. [DOI] [PMC free article] [PubMed] [Google Scholar]
- 17.Bar-Shir A, Liu G, Liang Y, et al. Transforming thymidine into a magnetic resonance imaging probe for monitoring gene expression. J Am Chem Soc 2013;135(4):1617–1624. [DOI] [PMC free article] [PubMed] [Google Scholar]
- 18.Gilad AA, McMahon MT, Walczak P, et al. Artificial reporter gene providing MRI contrast based on proton exchange. Nat Biotechnol 2007;25(2):217–219. [DOI] [PubMed] [Google Scholar]
- 19.Ward KM, Aletras AH, Balaban RS. A new class of contrast agents for MRI based on proton chemical exchange dependent saturation transfer (CEST). J Magn Reson 2000;143(1):79–87. [DOI] [PubMed] [Google Scholar]
- 20.Jones KM, Randtke EA, Howison CM, et al. Measuring extracellular pH in a lung fibrosis model with acidoCEST MRI. Mol Imaging Biol 2015;17(2):177–184. [DOI] [PMC free article] [PubMed] [Google Scholar]
- 21.Vandsburger M, Vandoorne K, Oren R, et al. Cardio-chemical exchange saturation transfer magnetic resonance imaging reveals molecular signatures of endogenous fibrosis and exogenous contrast media. Circ Cardiovasc Imaging 2014;8(1):e002180. [DOI] [PubMed] [Google Scholar]
- 22.Pumphrey A, Yang Z, Ye S, et al. Advanced cardiac chemical exchange saturation transfer (cardioCEST) MRI for in vivo cell tracking and metabolic imaging. NMR Biomed 2016;29(1):74–83. [DOI] [PMC free article] [PubMed] [Google Scholar]
- 23.Di Gregorio E, Ferrauto G, Gianolio E, Aime S. Gd loading by hypotonic swelling: an efficient and safe route for cellular labeling. Contrast Media Mol Imaging 2013;8(6):475–486. [DOI] [PubMed] [Google Scholar]
- 24.Gao E, Koch W. A novel and efficient model of coronary artery ligation in the mouse. In: Gourdie RG, Myers TA, eds. Wound regeneration and repair. Totowa, NJ: Humana, 2013; 299–311. [DOI] [PubMed] [Google Scholar]
- 25.Naumova AV, Reinecke H, Yarnykh V, Deem J, Yuan C, Murry CE. Ferritin overexpression for noninvasive magnetic resonance imaging–based tracking of stem cells transplanted into the heart. Mol Imaging 2010;9(4):201–210. [PMC free article] [PubMed] [Google Scholar]
- 26.Naumova AV, Yarnykh VL, Balu N, Reinecke H, Murry CE, Yuan C. Quantification of MRI signal of transgenic grafts overexpressing ferritin in murine myocardial infarcts. NMR Biomed 2012;25(10):1187–1195. [DOI] [PMC free article] [PubMed] [Google Scholar]
- 27.Kanda T, Fukusato T, Matsuda M, et al. Gadolinium-based contrast agent accumulates in the brain even in subjects without severe renal dysfunction: evaluation of autopsy brain specimens with inductively coupled plasma mass spectroscopy. Radiology 2015;276(1):228–232. [DOI] [PubMed] [Google Scholar]
- 28.Kanda T, Ishii K, Kawaguchi H, Kitajima K, Takenaka D. High signal intensity in the dentate nucleus and globus pallidus on unenhanced T1-weighted MR images: relationship with increasing cumulative dose of a gadolinium-based contrast material. Radiology 2014;270(3):834–841. [DOI] [PubMed] [Google Scholar]
- 29.Pascual-Gil S, Garbayo E, Díaz-Herráez P, Prosper F, Blanco-Prieto MJ. Heart regeneration after myocardial infarction using synthetic biomaterials. J Control Release 2015;203:23–38. [DOI] [PubMed] [Google Scholar]
- 30.Budniatzky I, Gepstein L. Concise review: reprogramming strategies for cardiovascular regenerative medicine: from induced pluripotent stem cells to direct reprogramming. Stem Cells Transl Med 2014;3(4):448–457. [DOI] [PMC free article] [PubMed] [Google Scholar]
- 31.Zamani M, Prabhakaran MP, Thian ES, Ramakrishna S. Controlled delivery of stromal derived factor-1α from poly lactic-co-glycolic acid core-shell particles to recruit mesenchymal stem cells for cardiac regeneration. J Colloid Interface Sci 2015;451:144–152. [DOI] [PubMed] [Google Scholar]
- 32.Bar-Shir A, Liu G, Greenberg MM, Bulte JW, Gilad AA. Synthesis of a probe for monitoring HSV1-tk reporter gene expression using chemical exchange saturation transfer MRI. Nat Protoc 2013;8(12):2380–2391. [DOI] [PMC free article] [PubMed] [Google Scholar]
- 33.Chan KW, Liu G, Song X, et al. MRI-detectable pH nanosensors incorporated into hydrogels for in vivo sensing of transplanted-cell viability. Nat Mater 2013;12(3):268–275. [DOI] [PMC free article] [PubMed] [Google Scholar]
- 34.Yang X, Yadav NN, Song X, et al. Tuning phenols with Intra-Molecular bond Shifted HYdrogens (IM-SHY) as diaCEST MRI contrast agents. Chemistry 2014;20(48):15824–15832. [DOI] [PMC free article] [PubMed] [Google Scholar]
Associated Data
This section collects any data citations, data availability statements, or supplementary materials included in this article.


