Fluorine 19 MR imaging can be used to track bowel inflammation, and its magnitude is associated with colitis-associated dysplasia development.
Abstract
Purpose
To investigate whether the magnitude of in vivo fluorine 19 (19F) magnetic resonance (MR) imaging signal is associated with subsequent development of colitis-associated dysplasia after in situ fluorination of inflammatory macrophages in a mouse model of inflammatory bowel disease (IBD).
Materials and Methods
Experiments were approved by the institutional animal care and use committee. Mice in the experimental group (n = 10) were administered azoxymethane and dextran sulfate sodium to induce colitis-associated dysplasia. Five mice were in the noninduced control group. Animals were injected with a commercially available perfluorocarbon and were examined in vivo with an 11.7-T MR imager for up to 110 days. Colons were then harvested followed by high-spatial-resolution ex vivo MR imaging. Multiple colon segments with or without 19F signal were histologically graded and were correlated with 19F signal intensity by using a Spearman correlation test. The signal intensity in mice with colitis-associated dysplasia was compared with that in control mice with a two-tailed Mann-Whitney U test.
Results
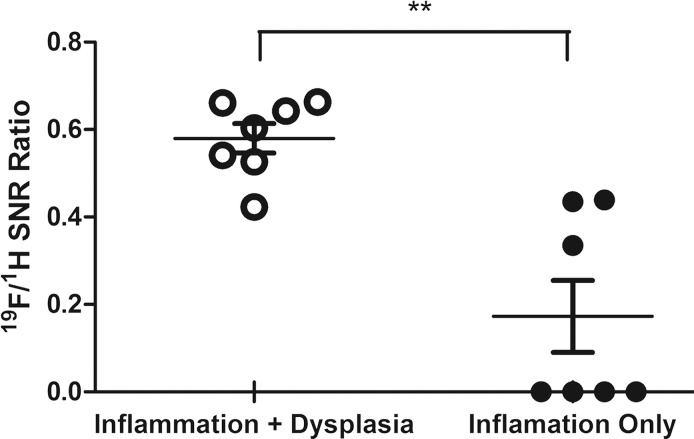
Patchy distributions of 19F signal intensity in the colon wall were seen on in vivo and ex vivo images, representing chronic inflammation as shown by immunohistochemistry. Histologic scores of inflammation and site-specific development of colitis-associated dysplasia in the descending colon showed good correlation with normalized 19F signal intensity (r = 0.88, P = .033 for the ascending colon; r = 0.82, P = .006 for the descending colon). A significantly (P = .002) higher normalized 19F signal-to-noise ratio was found at sites that developed dysplasia (mean, 0.58 ± 0.09 [standard deviation]) as compared with sites that did not (mean, 0.17 ± 0.22).
Conclusion
19F MR imaging cell tracking of macrophages can be used to assess local inflammation in a mouse model of IBD. The resulting local 19F signal intensity, representing the magnitude of inflammation, has a positive correlation with the development of colitis-associated dysplasia.
© RSNA, 2016
Introduction
The causal relationship between inflammation and cancer is well established (1). Epidemiologic studies in patients and in genetically modified mice have shown that chronic inflammation increases the risk of developing many types of cancer, including bladder, cervical, gastric, intestinal, and thyroid cancer (2,3). From a molecular perspective, transcription factors, such as nuclear factor κ-light-chain-enhancer of activated B cells (or NF-κB), signal transducer and activator of transcription 3 (or STAT3), and hypoxia-inducible factor 1-α (or HIF1α), in tumor cells recruit inflammatory cells, which then promote angiogenesis, tumor cell proliferation, survival, migration, and metastasis (3–5). It has been estimated that underlying inflammation is linked to 15%–20% of cancer mortality worldwide, and appropriate treatment with anti-inflammatory agents has been shown to decrease the incidence and mortality of several types of tumors (6,7).
Colitis-associated cancer is a subtype of colorectal cancer, with more than 1 million cases per year, that contributes substantially to overall cancer mortality (8). Colitis-associated cancer is a complication of inflammatory bowel disease (IBD), such as ulcerative colitis or Crohn disease, both of which are prevalent intestinal disorders in the United States (9,10). The chronic inflammation associated with IBD is characterized by infiltrating immune cells producing proinflammatory cytokines, which facilitate mutations in oncogenes and tumor suppressor genes, such as p53, adenomatous polyposis coli, and KRAS (11). Sustained inflammation accumulates these mutations in colonic epithelial cells, leading to the development of colitis-associated dysplasia, which is a precursor of colitis-associated cancer, through an inflammation-dysplasia-carcinoma sequence (12). Previously, Rutter et al (13) showed that the risk of colitis-associated cancer is directly correlated with duration of IBD and severity of inflammation. Hence, longitudinal monitoring of the location and severity of inflammation may enable earlier diagnosis and treatment of colitis-associated cancer.
Diagnosis of IBD is most commonly based on colonoscopy and mucosal biopsy findings, which are invasive methods that cause patient discomfort, damage colon tissue, and generate sampling errors. To overcome these limitations, noninvasive imaging techniques, such as computed tomography and magnetic resonance (MR) imaging, have been studied (14,15). These techniques are often referred to as virtual colonography. However, conventional hydrogen 1 (1H) MR imaging of the bowel is not specific for inflammation but is based on three-dimensional anatomy and volumetry measurement of colon wall thickness (13).
MR imaging can be used to track inflammation by using superparamagnetic iron oxide nanoparticles that are taken up by macrophages (16,17). More recently, fluorine 19 (19F) MR imaging with perfluorocarbon (PFC) emulsions similarly has been used as a noninvasive imaging method to depict inflammatory sites in a variety of organs and tissues (18–23). This method is based on in situ labeling of macrophages, which phagocytose the injected PFCs (24). PFCs are biologically inert inorganic molecules (25), and the absence of endogenous 19F in biologic tissues ensures that the signals originating from labeled cells create so-called hot-spot images (26–29). As compared with hypointense superparamagnetic iron oxide–induced signal changes, these 19F tracer-specific patches of signal are particularly well suited for imaging bowel inflammation, since bowel movements and the presence of air pockets that cause nonspecific signal hypointensities have precluded the use of superparamagnetic iron oxide for this application. Since macrophages are crucial mediators of chronic inflammation in patients with IBD (30,31), selective labeling of macrophages enables one to image inflammatory loci with high specificity (18). Furthermore, 19F MR imaging can be used to quantify ex vivo–labeled cells (32). Hence, it may be used to score the local macrophage load and thus the severity of inflammation (33). Importantly, the method may be clinically applicable, as PFC-based 19F MR imaging cell tracking studies have been performed in patients (34). After in situ fluorination of inflammatory macrophages in a mouse model of IBD, we investigated whether in vivo 19F MR imaging signal intensity was associated with subsequent development of colitis-associated dysplasia.
Materials and Methods
Mouse Model of Colitis-associated Dysplasia
All experimental procedures involving animals were approved by our institutional animal care and use committee. Colitis-associated dysplasia was induced in mice, as previously described (35,36). Colitis-associated dysplasia developed over 7 weeks, after which time the animals were observed with MR imaging for 9 weeks (Fig E1 [online]). To this end, 10 8-week-old female A/J mice were purchased from Jackson Laboratory (Bar Harbor, Me) and were intraperitoneally injected with azoxymethane (10 mg per kilogram of body weight, Sigma, St Louis, Mo) at day 0. To ensure that tumors developed through IBD, dextran sulfate sodium (MP Biomedicals, Solon, Ohio) was used to induce chronic colon inflammation. Dextran sulfate sodium was dissolved in drinking water (2.5% weight per volume). Each dextran sulfate sodium cycle lasted 1 week and was repeated every 3 weeks until week 7. Usually, three to 10 macroscopic lesions develop in 80%–100% of the animals. Mice that did not receive azoxymethane and dextran sulfate sodium served as the control group (n = 5). Body weight was recorded every week until all experimental and control animals were sacrificed at day 110 after azoxymethane injection. Mice were fed a standard diet without supplements (global 18% extruded rodent diet [2018SX; Teklad, Indianapolis, Ind] containing no less than 18% crude protein, no less than 5% fat, and not more than 5% fiber).
In Vivo MR Imaging
Two days before beginning the MR imaging studies, 200 μL of PFC emulsion (Celsense, Pittsburgh, Pa) was injected intravenously via a tail vein with a 27-gauge needle. The concentration of PFC emulsion was 200 mg/mL, and the diameter of the emulsion ranged from 145 to 165 nm according to the manufacturer. For immunostaining, five animals were injected with a fluorescent version of the same emulsion (VS-1000H DM Red; Celsense) with the same experimental parameters.
Five mice were imaged every 15 days from day 50 to day 110 (Fig E1 [online]).The five remaining mice and mice in the control group were imaged two times until day 65. Imaging was performed by using an 11.7-T horizontal MR imager (BioSpec 117/16 USR; Bruker Biospin, Billerica, Mass) with a 20-mm surface coil tunable to both 1H and 19F frequencies. Mice were anesthetized with 1.5% isoflurane gas, and 1H images were acquired by using a rapid acquisition with refocused echoes (RARE) sequence with the following parameters: repetition time msec/echo time msec, 1200/30; section thickness, 2 mm; matrix, 256 × 256; RARE factor, eight; field of view, 3.2 × 2.0 cm; and four signals acquired. 19F images were acquired by using the RARE sequence and the following parameters: 1000/14; section thickness, 2 mm; matrix, 64 × 32; RARE factor, eight; field of view, 3.2 × 2.0 cm; and 64 sections acquired. 19F images were expressed in pseudocolor scale and were coregistered to the corresponding 1H images by using Paravision software (version 5.1; Bruker Biospin, Ettlingen, Germany). Each image was scaled for subjective optimal visualization and presentation.
Ex Vivo MR Imaging
After the last in vivo MR imaging time point, all mice were euthanized, and the colons were excised. Ex vivo MR imaging was performed to confirm the results from in vivo MR imaging with higher resolution to precisely colocalize the inflammatory sites and dysplastic lesions with 19F signal intensity. Each colon was divided into two parts, the ascending colon and the descending colon, and a glass rod was inserted into the lumen of each colon segment to straighten the tissue. After fixation in 4% paraformaldehyde for 2 days, tissues were transferred to 10-mmol/L phosphate-buffered saline solution with a pH of 7.4 and were imaged with a 17.6-T vertical bore MR imager (Bruker Biospin) and a 25-mm volume coil tunable to either 1H or 19F. 1H and 19F images were again acquired by using the RARE sequence. The 1H MR imaging parameters were as follows: 1000/10; section thickness, 1 mm; matrix, 256 × 256; RARE factor, eight; field of view for sagittal images, 2.6 × 1.3 cm; field of view for axial images, 1.3 × 1.3 cm; and four signals acquired. The 19F MR imaging parameters were as follows: 1000/6: matrix, 64 × 32; RARE factor, 16; and 256 signals acquired. 19F images were superimposed on the corresponding 1H images.
19F MR Signal Intensity Analysis
We used ParaVision 5.1 software (Bruker Biospin) to analyze 19F MR signal intensity. Free-form polygonal regions of interest (ROIs) ranging from 3 to 10 mm were drawn by an investigator (S.H.S.) in a nonblinded fashion over every 19F signal intensity patch in the ascending and descending colon, with two to four ROIs per mouse. Since excised colon segments were used, the ROIs could be easily drawn on both the ascending colon and the descending colon. ROIs were not drawn for control mice since the 19F signal intensity in the colon is absent for this group. The aforementioned software was used to measure mean signal intensity and the standard deviation of the background signal intensity to calculate the signal-to-noise ratio (SNR) of the selected 19F signal intensity patch. Each 19F MR image was processed in a way that only the pixels with an SNR of 3.5 or higher appear in the image (37), and the background noise was suppressed. SNR values of the 1H images also were calculated for the same ROIs. 19F SNR values were normalized to the corresponding 1H ratios. A description of immunohistochemistry and histologic grading of inflammation and dysplasia can be found in Appendix E1 (online).
Statistical Analysis
Statistical analysis was performed by using a nonparametric Mann-Whitney test after a normal distribution test through histogram analysis and a Shapiro-Wilk test. For multigroup comparison (ascending colon vs descending colon, 19F signal vs no signal), P values were adjusted with Bonferroni correction. A Spearman correlation factor was used as an indicator of correlation between 19F signal intensity and total colitis score. A significance level of .05 (.05/3 for Bonferroni correction) was used for all statistical analysis. Statistical analysis was performed by using GraphPad Prism 5 software (GraphPad Software, La Jolla, Calif).
Results
In Vivo 19F MR Imaging of Colon Inflammation
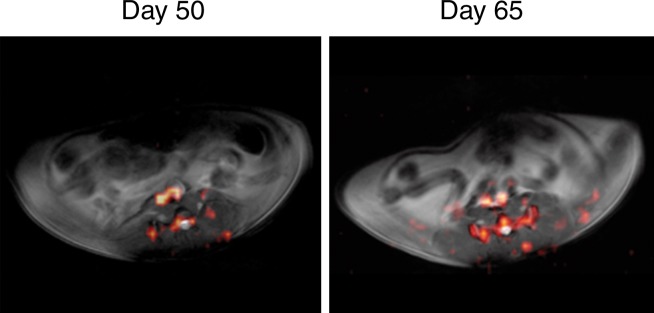
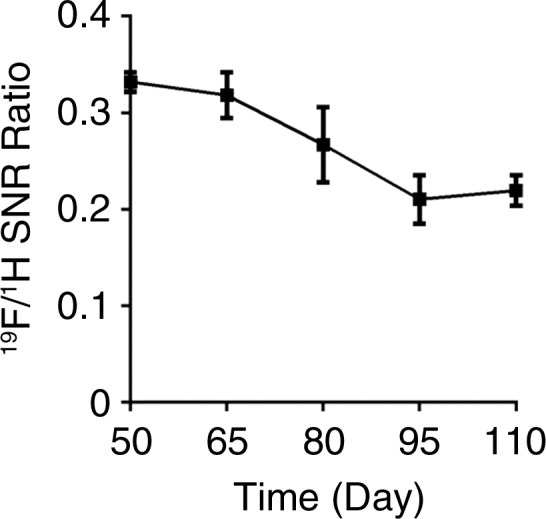
19F MR imaging showed PFC emulsions accumulating in the colon wall, with a patchy distribution (Fig 1a). No 19F signal could be detected in the colon wall of mice that did not have colitis-associated dysplasia (Fig 1b). To investigate the change of 19F signal intensity over time, the SNR of 19F signal in the colon wall was normalized to the SNR of corresponding 1H images. Normalized SNR showed that 19F signal intensity decreased over time but persisted for up to 110 days, at which time the animals were euthanized (Fig 1c). 19F signals were also detected in the vertebra and spleen in all mice, reflecting normal macrophage activity.
Figure 1a:
(a) In vivo axial merged 1H and 19F MR images of the abdomen in mice with colitis-associated dysplasia obtained at different days. Accumulation of PFCs is visible in the colon (black arrows) and vertebrae (white arrows). 19F signal intensity was also detected in the kidney at day 110 (arrowhead). (b) In vivo axial MR images in control mice at days 50 and 65 do not show 19F signal intensity in the colon. The 19F signal intensity is seen in only the vertebra and the iliac lymph nodes. PFC was injected on day 48, and no further PFC was given; therefore, control mice were not examined after day 65. (c) Graph shows normalized 19F SNR in all ROIs combined. The 19F signal intensity persisted over time. Error bars indicate standard error of the mean.
Figure 1b:
(a) In vivo axial merged 1H and 19F MR images of the abdomen in mice with colitis-associated dysplasia obtained at different days. Accumulation of PFCs is visible in the colon (black arrows) and vertebrae (white arrows). 19F signal intensity was also detected in the kidney at day 110 (arrowhead). (b) In vivo axial MR images in control mice at days 50 and 65 do not show 19F signal intensity in the colon. The 19F signal intensity is seen in only the vertebra and the iliac lymph nodes. PFC was injected on day 48, and no further PFC was given; therefore, control mice were not examined after day 65. (c) Graph shows normalized 19F SNR in all ROIs combined. The 19F signal intensity persisted over time. Error bars indicate standard error of the mean.
Figure 1c:
(a) In vivo axial merged 1H and 19F MR images of the abdomen in mice with colitis-associated dysplasia obtained at different days. Accumulation of PFCs is visible in the colon (black arrows) and vertebrae (white arrows). 19F signal intensity was also detected in the kidney at day 110 (arrowhead). (b) In vivo axial MR images in control mice at days 50 and 65 do not show 19F signal intensity in the colon. The 19F signal intensity is seen in only the vertebra and the iliac lymph nodes. PFC was injected on day 48, and no further PFC was given; therefore, control mice were not examined after day 65. (c) Graph shows normalized 19F SNR in all ROIs combined. The 19F signal intensity persisted over time. Error bars indicate standard error of the mean.
Colocalization of 19F Signal with Inflammatory and Dysplastic Lesions
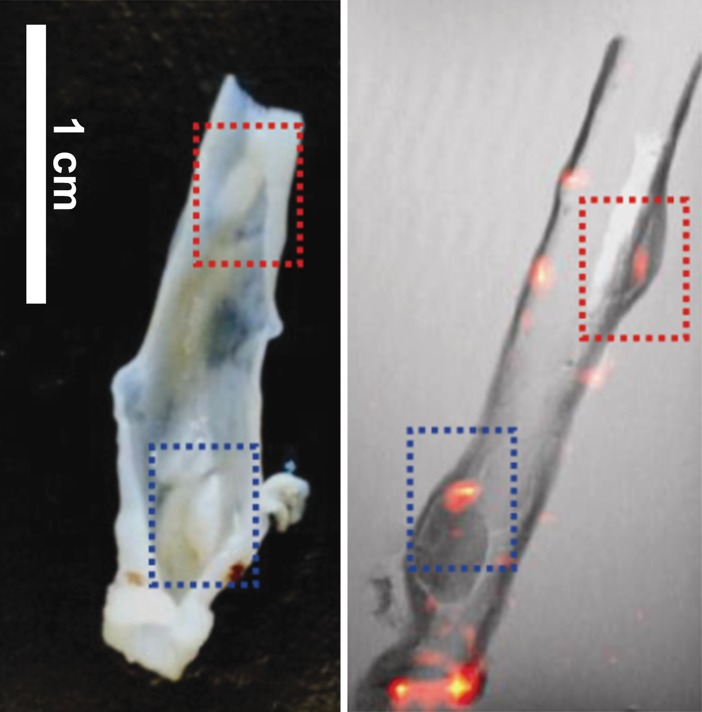
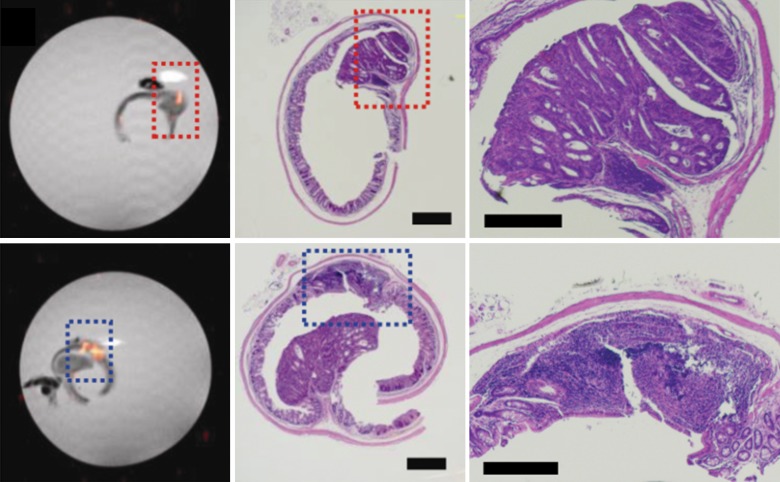
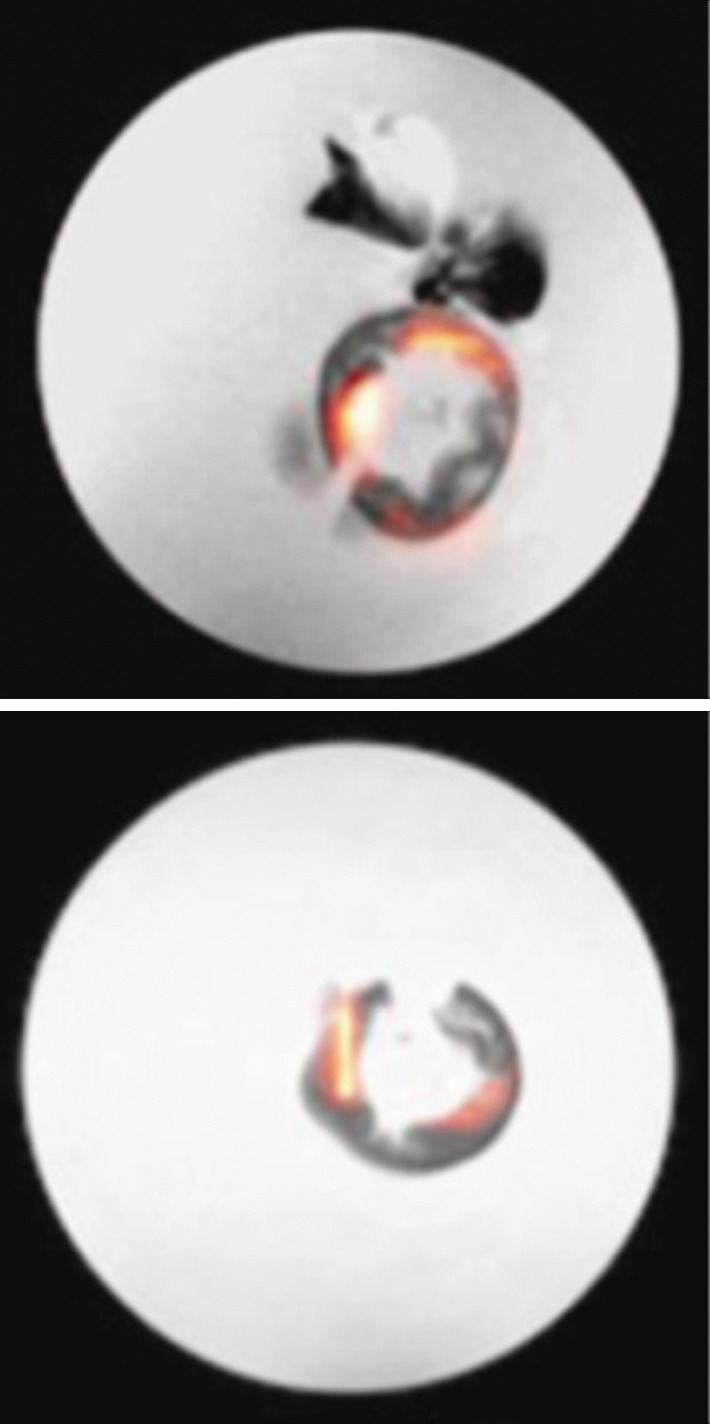
The 19F signals from ex vivo imaging were concentrated in the colon wall, showing several distinct foci (Fig 2a, 2b). The 19F signal was more pronounced in the descending colon than in the ascending colon. Colon segments without 19F signal (eight from the ascending colon, four from the descending colon) were also found (Fig 2c). Hemotoxylin-eosin–stained slices from paraffin-embedded tissues were then compared with the corresponding axial MR images. Strong 19F signals could be observed in regions with severe inflammation, as characterized by abundant phagocytic immune cell infiltration or dysplastic lesions (Fig 2d).
Figure 2a:
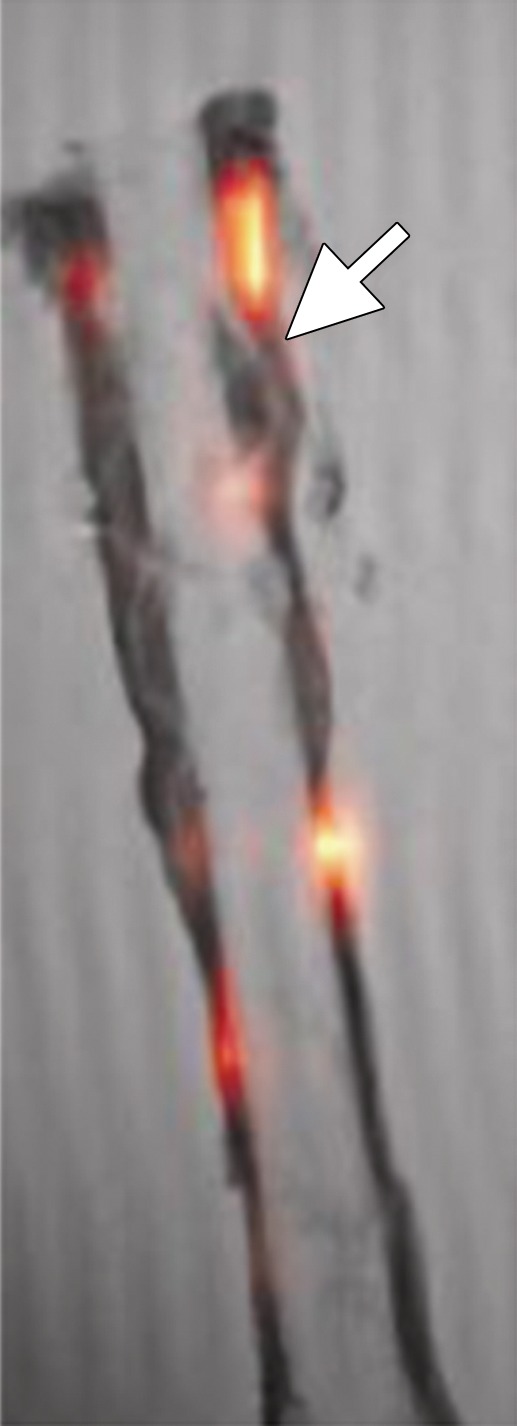
Ex vivo MR imaging and colocalization of 19F signals with adenoma and inflammatory sites. (a) Sagittal MR image of an excised descending colon. Note the adenoma growth (arrow) from a 19F-positive inflammatory site. (b) Representative axial merged 1H and 19F MR images of the descending (top) and ascending (bottom) colon fixed in 4% paraformaldehyde. (c) Gross comparison of excised descending colon (left) and corresponding MR image (right). Red and blue boxes indicate two adenomas with corresponding gross and MR images (19F signal intensity). (d) Axial ex vivo MR images of the descending colon (left) were compared with corresponding hematoxylin-eosin–stained slices (middle, right). Colocalization of 19F signal intensity with either an adenoma (red box) or an inflammatory site (blue box) can be observed (scale bar = 500 μm and 300 μm for lower and higher magnifications, respectively).
Figure 2b:
Ex vivo MR imaging and colocalization of 19F signals with adenoma and inflammatory sites. (a) Sagittal MR image of an excised descending colon. Note the adenoma growth (arrow) from a 19F-positive inflammatory site. (b) Representative axial merged 1H and 19F MR images of the descending (top) and ascending (bottom) colon fixed in 4% paraformaldehyde. (c) Gross comparison of excised descending colon (left) and corresponding MR image (right). Red and blue boxes indicate two adenomas with corresponding gross and MR images (19F signal intensity). (d) Axial ex vivo MR images of the descending colon (left) were compared with corresponding hematoxylin-eosin–stained slices (middle, right). Colocalization of 19F signal intensity with either an adenoma (red box) or an inflammatory site (blue box) can be observed (scale bar = 500 μm and 300 μm for lower and higher magnifications, respectively).
Figure 2c:
Ex vivo MR imaging and colocalization of 19F signals with adenoma and inflammatory sites. (a) Sagittal MR image of an excised descending colon. Note the adenoma growth (arrow) from a 19F-positive inflammatory site. (b) Representative axial merged 1H and 19F MR images of the descending (top) and ascending (bottom) colon fixed in 4% paraformaldehyde. (c) Gross comparison of excised descending colon (left) and corresponding MR image (right). Red and blue boxes indicate two adenomas with corresponding gross and MR images (19F signal intensity). (d) Axial ex vivo MR images of the descending colon (left) were compared with corresponding hematoxylin-eosin–stained slices (middle, right). Colocalization of 19F signal intensity with either an adenoma (red box) or an inflammatory site (blue box) can be observed (scale bar = 500 μm and 300 μm for lower and higher magnifications, respectively).
Figure 2d:
Ex vivo MR imaging and colocalization of 19F signals with adenoma and inflammatory sites. (a) Sagittal MR image of an excised descending colon. Note the adenoma growth (arrow) from a 19F-positive inflammatory site. (b) Representative axial merged 1H and 19F MR images of the descending (top) and ascending (bottom) colon fixed in 4% paraformaldehyde. (c) Gross comparison of excised descending colon (left) and corresponding MR image (right). Red and blue boxes indicate two adenomas with corresponding gross and MR images (19F signal intensity). (d) Axial ex vivo MR images of the descending colon (left) were compared with corresponding hematoxylin-eosin–stained slices (middle, right). Colocalization of 19F signal intensity with either an adenoma (red box) or an inflammatory site (blue box) can be observed (scale bar = 500 μm and 300 μm for lower and higher magnifications, respectively).
Identification of Macrophages as the Source of 19F MR Signal
Macrophages were found to infiltrate the lamina propria at the site of PFC accumulation (Fig E2a [online]). Images with higher magnification showed that PFC emulsions were almost exclusively present within the cytoplasm of macrophages, outside of the nucleus, and within the boundary of the cell membrane (Fig E2b–E2d [online]). However, not all macrophages were labeled because of (a) the lack of PFC contact, (b) PFC excretion and dissipation, or (c) the presence of younger macrophages cells that infiltrated after the PFC was cleared from the circulation.
Correlation of 19F Signal with Histologic Scores of Inflammation and Dysplasia
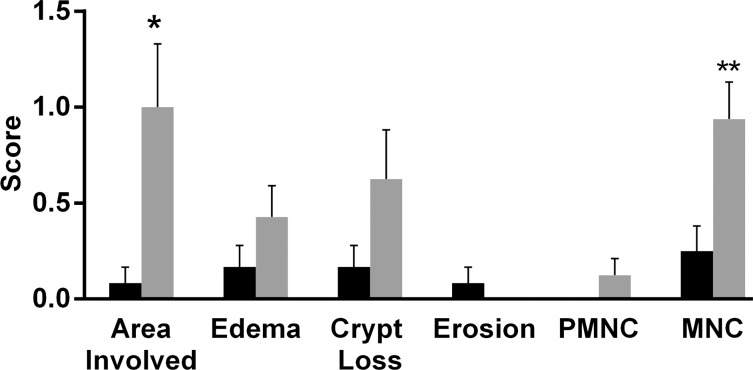
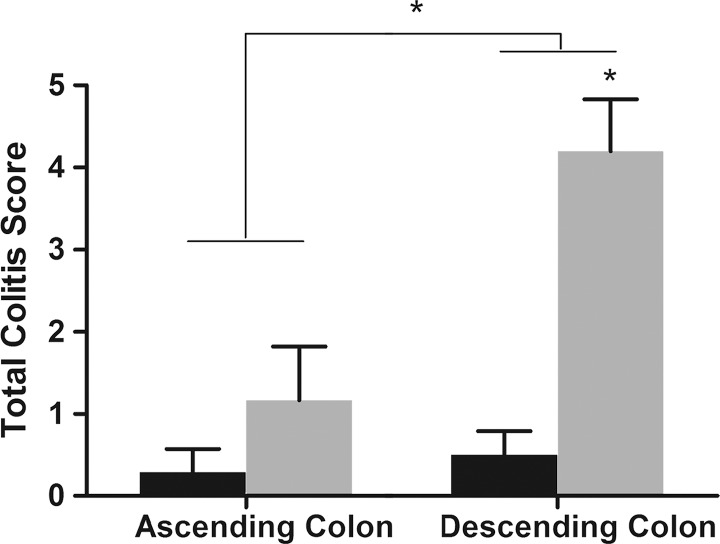
Sections of colon segments with 19F signal exhibited more inflammation than did those without 19F signal, as characterized by mononuclear cell infiltration and the appearance of a thick colon wall. For most of the parameters, the sections from colon segments with 19F signal exhibited higher scores than did those without signal, especially for the mononuclear cell infiltration criteria (Fig E3 [online], Fig 3a). Dysplasia scores and total colitis scores also were compared. Segments with 19F signal had significantly higher scores for both dysplasia (0.63 ± 0.81, P = .013) and colitis (3.06 ± 2.35, P = .006) (Fig 3b). Comparison of segments from the ascending colon and segments from the descending colon showed that the latter group had higher scores (Fig 4a).
Figure 3a:
(a) Graph shows colon segments with 19F signal (gray) have higher histologic scores than do segments without 19F signal (black) for most of the scoring parameters. Significant differences were observed for the area involved (* P = .036) and mononuclear cell (MNC) infiltration (** P = .009) criteria. PMNC = peripheral blood mononuclear cell. (b) Total colitis score was calculated by summation of the scores for all criteria. Graph shows colon segments with 19F signal had significantly higher total colitis (* P = .006) and dysplasia (** P = .013) scores than did segments without 19F signal. Error bars indicate standard error of the mean.
Figure 3b:
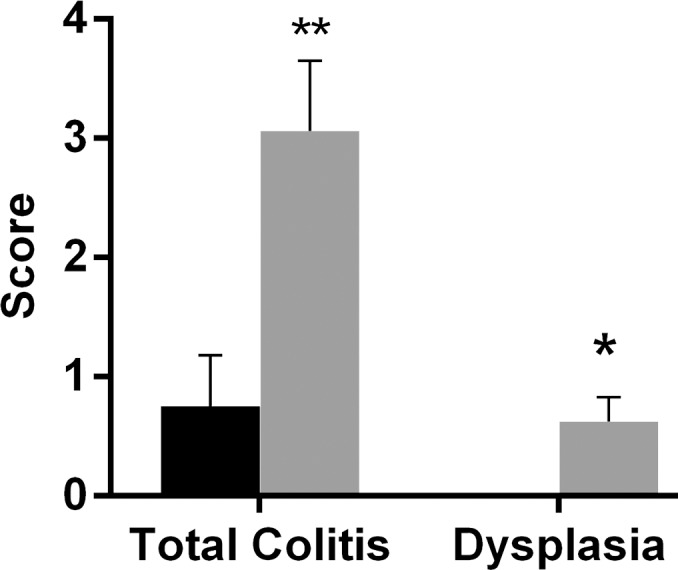
(a) Graph shows colon segments with 19F signal (gray) have higher histologic scores than do segments without 19F signal (black) for most of the scoring parameters. Significant differences were observed for the area involved (* P = .036) and mononuclear cell (MNC) infiltration (** P = .009) criteria. PMNC = peripheral blood mononuclear cell. (b) Total colitis score was calculated by summation of the scores for all criteria. Graph shows colon segments with 19F signal had significantly higher total colitis (* P = .006) and dysplasia (** P = .013) scores than did segments without 19F signal. Error bars indicate standard error of the mean.
Figure 4a:
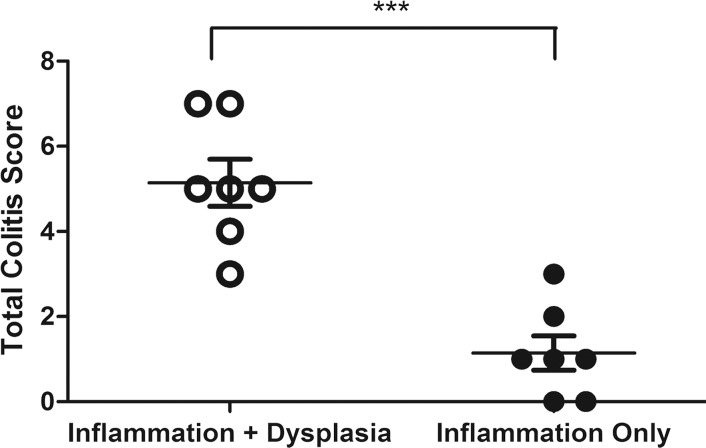
Graphs show correlation between normalized 19F SNR (calculated from ex vivo images) and histologic disease scores. Error bars indicate standard error of the mean. (a) Comparison of total colitis score between ascending colon (n = 14) and descending colon (n = 14). The descending colon exhibits significantly higher scores than does the ascending colon (* P = .022). Within the descending colon, segments with 19F signal (gray, n = 10) have significantly higher scores than do those without signal (black, n = 4) (* P = .016). (b) Correlation between normalized 19F SNR and total colitis score in ascending colon segments (n = 6 with 19F signal) (r = 0.88, P = .033). (c) Graph shows correlation between normalized 19F SNR with total colitis score in descending colon segments (n = 10 with 19F signal) (r = 0.82, P = .0058). (d) Graph shows total colitis scores in descending colon segments with either inflammation and dysplasia (n = 7) or only inflammation (n = 7) (*** P = .0025). (e) Graph shows normalized 19F SNR values in descending colon segments with either inflammation and dysplasia or only inflammation (** P = .0023).
For segments with 19F signal, normalized 19F SNR values were then correlated with corresponding histologic scores of colitis and dysplasia. 19F signals from both the ascending colon and the descending colon showed a significant correlation with the total colitis score (Fig 4b, 4c; Table). The dysplasia groups had a significantly higher total colitis score and normalized 19F SNR values (Fig 4d, 4e).
Figure 4b:
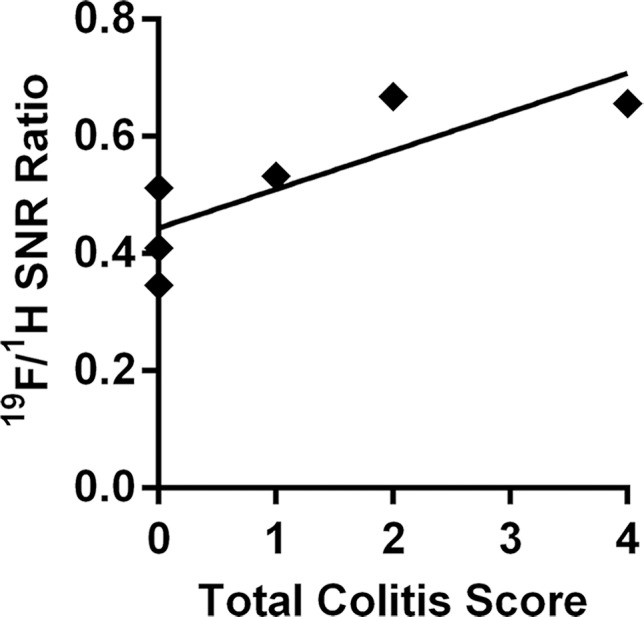
Graphs show correlation between normalized 19F SNR (calculated from ex vivo images) and histologic disease scores. Error bars indicate standard error of the mean. (a) Comparison of total colitis score between ascending colon (n = 14) and descending colon (n = 14). The descending colon exhibits significantly higher scores than does the ascending colon (* P = .022). Within the descending colon, segments with 19F signal (gray, n = 10) have significantly higher scores than do those without signal (black, n = 4) (* P = .016). (b) Correlation between normalized 19F SNR and total colitis score in ascending colon segments (n = 6 with 19F signal) (r = 0.88, P = .033). (c) Graph shows correlation between normalized 19F SNR with total colitis score in descending colon segments (n = 10 with 19F signal) (r = 0.82, P = .0058). (d) Graph shows total colitis scores in descending colon segments with either inflammation and dysplasia (n = 7) or only inflammation (n = 7) (*** P = .0025). (e) Graph shows normalized 19F SNR values in descending colon segments with either inflammation and dysplasia or only inflammation (** P = .0023).
Figure 4c:
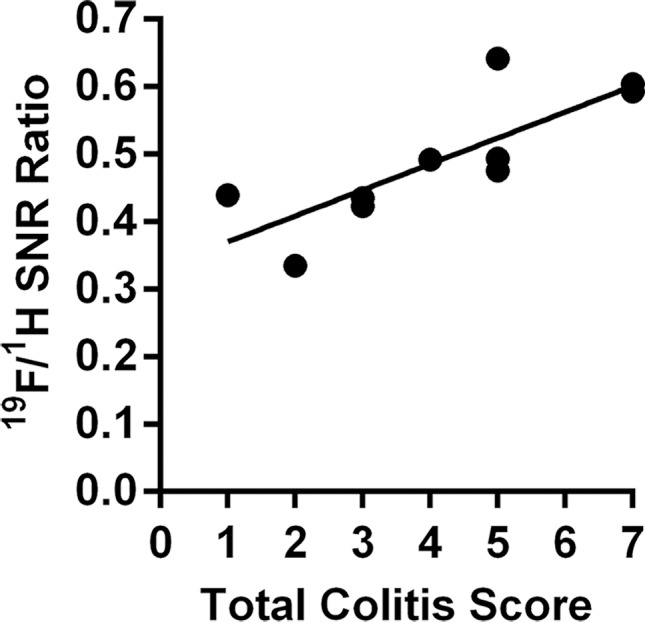
Graphs show correlation between normalized 19F SNR (calculated from ex vivo images) and histologic disease scores. Error bars indicate standard error of the mean. (a) Comparison of total colitis score between ascending colon (n = 14) and descending colon (n = 14). The descending colon exhibits significantly higher scores than does the ascending colon (* P = .022). Within the descending colon, segments with 19F signal (gray, n = 10) have significantly higher scores than do those without signal (black, n = 4) (* P = .016). (b) Correlation between normalized 19F SNR and total colitis score in ascending colon segments (n = 6 with 19F signal) (r = 0.88, P = .033). (c) Graph shows correlation between normalized 19F SNR with total colitis score in descending colon segments (n = 10 with 19F signal) (r = 0.82, P = .0058). (d) Graph shows total colitis scores in descending colon segments with either inflammation and dysplasia (n = 7) or only inflammation (n = 7) (*** P = .0025). (e) Graph shows normalized 19F SNR values in descending colon segments with either inflammation and dysplasia or only inflammation (** P = .0023).
Correlation of 19F Signal to the Degree of Inflammation and Dysplasia

Note.—NA = not applicable. (No ascending colon segments contained dysplasia.)
Figure 4d:
Graphs show correlation between normalized 19F SNR (calculated from ex vivo images) and histologic disease scores. Error bars indicate standard error of the mean. (a) Comparison of total colitis score between ascending colon (n = 14) and descending colon (n = 14). The descending colon exhibits significantly higher scores than does the ascending colon (* P = .022). Within the descending colon, segments with 19F signal (gray, n = 10) have significantly higher scores than do those without signal (black, n = 4) (* P = .016). (b) Correlation between normalized 19F SNR and total colitis score in ascending colon segments (n = 6 with 19F signal) (r = 0.88, P = .033). (c) Graph shows correlation between normalized 19F SNR with total colitis score in descending colon segments (n = 10 with 19F signal) (r = 0.82, P = .0058). (d) Graph shows total colitis scores in descending colon segments with either inflammation and dysplasia (n = 7) or only inflammation (n = 7) (*** P = .0025). (e) Graph shows normalized 19F SNR values in descending colon segments with either inflammation and dysplasia or only inflammation (** P = .0023).
Figure 4e:
Graphs show correlation between normalized 19F SNR (calculated from ex vivo images) and histologic disease scores. Error bars indicate standard error of the mean. (a) Comparison of total colitis score between ascending colon (n = 14) and descending colon (n = 14). The descending colon exhibits significantly higher scores than does the ascending colon (* P = .022). Within the descending colon, segments with 19F signal (gray, n = 10) have significantly higher scores than do those without signal (black, n = 4) (* P = .016). (b) Correlation between normalized 19F SNR and total colitis score in ascending colon segments (n = 6 with 19F signal) (r = 0.88, P = .033). (c) Graph shows correlation between normalized 19F SNR with total colitis score in descending colon segments (n = 10 with 19F signal) (r = 0.82, P = .0058). (d) Graph shows total colitis scores in descending colon segments with either inflammation and dysplasia (n = 7) or only inflammation (n = 7) (*** P = .0025). (e) Graph shows normalized 19F SNR values in descending colon segments with either inflammation and dysplasia or only inflammation (** P = .0023).
Discussion
In this study, we show as proof-of-principle that 19F MR imaging can be used to track bowel inflammation and that its magnitude is associated with colitis-associated dysplasia development. In vivo MR imaging showed a patchy distribution of 19F signal intensity in the colon wall, with colocalization of dysplastic lesions and 19F-positive inflammatory sites. Histologic scores of inflammation and associated dysplasia showed a significant correlation with the intensity of the 19F signal, indicating that the severity of inflammation can be noninvasively measured with MR imaging.
For measurement of 19F signal intensity, the 19F SNR was normalized to the SNR of the corresponding 1H image. Hence, all factors involved in MR image acquisition that determine sensitivity, including coil sensitivity, field homogenization, and receiver gain, can be corrected for with this normalization, making it possible to compare 19F signal intensities among different animals at various imaging time points. The normalized 19F SNR from in vivo imaging showed a persisting 19F signal intensity over time. Given the long life span of macrophages (38), this stable 19F signal likely originated from macrophages that infiltrated during the start of inflammation. It is possible that PFC nanoparticles did exchange between macrophage populations; however, based on studies of iron oxide particles and macrophage transfer from labeled cells (39), the occurrence of transcellular transfer is expected to be minimal.
The correlation of normalized 19F SNR to histologic disease scores suggests that 19F signal represents the severity of inflammation and dysplasia development. The segment with 19F signals had higher scores in most of the criteria used for inflammation assessment than did segments without signals. The most prominent difference was observed in mononuclear cell infiltration criteria, while peripheral blood mononuclear cell infiltration criteria did not show a significant difference. This phenomenon further supports the selective in situ PFC labeling of macrophages, which was confirmed with immunohistochemistry. The total colitis score (ie, the sum of scores from all the criteria) was also well represented by normalized 19F SNR values. The total colitis scores in the descending colon were significantly higher than those in the ascending colon. This finding is in agreement with findings of previous studies that showed that the descending colon is more damaged than the ascending colon when treated with dextran sulfate sodium and is more susceptible to tumor growth (36). All the adenomas and dysplastic lesions we observed were from the descending colon, further corroborating the well-established relationship between inflammation and cancer. When we compared descending colon segments with dysplasia and those without, we found that the former group had significantly higher total colitis scores and normalized 19F SNR values.
Our study had several limitations. Most importantly, while we found a positive correlation between the severity of inflammation and the development of dysplasia, our approach is not a specific predictor for development of colitis-associated dysplasia, since dysplasia can be present in patients with IBD without active inflammation (40). While the duration and severity of inflammation is generally correlated with cancer development in patients with IBD (13), the inflammatory processes can be intermittent, with cancer development being stochastic. Our 19F MR imaging approach cannot be used to distinguish inflammatory lesions from precancerous or cancerous lesions. Further studies are needed for instances in which 19F MR imaging is combined with contrast material–enhanced and T2-weighted MR imaging to evaluate its relative sensitivity and specificity. While these studies are difficult to perform in mice, it should be noted that in patient studies, 19F signal will not interfere with the conventional 1H signal. While 19F MR imaging cell tracking has recently entered the clinical realm, only the injection site could be visualized in patients when migrating dendritic cells were prelabeled ex vivo (34) and injected at a dose of 1 × 10⁷ cells. The sensitivity of the detection of macrophages labeled in situ with a clinical set-up is not known. Our experiments were performed at 11.7 T, which is a high preclinical field strength, where the SNR is several-fold better as compared with the lower magnetic fields of conventional clinical imagers (1.5 or 3.0 T); thus, our results are not directly comparable with what would be expected at lower field strength. A potential drawback is the current limited availability of the needed hardware (dual 1H- and 19F-tuned coils and interfaces), making our approach not widely applicable. Also, the macrophage intracellular fluorine content is unknown. For labeled cells in general, this depends on cell size and the concentration and length of label incubation. For ex vivo prelabeled cells, this can be easily controlled and measured (with cells typically containing [1–5] × 1012 fluorine atoms per cell); however, one could further determine the fluorine content of in situ–labeled macrophages. One would have to harvest the tissue, make single cell suspensions, flow sort for macrophages (by virtue of the fluorescent perfluorocarbon), and perform a 19F NMR experiment. The total dose of PFC that was administered to the mice in our study (1.6 g of PFC per kilogram of body weight) is within the range used in clinical studies in which a PFC emulsion (Oxygent; Alliance Pharmaceuticals, Chippenham, England) was used as an artificial red blood cell substitute to carry oxygen; when PFC is administered at a dose of 1.2–1.8 g/kg, an excellent safety profile was observed with unaltered immunologic parameters (41).
Practical applications: In summary, early diagnosis of colitis-associated dysplasia is an important factor for successful treatment of subsequent colitis–associated cancer, given its lower survival rate when compared with that of sporadic colorectal cancer (42). Since 19F MR imaging is noninvasive and depends on macrophage infiltration rather than the macroscopic tissue appearance, it may be further applied as an adjunct technique to determine the risk of site-specific development of colitis-associated dysplasia.
Advances in Knowledge
■ Intravenous injection of perfluorocarbons followed by in situ labeling of macrophages can be used to detect chronic bowel inflammation with fluorine 19 (19F) MR imaging.
■ A significantly (P = .002) higher normalized 19F signal intensity is found at sites containing dysplastic tissue (mean, 0.58 ± 0.09) compared with sites without dysplasia development (mean, 0.17 ± 0.22).
Implication for Patient Care
■ 19F MR imaging can be used to assess the severity of bowel inflammation in patients with inflammatory bowel disease and may be further developed clinically as a noninvasive tool with which to determine the risk of developing colitis-associated dysplasia.
APPENDIX
SUPPLEMENTAL FIGURES
Acknowledgments
Acknowledgments
The authors are grateful to the laboratory of Cory Brayton, DVM, for performing histologic scoring, and to Piotr Walczak, MD, and Irina Shats, MS, for their assistance with immunohistochemistry and microscopy.
Received October 29, 2015; revision requested December 21; revision received January 26, 2016; accepted February 19; final version accepted May 4.
Current address: Molecular Imaging & Therapy Branch, Division of Convergence Technology, National Cancer Center, Goyang, Gyeonggi-do, Korea.
Partially supported by the National Institutes of Health (U54 CA151838).
S.H.S. and D.K.K. contributed equally to this work.
Disclosures of Conflicts of Interest: S.H.S. disclosed no relevant relationships. D.K.K. disclosed no relevant relationships. J.W.M.B. Activities related to the present article: disclosed no relevant relationships. Activities not related to the present article: received a grant from Philips Healthcare. Other relationships: disclosed no relevant relationships.
Abbreviations:
- IBD
- inflammatory bowel disease
- PFC
- perfluorocarbon
- RARE
- rapid acquisition with relaxation enhancement
- ROI
- region of interest
- SNR
- signal-to-noise ratio
References
- 1.Coussens LM, Werb Z. Inflammation and cancer. Nature 2002;420(6917):860–867. [DOI] [PMC free article] [PubMed] [Google Scholar]
- 2.Balkwill F, Charles KA, Mantovani A. Smoldering and polarized inflammation in the initiation and promotion of malignant disease. Cancer Cell 2005;7(3):211–217. [DOI] [PubMed] [Google Scholar]
- 3.Mantovani A, Allavena P, Sica A, Balkwill F. Cancer-related inflammation. Nature 2008;454(7203):436–444. [DOI] [PubMed] [Google Scholar]
- 4.Karin M. Nuclear factor-kappaB in cancer development and progression. Nature 2006;441(7092):431–436. [DOI] [PubMed] [Google Scholar]
- 5.Yu H, Kortylewski M, Pardoll D. Crosstalk between cancer and immune cells: role of STAT3 in the tumour microenvironment. Nat Rev Immunol 2007;7(1):41–51. [DOI] [PubMed] [Google Scholar]
- 6.Balkwill F, Mantovani A. Inflammation and cancer: back to Virchow? Lancet 2001;357(9255):539–545. [DOI] [PubMed] [Google Scholar]
- 7.Flossmann E, Rothwell PM; British Doctors Aspirin Trial and the UK-TIA Aspirin Trial . Effect of aspirin on long-term risk of colorectal cancer: consistent evidence from randomised and observational studies. Lancet 2007;369(9573):1603–1613. [DOI] [PubMed] [Google Scholar]
- 8.Tenesa A, Dunlop MG. New insights into the aetiology of colorectal cancer from genome-wide association studies. Nat Rev Genet 2009;10(6):353–358. [DOI] [PubMed] [Google Scholar]
- 9.Grivennikov SI. Inflammation and colorectal cancer: colitis-associated neoplasia. Semin Immunopathol 2013;35(2):229–244. [DOI] [PMC free article] [PubMed] [Google Scholar]
- 10.Rubin DC, Shaker A, Levin MS. Chronic intestinal inflammation: inflammatory bowel disease and colitis-associated colon cancer. Front Immunol 2012;3:107. [DOI] [PMC free article] [PubMed] [Google Scholar]
- 11.Terzić J, Grivennikov S, Karin E, Karin M. Inflammation and colon cancer. Gastroenterology 2010;138(6):2101–2114.e5. [DOI] [PubMed] [Google Scholar]
- 12.Ullman TA, Itzkowitz SH. Intestinal inflammation and cancer. Gastroenterology 2011;140(6):1807–1816. [DOI] [PubMed] [Google Scholar]
- 13.Rutter M, Saunders B, Wilkinson K, et al. Severity of inflammation is a risk factor for colorectal neoplasia in ulcerative colitis. Gastroenterology 2004;126(2):451–459. [DOI] [PubMed] [Google Scholar]
- 14.Schreyer AG, Seitz J, Feuerbach S, Rogler G, Herfarth H. Modern imaging using computer tomography and magnetic resonance imaging for inflammatory bowel disease (IBD) AU1. Inflamm Bowel Dis 2004;10(1):45–54. [DOI] [PubMed] [Google Scholar]
- 15.Sempere GA, Martinez Sanjuan V, Medina Chulia E, et al. MRI evaluation of inflammatory activity in Crohn’s disease. AJR Am J Roentgenol 2005;184(6):1829–1835. [DOI] [PubMed] [Google Scholar]
- 16.Weissleder R, Nahrendorf M, Pittet MJ. Imaging macrophages with nanoparticles. Nat Mater 2014;13(2):125–138. [DOI] [PubMed] [Google Scholar]
- 17.Modo M, Hoehn M, Bulte JW. Cellular MR imaging. Mol Imaging 2005;4(3):143–164. [DOI] [PubMed] [Google Scholar]
- 18.Kadayakkara DK, Ranganathan S, Young WB, Ahrens ET. Assaying macrophage activity in a murine model of inflammatory bowel disease using fluorine-19 MRI. Lab Invest 2012;92(4):636–645. [DOI] [PMC free article] [PubMed] [Google Scholar]
- 19.Flögel U, Ding Z, Hardung H, et al. In vivo monitoring of inflammation after cardiac and cerebral ischemia by fluorine magnetic resonance imaging. Circulation 2008;118(2):140–148. [DOI] [PMC free article] [PubMed] [Google Scholar]
- 20.van Heeswijk RB, Pellegrin M, Flögel U, et al. Fluorine MR imaging of inflammation in atherosclerotic plaque in vivo. Radiology 2015;275(2):421–429. [DOI] [PubMed] [Google Scholar]
- 21.Hitchens TK, Ye Q, Eytan DF, Janjic JM, Ahrens ET, Ho C. 19F MRI detection of acute allograft rejection with in vivo perfluorocarbon labeling of immune cells. Magn Reson Med 2011;65(4):1144–1153. [DOI] [PMC free article] [PubMed] [Google Scholar]
- 22.Temme S, Bönner F, Schrader J, Flögel U. 19F magnetic resonance imaging of endogenous macrophages in inflammation. Wiley Interdiscip Rev Nanomed Nanobiotechnol 2012;4(3):329–343. [DOI] [PubMed] [Google Scholar]
- 23.Jacoby C, Temme S, Mayenfels F, et al. Probing different perfluorocarbons for in vivo inflammation imaging by 19F MRI: image reconstruction, biological half-lives and sensitivity. NMR Biomed 2014;27(3):261–271. [DOI] [PubMed] [Google Scholar]
- 24.Ahrens ET, Bulte JWM. Tracking immune cells in vivo using magnetic resonance imaging. Nat Rev Immunol 2013;13(10):755–763. [DOI] [PMC free article] [PubMed] [Google Scholar]
- 25.Ruiz-Cabello J, Barnett BP, Bottomley PA, Bulte JW. Fluorine (19F) MRS and MRI in biomedicine. NMR Biomed 2011;24(2):114–129. [DOI] [PMC free article] [PubMed] [Google Scholar]
- 26.Bulte JW. Hot spot MRI emerges from the background. Nat Biotechnol 2005;23(8):945–946. [DOI] [PubMed] [Google Scholar]
- 27.Ruiz-Cabello J, Walczak P, Kedziorek DA, et al. In vivo “hot spot” MR imaging of neural stem cells using fluorinated nanoparticles. Magn Reson Med 2008;60(6):1506–1511. [DOI] [PMC free article] [PubMed] [Google Scholar]
- 28.Barnett BP, Ruiz-Cabello J, Hota P, et al. Use of perfluorocarbon nanoparticles for non-invasive multimodal cell tracking of human pancreatic islets. Contrast Media Mol Imaging 2011;6(4):251–259. [DOI] [PMC free article] [PubMed] [Google Scholar]
- 29.Gaudet JM, Ribot EJ, Chen Y, Gilbert KM, Foster PJ. Tracking the fate of stem cell implants with fluorine-19 MRI. PLoS One 2015;10(3):e0118544. [DOI] [PMC free article] [PubMed] [Google Scholar]
- 30.Mahida YR. The key role of macrophages in the immunopathogenesis of inflammatory bowel disease. Inflamm Bowel Dis 2000;6(1):21–33. [DOI] [PubMed] [Google Scholar]
- 31.Rugtveit J, Brandtzaeg P, Halstensen TS, Fausa O, Scott H. Increased macrophage subset in inflammatory bowel disease: apparent recruitment from peripheral blood monocytes. Gut 1994;35(5):669–674. [DOI] [PMC free article] [PubMed] [Google Scholar]
- 32.Srinivas M, Turner MS, Janjic JM, Morel PA, Laidlaw DH, Ahrens ET. In vivo cytometry of antigen-specific t cells using 19F MRI. Magn Reson Med 2009;62(3):747–753. [DOI] [PMC free article] [PubMed] [Google Scholar]
- 33.Ahrens ET, Young WB, Xu H, Pusateri LK. Rapid quantification of inflammation in tissue samples using perfluorocarbon emulsion and fluorine-19 nuclear magnetic resonance. Biotechniques 2011;50(4):229–234. [DOI] [PMC free article] [PubMed] [Google Scholar]
- 34.Ahrens ET, Helfer BM, O’Hanlon CF, Schirda C. Clinical cell therapy imaging using a perfluorocarbon tracer and fluorine-19 MRI. Magn Reson Med 2014;72(6):1696–1701. [DOI] [PMC free article] [PubMed] [Google Scholar]
- 35.Neufert C, Becker C, Neurath MF. An inducible mouse model of colon carcinogenesis for the analysis of sporadic and inflammation-driven tumor progression. Nat Protoc 2007;2(8):1998–2004. [DOI] [PubMed] [Google Scholar]
- 36.Thaker AI, Shaker A, Rao MS, Ciorba MA. Modeling colitis-associated cancer with azoxymethane (AOM) and dextran sulfate sodium (DSS). J Vis Exp 2012 Sep 11;(67). pii: 4100. [DOI] [PMC free article] [PubMed] [Google Scholar]
- 37.Boehm-Sturm P, Mengler L, Wecker S, Hoehn M, Kallur T. In vivo tracking of human neural stem cells with 19F magnetic resonance imaging. PLoS One 2011;6(12):e29040. [DOI] [PMC free article] [PubMed] [Google Scholar]
- 38.Parihar A, Eubank TD, Doseff AI. Monocytes and macrophages regulate immunity through dynamic networks of survival and cell death. J Innate Immun 2010;2(3):204–215. [DOI] [PMC free article] [PubMed] [Google Scholar]
- 39.Liu W, Frank JA. Detection and quantification of magnetically labeled cells by cellular MRI. Eur J Radiol 2009;70(2):258–264. [DOI] [PMC free article] [PubMed] [Google Scholar]
- 40.Harpaz N, Polydorides AD. Colorectal dysplasia in chronic inflammatory bowel disease: pathology, clinical implications, and pathogenesis. Arch Pathol Lab Med 2010;134(6):876–895. [DOI] [PubMed] [Google Scholar]
- 41.Noveck RJ, Shannon EJ, Leese PT, et al. Randomized safety studies of intravenous perflubron emulsion. II. effects on immune function in healthy volunteers. Anesth Analg 2000;91(4):812–822. [DOI] [PubMed] [Google Scholar]
- 42.Watanabe T, Konishi T, Kishimoto J, et al. Ulcerative colitis-associated colorectal cancer shows a poorer survival than sporadic colorectal cancer: a nationwide Japanese study. Inflamm Bowel Dis 2011;17(3):802–808. [DOI] [PubMed] [Google Scholar]
Associated Data
This section collects any data citations, data availability statements, or supplementary materials included in this article.


