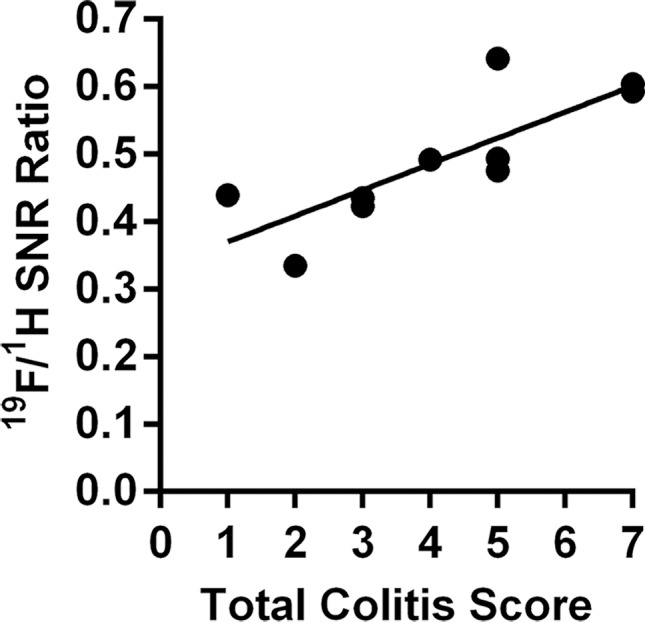
Figure 4c:

Graphs show correlation between normalized 19F SNR (calculated from ex vivo images) and histologic disease scores. Error bars indicate standard error of the mean. (a) Comparison of total colitis score between ascending colon (n = 14) and descending colon (n = 14). The descending colon exhibits significantly higher scores than does the ascending colon (* P = .022). Within the descending colon, segments with 19F signal (gray, n = 10) have significantly higher scores than do those without signal (black, n = 4) (* P = .016). (b) Correlation between normalized 19F SNR and total colitis score in ascending colon segments (n = 6 with 19F signal) (r = 0.88, P = .033). (c) Graph shows correlation between normalized 19F SNR with total colitis score in descending colon segments (n = 10 with 19F signal) (r = 0.82, P = .0058). (d) Graph shows total colitis scores in descending colon segments with either inflammation and dysplasia (n = 7) or only inflammation (n = 7) (*** P = .0025). (e) Graph shows normalized 19F SNR values in descending colon segments with either inflammation and dysplasia or only inflammation (** P = .0023).
