Abstract
Purpose
To determine patient, vendor, and institutional factors that influence computed tomography (CT) radiation dose.
Materials and Methods
The relevant institutional review boards approved this HIPAA-compliant study, with waiver of informed consent. Volume CT dose index (CTDIvol) and effective dose in 274 124 head, chest, and abdominal CT examinations performed in adult patients at 12 facilities in 2013 were collected prospectively. Patient, vendor, and institutional characteristics that could be used to predict (a) median dose by using linear regression after log transformation of doses and (b) high-dose examinations (top 25% of dose within anatomic strata) by using modified Poisson regression were assessed.
Results
There was wide variation in dose within and across medical centers. For chest CTDIvol, overall median dose across all institutions was 11 mGy, and institutional median dose was 7–16 mGy. Models including patient, vendor, and institutional factors were good for prediction of median doses (R2 = 0.31–0.61). The specific institution where the examination was performed (reflecting the specific protocols used) accounted for a moderate to large proportion of dose variation. For chest CTDIvol, unadjusted median CTDIvol was 16.5 mGy at one institution and 6.7 mGy at another (adjusted relative median dose, 2.6 mGy [95% confidence interval: 2.5, 2.7]). Several variables were important predictors that a patient would undergo high-dose CT. These included patient size, the specific institution where CT was performed, and the use of multiphase scanning. For example, while 49% of patients (21 411 of 43 696) who underwent multiphase abdominal CT had a high-dose examination, 8% of patients (4977 of 62 212) who underwent single-phase CT had a high-dose examination (adjusted relative risk, 6.20 [95% CI: 6.17, 6.23]). If all patients had been examined with single-phase CT, 69% (18 208 of 26 388) of high-dose examinations would have been eliminated. Patient size, institutional-specific protocols, and multiphase scanning were the most important predictors of dose (change in R2 = 8%–32%), followed by manufacturer and iterative reconstruction (change in R2, 0.2%–15.0%).
Conclusion
CT doses vary considerably within and across facilities. The primary factors that influenced dose variation were multiphase scanning and institutional protocol choices. It is unknown if the variation in these factors influenced diagnostic accuracy.
© RSNA, 2016
Introduction
Patient radiation doses for computed tomography (CT) vary considerably across institutions, even when comparing imaging for the same clinical indications (1–3). Factors such as patient demographics or institutional preferences about balancing imaging noise and diagnostic image quality could contribute to this variation; however, there is little empirical evidence to illuminate their relative importance. To develop imaging optimization activities that are likely to have a meaningful effect, we must understand the factors that influence CT radiation dose.
The University of California Dose Optimization and Standardization Endeavor (or UC-DOSE) is a collaboration across the five University of California medical centers to assess and optimize CT doses (4). Our hypothesis was that patient, vendor, and institutional factors influence median CT dose and the proportion of examinations that exceed dose benchmarks. The purpose of this analysis was to determine patient, vendor, and institutional factors that influence CT radiation dose.
Materials and Methods
The University of California, San Francisco Committee on Human Research approved the study and waived informed consent. The other institutional review boards relied on this approval. At 12 facilities associated with the University of California medical centers, data for diagnostic CT examinations performed with CT scanners in 2013 were de-identified and were uploaded to one server by using Radimetrics (Bayer, Whippany, NJ) commercial dose-reporting software (5). Data were transferred to a University of California, San Francisco server for analysis, and details have been described previously (4). We excluded CT scans performed for research, radiation oncology, surgical or interventional procedures, or combined positron emission tomography and CT. We analyzed scans of the chest, abdomen (including any scans through the abdomen or pelvis), combined chest and abdomen, and head, reflecting approximately 90% of all diagnostic scans performed during the study period.
Each University of California medical center sees a diverse mix of patients from across the full spectrum of primary through quaternary care. Each center sees a substantial number of patients with cancer or a transplant, hospitalized patients with complex medical and surgical disease, and patients referred from low-acuity community outpatient settings. There is no validated approach to assess the similarity of patients and clinical questions across sites, as it might affect radiation doses; therefore, we used several approaches to assess the relative comparability of patients across hospitals. First, we determined the case mix index, which is a broad indicator of the clinical complexity of illness of hospitalized patients at each hospital (6). Second, we assessed the distribution of CT scans by anatomic area across hospitals. Third, for one clinical indication—imaging for suspected pulmonary embolism—we compared the frequency that this was an indication for scanning and the doses and protocols used across institutions to illustrate different choices made at each hospital for one well-defined clinical question. We picked suspected pulmonary embolism because it is a narrow and specific clinical condition that we believed would be comparable across institutions and because it tends to be imaged by using identifiable protocols, thereby enabling us to assemble and compare protocols across institutions.
The unit of analysis was the encounter, including all irradiating events that were part of the examination. Radimetrics software was used to extract patient, vendor, and institutional variables and dose metrics for each series from Digital Imaging and Communications in Medicine (or DICOM) tags through direct connections with scanners or picture archiving and communication systems.
Patient variables were age (18–29 years, 30–49 years, 50–64 years, and 65 years or older), sex, and patient size, defined as patient diameter measured on the midscan image and classified into one of five categories approximating quintiles for the head or five categories approximating quintiles for the chest or abdomen. For the head, size groups were as follows: 1, smaller than 165 mm; 2, 165–169 mm; 3, 170–174 mm; 4, 175–179 mm; and 5, 180 mm or larger. For the chest, abdomen, and combined chest and abdomen, size groups were as follows: 1, smaller than 250 mm; 2, 250–274 mm; 3, 275–299 mm; 4, 300–324 mm; and 5, 325 mm or larger. Vendor variables were manufacturer (GE Healthcare, Chicago, Ill [13 machines]; Phillips Healthcare, Amsterdam, the Netherlands [two machines]; Siemens, Berlin, Germany [14 machines]; and Toshiba, Tokyo, Japan [one machine]) and whether the scanner was equipped with iterative reconstruction at the time of the examination. Among these were one eight-section scanner and five 16-section scanners; the remaining scanners had at least 64 sections (4). Whether iterative reconstruction was available was known for each CT scanner, but data on whether iterative reconstruction was used were not available.
Institutional characteristics were medical center (University of California, Davis [five machines]; University of California, Irvine [four machines]; University of California, Los Angeles [nine machines]; University of California, San Diego [five machines]; and University of California, San Francisco [seven machines]) that reflects local protocol choice and the use of single- or multiphase scanning for each examination. Single-phase examinations were those with one irradiating event; all other examinations were considered multiphase.
We analyzed four dose metrics: (a) volume CT dose index (CTDIvol) (in milligrays), reflecting the average dose index value within a section in the scanned volume of a phantom; (b) dose-length product (in milligrays·centimeter), reflecting total emitted radiation imparted to the patient; (c) effective dose (in millisieverts), which is proportional to total imparted radiation and is an estimate that accounts for estimated future cancer risk based on irradiated organs; and (d) size-specific dose estimate (SSDE) (in milligrays) (7), a metric similar to CTDIvol, reflecting average adjusted dose index within a section adjusted for patient size. SSDE has been described only in the abdomen (7). The scanners for each series directly reported CTDIvol and dose-length product. To calculate effective dose, Radimetrics software uses the Cristy phantoms library (8), with patients matched to phantoms on the basis of midscan diameter. For each phantom, sets of Monte Carlo simulations are prerun for various scanning protocols with different examination parameters to calculate organ doses. Effective dose was calculated based on organ doses by using published International Commission on Radiological Protection 103 tissue weighting factors (7). SSDE was calculated based on reported CTDIvol and patient diameter at the middle of the CT scan (7). Data were collected for each radiating event and were reported by patient encounter. The number of phases was defined as the number of irradiating events irrespective of the use of contrast material but excluding short bolus scans. When the same anatomic region was imaged multiple times, CTDIvol and SSDE were calculated as the average of each radiating event, and dose-length product and effective dose were summed. Dose metric distributions were assessed by anatomic area and institution and were displayed as modified heat maps, with each examination contributing one line.
For each anatomic area and dose metric (CTDIvol, effective dose, dose-length product, and SSDE), the 75th percentile of the observed values was defined as a benchmark value. A dose metric that exceeded the benchmark value was considered high dose.
Statistical Analysis
The first analysis modeled log dose (a continuous outcome) by using linear regression to evaluate patient, vendor, and institutional factors that enabled us to predict the median dose. Separate models were fit for each anatomic area and dose metric. The dose data were highly skewed because there were large numbers of outliers; thus, we assessed the median rather than the mean. Dose metrics were log transformed to improve distribution symmetry. For each model, we calculated R2, reflecting the proportion of variability in dose explained by the model; a higher R2 value indicated a better fit to the data. For each category of predictor, the adjusted relative median dose was the adjusted median dose for that category divided by the adjusted median dose for the category with the lowest dose. A value close to 1.00 indicates no difference in median dose when compared with the lowest-dose category, and a value of 1.50 indicates a 50% increase in median dose from the lowest-dose group. For each predictor, we also calculated change in R2, estimating the loss of goodness-of-fit if the predictor were to be removed from the overall model. The change in R2 increased as the proportion of dose variability explained by a predictor increased. Thus, the higher the change in R2, the more important the predictor. We calculated the 95% confidence intervals (CIs) for the adjusted relative median dose.
The second analysis used a dichotomous outcome of high dose to reflect whether examinations exceeded the benchmark of the 75th percentile of the dose metric. Specific values defining high dose are provided in Figure 1. We used modified Poisson regression with a robust variance estimate for binary data to evaluate patient, vendor, and institutional factors that enabled us to predict whether patients received a high dose. For each predictor, we estimated the relative likelihood and 95% CI of high-dose examinations given each predictor category compared with the category with the fewest high-dose examinations after adjusting for the other predictors in the model. We also estimated the attributable risk percentage for each predictor to estimate the proportion of high-dose examinations attributable to that predictor (9). For example, if all medical centers replicated the scanning parameters of the institution with the fewest high-dose examinations for that measure, the attributable risk reflects the proportion of high-dose examinations that would be eliminated. Of note, while this determines the effect on dose, it does not take into account whether the change would reduce the diagnostic accuracy or diagnostic acceptability of the images.
Figure 1a:
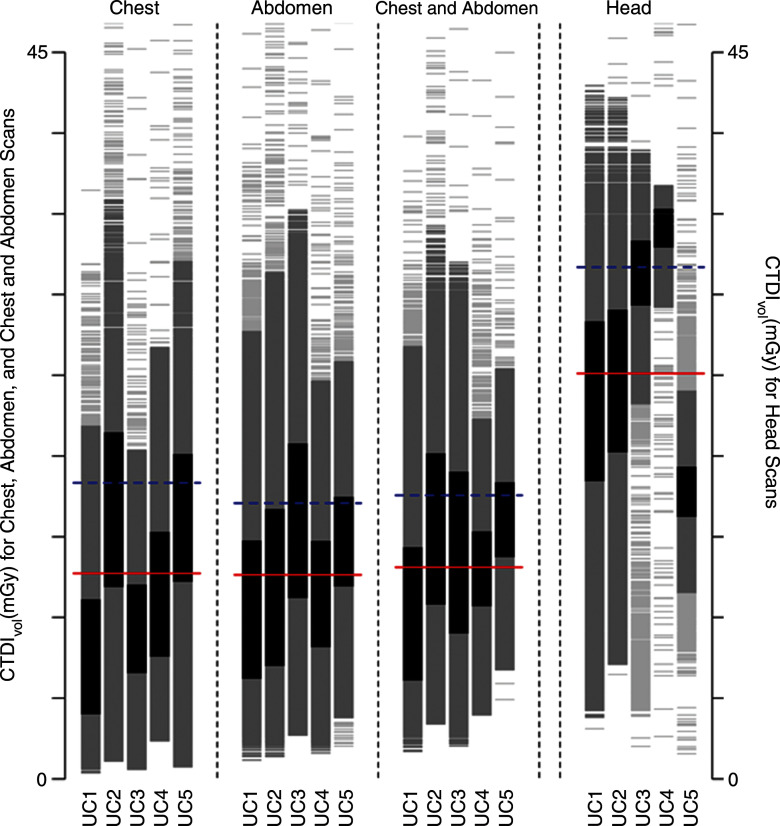
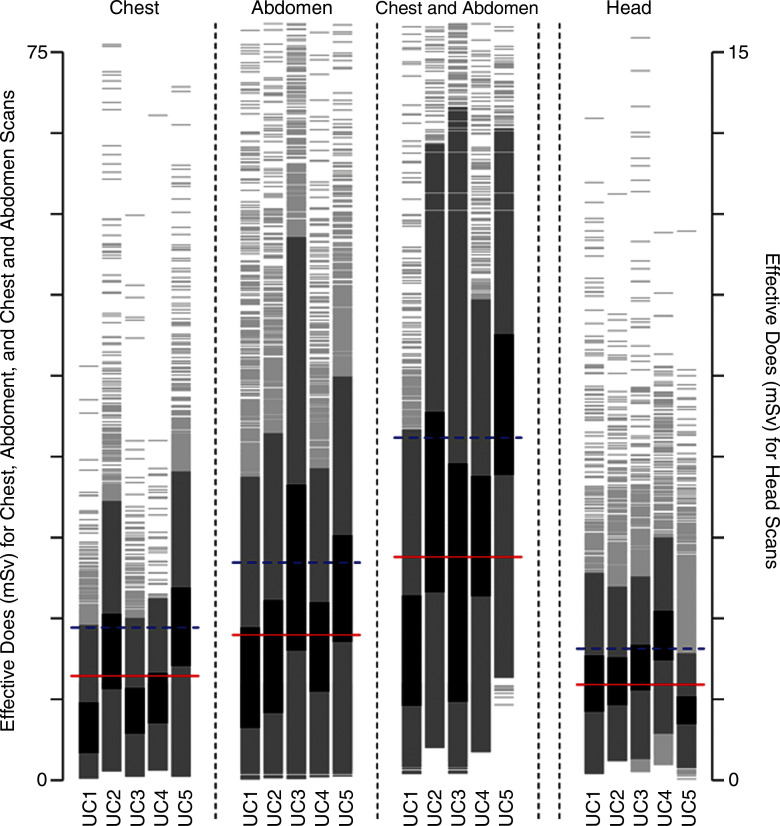
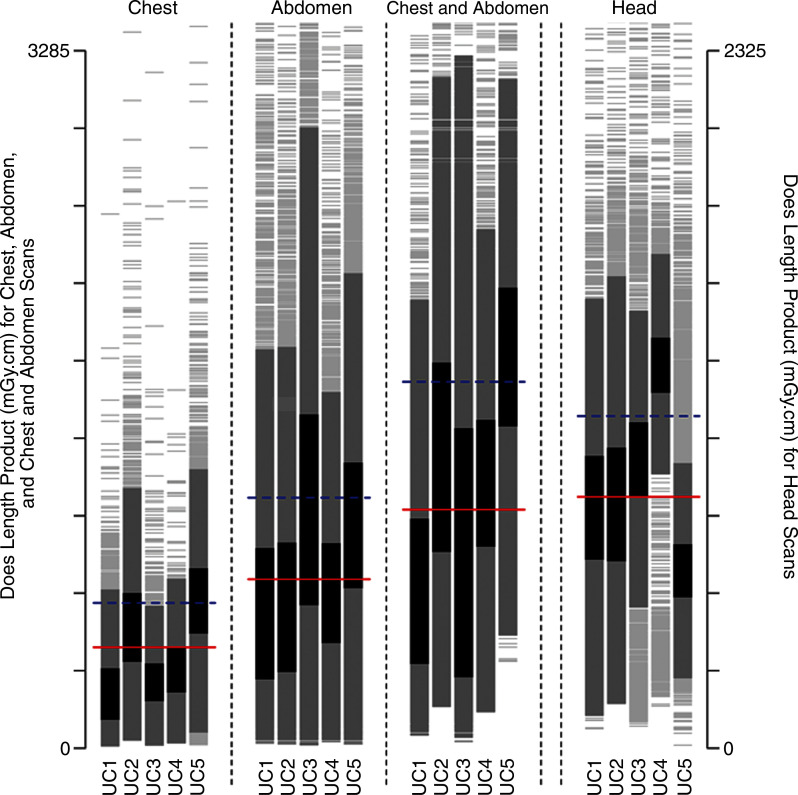
Distribution of dose metrics across the University of California Medical Centers for (a) CTDIvol and (b) effective dose. Vertical lines show the distribution of dose within an institution. Examinations between the 25th and 75th percentiles of each institution are darkest gray; examinations within 1.5 standard deviations of the median are medium gray; remaining examinations are light gray. Red lines show the median dose calculated across the five medical centers; blue lines show the 75th percentile in dose distribution calculated across all medical centers. (c) The 75th percentile in dose was defined for CTDIvol as 17.8 mGy for chest, 17.2 mGy for abdomen, 17.2 mGy for combined chest and abdomen, and 59.4 mGy for head. (d) The 75th percentile in dose was defined for effective dose as 14.9 mSv for chest, 21.2 mSv for abdomen, 33.1 mSv for combined chest and abdomen, and 2.8 mSv for head. The 75th percentile in dose for SSDE was defined as 19.2 mGy. Distribution of dose within each institution and anatomic area is shown with a vertical line, and horizontal lines indicate median dose (red line) and 75th percentile in dose (blue line) calculated across all five University of California medical centers for that anatomic area.
Figure 1b:
Distribution of dose metrics across the University of California Medical Centers for (a) CTDIvol and (b) effective dose. Vertical lines show the distribution of dose within an institution. Examinations between the 25th and 75th percentiles of each institution are darkest gray; examinations within 1.5 standard deviations of the median are medium gray; remaining examinations are light gray. Red lines show the median dose calculated across the five medical centers; blue lines show the 75th percentile in dose distribution calculated across all medical centers. (c) The 75th percentile in dose was defined for CTDIvol as 17.8 mGy for chest, 17.2 mGy for abdomen, 17.2 mGy for combined chest and abdomen, and 59.4 mGy for head. (d) The 75th percentile in dose was defined for effective dose as 14.9 mSv for chest, 21.2 mSv for abdomen, 33.1 mSv for combined chest and abdomen, and 2.8 mSv for head. The 75th percentile in dose for SSDE was defined as 19.2 mGy. Distribution of dose within each institution and anatomic area is shown with a vertical line, and horizontal lines indicate median dose (red line) and 75th percentile in dose (blue line) calculated across all five University of California medical centers for that anatomic area.
Figure 1c:

Distribution of dose metrics across the University of California Medical Centers for (a) CTDIvol and (b) effective dose. Vertical lines show the distribution of dose within an institution. Examinations between the 25th and 75th percentiles of each institution are darkest gray; examinations within 1.5 standard deviations of the median are medium gray; remaining examinations are light gray. Red lines show the median dose calculated across the five medical centers; blue lines show the 75th percentile in dose distribution calculated across all medical centers. (c) The 75th percentile in dose was defined for CTDIvol as 17.8 mGy for chest, 17.2 mGy for abdomen, 17.2 mGy for combined chest and abdomen, and 59.4 mGy for head. (d) The 75th percentile in dose was defined for effective dose as 14.9 mSv for chest, 21.2 mSv for abdomen, 33.1 mSv for combined chest and abdomen, and 2.8 mSv for head. The 75th percentile in dose for SSDE was defined as 19.2 mGy. Distribution of dose within each institution and anatomic area is shown with a vertical line, and horizontal lines indicate median dose (red line) and 75th percentile in dose (blue line) calculated across all five University of California medical centers for that anatomic area.
Figure 1d:
Distribution of dose metrics across the University of California Medical Centers for (a) CTDIvol and (b) effective dose. Vertical lines show the distribution of dose within an institution. Examinations between the 25th and 75th percentiles of each institution are darkest gray; examinations within 1.5 standard deviations of the median are medium gray; remaining examinations are light gray. Red lines show the median dose calculated across the five medical centers; blue lines show the 75th percentile in dose distribution calculated across all medical centers. (c) The 75th percentile in dose was defined for CTDIvol as 17.8 mGy for chest, 17.2 mGy for abdomen, 17.2 mGy for combined chest and abdomen, and 59.4 mGy for head. (d) The 75th percentile in dose was defined for effective dose as 14.9 mSv for chest, 21.2 mSv for abdomen, 33.1 mSv for combined chest and abdomen, and 2.8 mSv for head. The 75th percentile in dose for SSDE was defined as 19.2 mGy. Distribution of dose within each institution and anatomic area is shown with a vertical line, and horizontal lines indicate median dose (red line) and 75th percentile in dose (blue line) calculated across all five University of California medical centers for that anatomic area.
While change in R2 (for median dose) and attributable risk (for proportion of high-dose examinations) both measured the importance of predictors on a scale of 0 to 1, they had different interpretations. Change in R2 measured how much variation in dose a given predictor explained; attributable risk measured reduction in high-dose examinations expected if all examinations used the predictor value associated with the fewest high-dose examinations (eg, if all examinations were performed at the institution with the fewest high-dose examinations). We categorized change in R2 and attributable risk as small (<10%), moderate (range, 10%–25%), or large (>25%). To show how R2 and attributable risk contribute to understanding the effect of a predictor on dose distribution, we graphed expected changes in dose distribution after adjusting for patient, vendor, and institutional factors.
We assessed the association between the institutional case mix index and median effective dose by using two simple linear models for each anatomic area. One model compared institutional case mix index to crude median dose, and the other compared institutional case mix index to its effect in the covariate-controlled log median effective dose model described previously.
Results for dose-length product and effective dose were nearly identical. Thus, only results for effective dose are shown. The results for combined chest and abdomen scans were similar to the results for abdominal scans alone and are not shown. The CIs for the adjusted relative median dose and the change in R2 were narrow (generally a few percentage points and at most 5%) and are not shown in the tables. All analyses were performed with R software (R Foundation for Statistical Computing, Vienna, Austria). To ensure the confidentiality of institutions, we identified the hospitals as UC A through UC E in Table 1 and as UC1 through UC5 in the remaining tables and figures.
Table 1.
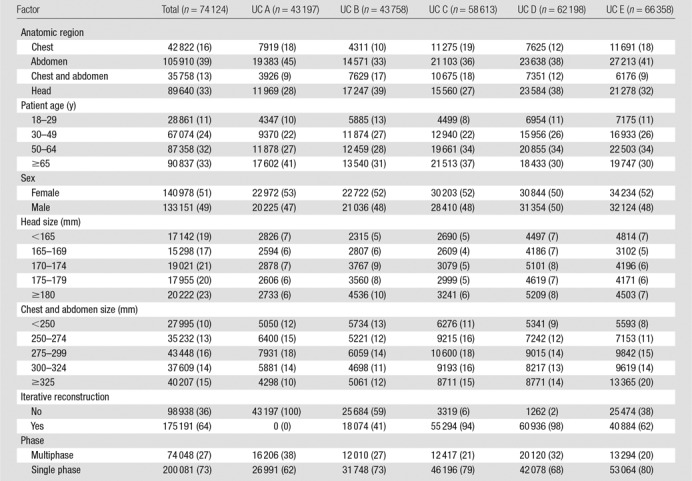
Patient, Vendor, and Institutional Factors for Included CT Scans at Each of the Included Hospitals
Results
In this study, we analyzed 274 124 CT scans performed in adults in 2013. Of these, 16% (n = 42 822) were chest scans, 39% (n = 105 910) were abdominal scans, 13% (n = 35 758) were combined chest and abdominal scans, and 33% (n = 89 640) were head scans (Table 1). Just over half of the scans were performed in women. GE Healthcare scanners were used in 55% (n = 151 212) of examinations and Siemens scanners were used in 29% (n = 79 489); furthermore, 64% (n = 175 191) of examinations were performed with scanners equipped with iterative reconstruction. Individual medical centers contributed 16%–24% of examinations. Overall, 27% (n = 74 048) of examinations were performed with multiphase techniques, ranging from 20% (13 294 of 66 358) of examinations at UC5 to 38% (16 206 of 43 197) of examinations at UC1. The use of multiphase scans varied from 10% (9216 of 89 638) for head CT to 41% (43 696 of 105 908) for abdominal CT.
Comparability of Patients across Institutions
The case mix index ranged from 1.64 to 2.02 across hospitals. The distribution of patient variables and scanned areas is shown in Table 1. For example, across the five institutions, 16% (42 822 of 274 124) of the examinations were of the chest, and this ranged from 10% (4311 to 43 758) at UC2 to 19% (11 275 to 58 613) at UC3. For the specific indication of imaging for pulmonary embolism, 6%–8% of scans were performed to assess for the presence of a pulmonary embolism across hospitals. Within examinations performed with a protocol designated as a pulmonary embolism protocol, the median CTDIvol varied approximately twofold across institutions (range, 10–18 mGy), and the median effective dose varied approximately threefold across institutions (range, 7–20 mSv).
The distribution of dose by institution and anatomic area is shown in Figure 1. We observed wide variation in dose within and across medical centers. For example, for chest CTDIvol, the median dose across all institutions was 11 mGy, and the 75th percentile was 18 mGy. At UC1, the median dose was 7 mGy, which was far less than the overall median dose, whereas at UC2, the median dose was 16 mGy, which was far greater than the median dose. The variation in observed doses was greater for effective dose than for CTDIvol. For example, for combined chest and abdominal CT, the median dose was 22 mSv, and the 75th percentile in dose was 33 mSv. At UC1, most patients had doses lower than the median dose, whereas at UC5, most patients had doses above the 75th percentile.
Strength of the Models in Prediction of Median Dose
The models including patient, vendor, and institutional factors were good in the prediction of median doses and were more accurate in the prediction of doses in the chest and abdomen (R2 range, 50%–61%) than in the head (R2 range, 31%–43%). In the abdomen, the model predicted a larger proportion of dose variation for CTDIvol than for SSDE (R2 = 50% and R2 = 31%, respectively).
Specific Patient, Vendor, and Institutional Factors That Enable Prediction of Median CTDIvol
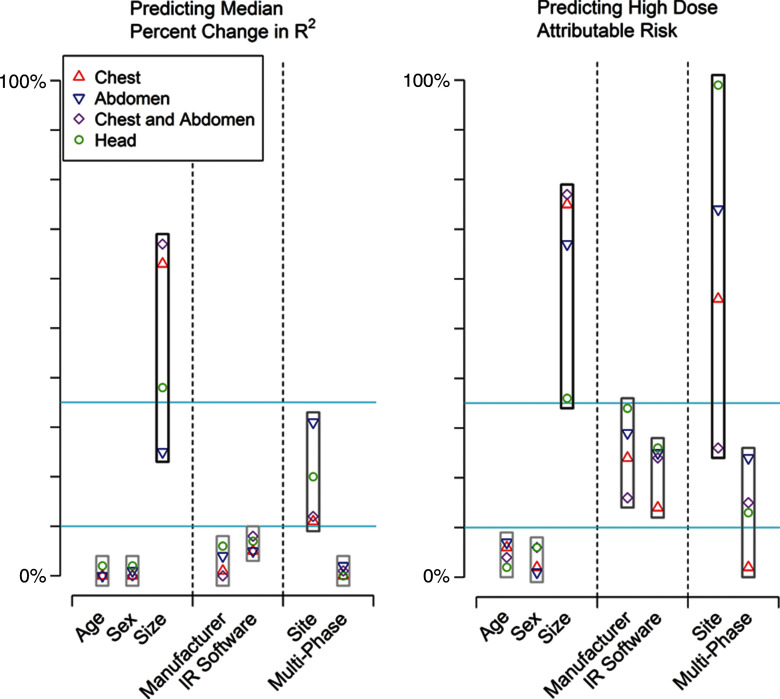
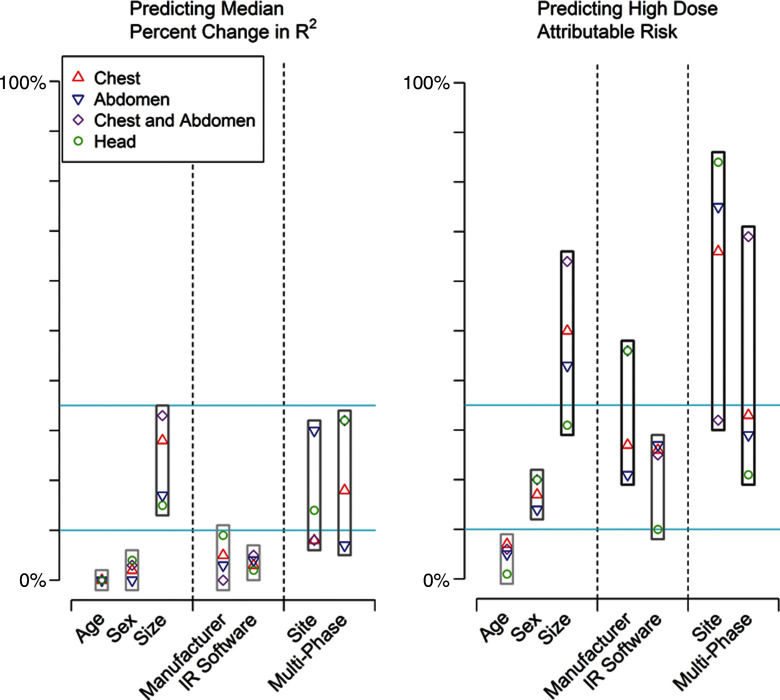
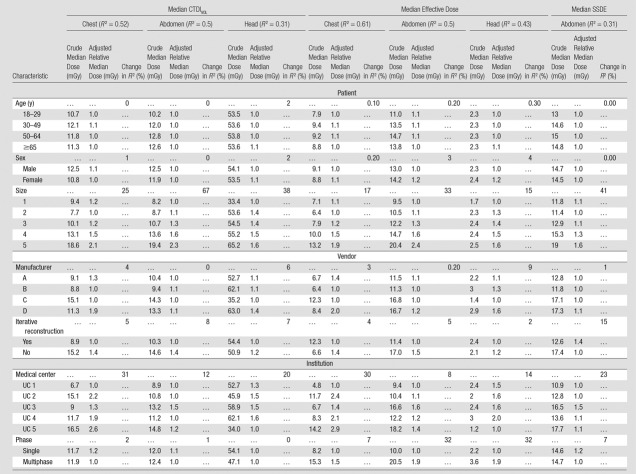
The importance of the specific factors in explaining the variation in median CTDIvol is shown in Figure 2a. Patient sex and age were not important contributors to median CTDIvol. Crude and adjusted relative median values were similar across all age and sex categories, and when age and sex were excluded from the model, the change in R2 was small (<2% for all). In contrast, patient size accounted for a moderate to large proportion of dose variation. Crude and adjusted median dose values in the largest patients were approximately twice as high as those in the smallest patients, and exclusion of size from the models resulted in moderate to large changes in R2 values across the different anatomic areas (ie, size is an important variable when explaining dose variation). For example, median chest CTDIvol was 18.6 mGy in the largest patients (group 5) and 9.4 mGy in the smallest patients (group 1). The adjusted relative median dose was around twice as high in the largest patients (adjusted relative median dose, 2.05 mGy; 95% CI: 2.02, 2.09), and the change in R2 was 25% when size was not included in the model.
Figure 2a:
Importance of patient, vendor, and institutional variables in explaining variation in median change in R2 and high dose as attributable risk. IR = iterative reconstruction. For median (a) CTDIvol and (b) median effective dose, we categorized change in R2 and attributable risk as small (<10%), moderate (10%–25%), or large (>25%). Blue lines correspond to 10% and 25% values.
Figure 2b:
Importance of patient, vendor, and institutional variables in explaining variation in median change in R2 and high dose as attributable risk. IR = iterative reconstruction. For median (a) CTDIvol and (b) median effective dose, we categorized change in R2 and attributable risk as small (<10%), moderate (10%–25%), or large (>25%). Blue lines correspond to 10% and 25% values.
Vendor factors (manufacturer and iterative reconstruction) had a relatively small overall effect on variability in median dose (Table 2). When manufacturer or iterative reconstruction was omitted from the models, changes in R2 were small, ranging from 0% to 15%. For example, for abdominal CTDIvol, unadjusted median CTDIvol was 13.3 mGy for manufacturer D and 10.4 mGy for manufacturer A (adjusted relative median dose, 1.09; 95% CI: 1.08, 1.10).
Table 2.
Patient, Vendor, and Institutional Predictors of Median Dose
Note.—When calculating the adjusted relative median dose, the reference group is the institution with the lowest adjusted median dose, not the institution with the lowest crude median dose.
The specific institution where the examination was performed (this reflects the choice of specific protocols) accounted for a moderate to large proportion of dose variation. For example, for chest CTDIvol, unadjusted median CTDIvol was 16.5 mGy at UC5 and 6.7 mGy at UC1, the adjusted relative median dose was 2.6 (95% CI: 2.5, 2.7), and when the specific institution was excluded from the models, the change in R2 was 31%.
Patient, Vendor, and Institutional Factors That Enable Prediction of Median Effective Dose
The same factors that were important for explaining the variation in CTDIvol were also important for explaining the variation in effective dose (Table 2). Multiphase scanning explained a moderate to large amount of variation in effective dose. Unadjusted median values were approximately two times higher for multiphase scanning than for single-phase scanning, and when use of multiphase scanning was omitted from the model, there were moderate to large changes in the R2 value. For example, in the abdomen, while the unadjusted median effective dose was 20.5 mSv with multiphase scanning, it was 10.0 mSv with single-phase scanning (adjusted relative median dose, 1.89; 95% CI: 1.88, 1.90), and when use of multiphase scanning was excluded from the model, the change in R2 was 32%.
Patient, Vendor, and Institutional Factors That Enable Prediction of Median SSDE
While patient age did not explain the variation in SSDE, both patient size and institution remained important predictors of dose variation in SSDE, accounting for 41% and 23%, respectively, of the change in R2 when omitted from the models (Table 2).
Predictors of High Doses
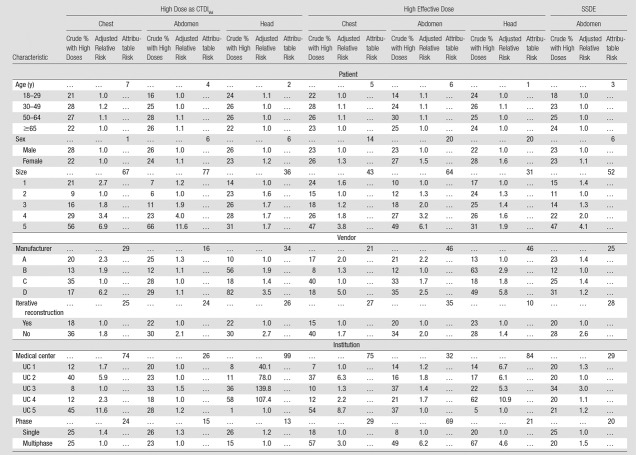
The same patient, vendor, and institutional factors that were important predictors of median dose were also significant predictors of high doses (Table 3). The variable with the largest attributable risk (meaning that this variable had the strongest association with a patient receiving a high-dose examination) was the specific institution where the examination was performed. For example, for head CTDIvol (Table 3), 58% (2500 of 4311) of patients at UC4 had a high-dose examination compared with only 1% (79 of 7919) of patients at UC5 (adjusted relative risk, 107%; attributable risk, 99%). If all medical centers replicated the scanning parameters of the institution with the fewest high-dose examinations, 74% of chest (7933 of 10 720), 26% of abdominal (6846 of 26 330), and 99% of head (21 977 of 22 199) high-dose examinations would be eliminated.
Table 3.
Patient, Vendor, and Institutional Predictors of High Dose
Note.—When calculating the adjusted relative risk, the reference group is the institution with the lowest adjusted proportion of high-dose examinations, not the institution with the lowest crude proportion of high-dose examinations.
Patient size (attributable risks range, 31%–77% across models), multiphase scanning (attributable risks range, 13%–29% across models), manufacturer (attributable risks range, 16%–46% across models), and iterative reconstruction (attributable risks range, 10%–28% across models) were also important predictors of high-dose examinations. For example, for effective dose, while 49% (21 411 of 43 696) of patients who underwent multiphase abdominal CT had a high-dose examination, 8% (4977 of 62 212) of patients who underwent single-phase CT had a high-dose examination (adjusted relative risk, 6.20; 95% CI: 6.17, 6.23), and if all patients had been scanned with single-phase CT, 69% (18 208 of 26 388) of high-dose examinations would have been eliminated (Table 3).
Overall Importance of the Different Factors at Explaining Dose Variation
The relative ranking of the importance of the variables at explaining median and high-dose examinations is shown in Figure 2. Patient size, institution-specific protocols as chosen at different sites, and use of multiphase scanning were the most important predictors of dose, followed by manufacturer and iterative reconstruction. The case mix number of an institution did not show a clinically or statistically significant association with the crude median effective dose or covariate-adjusted effect on log median effective dose at that institution (P values comparing case mix index and dose ranged from 0.31 to 0.99.) Thus, a measure of the clinical complexity of illness of hospitalized patients did not contribute to differences in median dose.
Discussion
We found that radiation doses for chest, abdominal, combined chest and abdominal, and head CT varied widely across medical centers. A large amount of the variation could be explained by a combination of patient and vendor factors, how the equipment was used, and the protocols set up and adopted at each medical center. While patient size was an important predictor of median and high-dose examinations, dose varied substantially after accounting for patient size. Multiphase scanning, iterative reconstruction capability, and most importantly, institutional choice of scanning parameters were at least as influential as patient size in predicting dose. Additional work is needed to understand what strategies the sites with the lowest doses used to achieve these lower doses (such as review of the use of multiphase scanning) and the tradeoffs they accepted (such as accepting images with more noise and less clarity) to achieve lower doses for specific anatomic areas. Such attention to dose reduction and dose management at the institutional level is likely to have the greatest effect on dose optimization. Furthermore, the required inclusion of more variables in the Digital Imaging and Communications in Medicine header would facilitate analysis and optimization across hospitals.
We focused broadly on factors that influence dose and variation within and across institutions. The optimization of protocol selection and scanning parameters in individual patients is important, as is the broad assessment of institutional practice and doses among large groups of patients. In the latter approach, physicians are able to learn when they are using CT doses similar to those used by their peers at other institutions. Assessment of doses in the entire population reflects not only doses within narrowly defined protocols but also assignment of patients to different protocols. Thus, to understand doses for abdominal CT scans, it is important not only to assess doses within single- and four-phase CT scans, but also to understand how many patients are examined with these protocols. There are several examples where institutional-level dose assessment, as outlined in this article, has led to measurable dose reductions. For example, in an audit conducted across eight departments in Luxembourg, Tack et al (10) achieved substantial optimization in doses as a result of their audits with this approach. There are no validated measures in radiology to quantify case mix across institutions that we could use to ensure the different medical centers evaluated patients with similar clinical needs. However, we used several approaches to determine if the case mix was relatively similar. For instance, we compared the case mix index, distribution in anatomic areas scanned, and indication for imaging across sites, and we reviewed institutional decisions on how to scan patients with pulmonary embolism. These all suggested that the case mix was broadly similar across sites but that each institution made different decisions about how to scan patients with well-defined symptoms. Thus, for the example of pulmonary embolism, it was not the case mix of how many patients were suspected of having pulmonary embolism that influenced chest doses as much as it was the choices individual medical centers made for this indication that primarily influenced dose. However, it is important to note that we did not assess diagnostic quality of the images, and we do not know, even for the example of evaluation of pulmonary embolism, if the quality of images was comparable across institutions. To the degree to which the case mix did vary across institutions and to the degree to which this influences dose, the differences in dose we assigned to institutional variation could reflect differences in patients.
What can institutions do to optimize CT doses? First, they should develop target dose levels according to patient size to ensure use of the minimum necessary dose. A large proportion of high doses were due to larger patients, even when SSDE, which partially adjusts for size, was the dose metric. We also found a large proportion of high-dose studies were the result of multiphase scanning. Multiphase scanning has a high attributable risk, so more prudent use of this method would substantially reduce the number of patients with doses that exceed benchmarks. Radiologists can review the cases in which they routinely use multiphase scanning and decide if they can instead use single-phase scanning for some of those indications without loss of diagnostic information. The presence of iterative reconstruction capability had only a modest effect on high-dose examinations and an even smaller effect on median dose. However, this variable reflected only whether iterative reconstruction was installed on a machine, not whether it was used or used correctly. Given that iterative reconstruction must be applied with a systematic approach so that protocols are optimized with iterative reconstruction in mind, it is important to understand its effect in actual practice. Further assessment of its effect across a larger number of diverse clinical settings should be conducted. Ideally, this assessment would be stratified by whether iterative reconstruction is used correctly and optimally. Currently, manufacturers do not routinely record the use or parameters of iterative reconstruction in the Digital Imaging and Communications in Medicine header, making it impossible to determine whether or not it was used or how it was used. Our results suggest, however, that in practice, the presence of iterative reconstruction alone has only a modest effect on dose.
Our results obtained by using CTDIvol and effective dose metrics were similar but not identical. For example, multiphase scanning had a moderate to large influence on examinations performed with average or high effective dose, but it was not highly predictive of CTDIvol. Patient sex had only a small effect on CTDIvol but a larger effect on effective dose. These differences may reflect the weighting used to calculate effective dose (11): women have higher effective doses than do men at the same CTDIvol because of breast cancer risk. Patient, vendor, and institutional factors did not explain as much variation in median dose or high-dose examinations performed with the SSDE metric compared with those performed with the CTDIvol metric. This difference may be because SSDE already accounts for size. However, machine and institutional variables were similarly important in predicting median dose and high-dose examinations, and the ranking of the importance of these variables was the same whether the dose metric was SSDE or CTDIvol.
Our study had limitations. Our estimate of patient size was crude but reasonable for characterization of the primary determinant of dose. We did not have detailed reasons for each scan, so true underlying differences in patient indications for imaging as a contributor to the difference in doses cannot be assessed. However, the case mix number of an institution did not show a clinically or statistically significant association with median dose at that institution. Although we are confident that changing variables suggested by the attributable risk models, such as reducing multiphase scanning and adding iterative reconstruction, would change dose distributions, unmeasured confounding could make the actual effect smaller than our estimates. For example, machines with iterative reconstruction may also represent machines with newer technology, so dose efficiency we attributed to iterative reconstruction could have been due to other independent factors. Although our sample was large, the number of medical centers and scanners was relatively small, and collinearity between site and vendor may have diminished our accuracy in assigning importance to institution versus manufacturer. We assessed only manufacturer, not the model, number of detectors, or age of the scanner, and these factors might have influenced scanning protocols and doses. Lastly, we were unable to measure diagnostic image quality or accuracy relative to dose and subsequent patient outcomes; thus, we do not know if lowering doses to the best performing site for each comparison would result in unacceptable loss of diagnostic information.
In summary, our results show substantial variation in CT radiation dose that is unrelated to patient size. Institutions that want to optimize patient dose and reduce dose variation can optimize scanning protocols by learning from peer institutions, reducing the use of multiphase studies, adjusting protocols for patient size, and considering adoption of iterative reconstruction.
Advances in Knowledge
■ Patient, vendor, and institutional factors influence CT radiation dose metrics, and together they account for approximately 50% of dose variability across imaging facilities.
■ In addition to patient size, multiphase scanning is the most important predictor of median CT dose and a high-dose examination.
■ Institutional variability remains substantial, even after accounting for other predictors, and outranks most predictors in terms of importance; for example, if all medical centers replicated the scanning parameters used in the institution with the fewest high-dose examinations, by volume CT dose index values, 74%, 26%, and 99% of high doses would be eliminated in the chest, abdomen, and head, respectively.
■ Attention to dose reduction and dose management at the institutional level is likely to have the greatest effect on improved optimization.
Implication for Patient Care
■ As imaging facilities seek to optimize the doses used in CT scanning, minimizing the use of multiphase scanning and adopting reduced-dose protocols are the most effective steps that facilities can take to reduce median dose and the number of high-dose examinations.
Received June 24, 2015; revision requested August 5; revision received January 21, 2016; accepted February 5; final version accepted April 20.
Supported by the Center for Health Quality and Innovation, The University of California Office of the President, the National Cancer Institute (R01CA181191), and the Patient-Centered Outcomes Research Institute (CD-1304-7043). The work is solely the responsibility of the authors and does not necessarily represent the views of the Patient-Centered Outcomes Research Institute, its Board of Governors or Methodology Committee.
Disclosures of Conflicts of Interest: R.S. disclosed no relevant relationships. Y.W. disclosed no relevant relationships. T.R.N. disclosed no relevant relationships. M.M. disclosed no relevant relationships. N.W. disclosed no relevant relationships. R.G. disclosed no relevant relationships. A.S. Activities related to the present article: disclosed no relevant relationships. Activities not related to the present article: is a Bayer-Radimetrics advisory board member, with supported travel costs to one meeting. Other relationships: disclosed no relevant relationships. J.M.B. Activities related to the present article: disclosed no relevant relationships. Activities not related to the present article: disclosed no relevant relationships. Other relationships: holds patent 7,627,079, with royalties received from Samsung. M.K. disclosed no relevant relationships. R.L. disclosed no relevant relationships. D.J.H. disclosed no relevant relationships. D.L.M. disclosed no relevant relationships.
Abbreviations:
- CI
- confidence interval
- CTDIvol
- volume CT dose index
- SSDE
- size-specific dose estimate
References
- 1. Smith-Bindman R , Lipson J , Marcus R , et al . Radiation dose associated with common computed tomography examinations and the associated lifetime attributable risk of cancer . Arch Intern Med 2009. ; 169 ( 22 ): 2078 – 2086 . [DOI] [PMC free article] [PubMed] [Google Scholar]
- 2. Smith-Bindman R , Miglioretti DL , Johnson E , et al . Use of diagnostic imaging studies and associated radiation exposure for patients enrolled in large integrated health care systems, 1996–2010 . JAMA 2012. ; 307 ( 22 ): 2400 – 2409 . [DOI] [PMC free article] [PubMed] [Google Scholar]
- 3. Lukasiewicz A , Bhargavan-Chatfield M , Coombs L , et al . Radiation dose index of renal colic protocol CT studies in the United States: a report from the American College of Radiology National Radiology Data Registry . Radiology 2014. ; 271 ( 2 ): 445 – 451 . [DOI] [PMC free article] [PubMed] [Google Scholar]
- 4. Smith-Bindman R , Moghadassi M , Wilson N , et al . Radiation doses in consecutive CT examinations from five University of California medical centers . Radiology 2015. ; 277 ( 1 ): 134 – 141 . [DOI] [PMC free article] [PubMed] [Google Scholar]
- 5. Radimetrics Enterprise Platform. Bayer Web site. https://www.radiologysolutions.bayer.com/products/ct/dosemanagement/rep/. Updated June 2016. Accessed June 29, 2016 .
- 6. Case Mix Index. Centers for Medicare and Medicaid Services Web site. https://www.cms.gov/Medicare/Medicare-Fee-for-Service-Payment/AcuteInpatientPPS/Acute-Inpatient-Files-for-Download-Items/CMS022630.html. Accessed June 29, 2016 .
- 7. American Association of Physicists in Medicine . American Association of Physicists in Medicine Report No. 204—Size-specific dose estimates (SSDE) in pediatric and adult body CT examinations . Alexandria, Va: : American Association of Physicists in Medicine; , 2011. . [Google Scholar]
- 8. Cristy M . Mathematical phantoms representing children of various ages for use in estimates of internal dose . U.S. Nuclear Regulatory Commission Rep. NUREG/CR-1159 (also Oak Ridge National Laboratory Rep. ORNL/NUREG/TM-367) . 1980. . [Google Scholar]
- 9. Spiegelman D , Hertzmark E , Wand HC . Point and interval estimates of partial population attributable risks in cohort studies: examples and software . Cancer Causes Control 2007. ; 18 ( 5 ): 571 – 579 . [DOI] [PubMed] [Google Scholar]
- 10. Tack D , Jahnen A , Kohler S , et al . Multidetector CT radiation dose optimisation in adults: short- and long-term effects of a clinical audit . Eur Radiol 2014. ; 24 ( 1 ): 169 – 175 . [DOI] [PubMed] [Google Scholar]
- 11. The 2007 Recommendations of the International Commission on Radiological Protection. ICRP publication 103 . Ann ICRP 2007. ; 37 ( 2-4 ): 1 – 332 . [DOI] [PubMed] [Google Scholar]


