

Abstract
Stress granules (SGs) are cytoplasmic ribonucleoprotein aggregates that are directly connected with the translation initiation arrest response to cellular stresses. Translation inhibition (TI) is observed in transient brain ischemia, a condition that induces persistent TI even after reperfusion, i.e. when blood flow is restored, and causes delayed neuronal death (DND) in selective vulnerable regions. We previously described a connection between TI and DND in the hippocampal cornu ammonis 1 (CA1) in an animal model of transient brain ischemia. To link the formation of SGs to TI and DND after brain ischemia, we investigated SG induction in brain regions with differential vulnerabilities to ischemia-reperfusion (IR) in this animal model. SG formation is triggered by both eukaryotic translation initiation factor (eIF) 2α phosphorylation and eIF4F complex dysfunction. We analyzed SGs by immunofluorescence colocalization of granule-associated protein T-cell internal antigen-1 with eIF3b, eIF4E, and ribosomal protein S6 and studied eIF2 and eIF4F complex. The results showed that IR stress induced SG formation in the CA1 region after 3-day reperfusion, consistent with TI and DND in CA1. SGs were formed independently of eIF2α phosphorylation, and their appearance was correlated with a decrease in the levels of eIF4F compounds, the cap-binding protein eIF4E, and eIF4B, suggesting that remodeling of the eIF4F complex was required for SG formation. Finally, pharmacological protection of CA1 ischemic neurons with cycloheximide decreased the formation of SGs and restored eIF4E and eIF4B levels in CA1. These findings link changes in eIF4B and eIF4E to SG induction in regions vulnerable to death after IR.
Keywords: brain, cell death, eukaryotic initiation factor 4B (eIF4B), eukaryotic translation initiation factor 4E (eIF4E), hippocampus, ischemia, stress granule, translation initiation, translation regulation
Introduction
Stress granules (SGs)3 are cytoplasmic aggregates composed of stalled translation preinitiation complexes. SG formation is induced under stress conditions that are known to inhibit translation initiation such as oxidative stress, heat shock, viral infection, and inhibition of the proteasome (1–3). The SGs contain components of translationally silent preinitiation complexes that include the small ribosomal subunit (40S); early translation initiation factors eIF3, eIF4A, eIF4E, and eIF4G; and poly(A)-binding protein 1 as well as several RNA-binding proteins resulting in an accumulation of untranslated messenger ribonucleoproteins (mRNPs) (4, 5). Notably, these mRNPs specifically contain aggregation-prone proteins, such as T-cell internal antigen-1 (TIA-1), TIA-1-related protein, and G3BP that nucleate the assembly of SGs (1, 2). Under different stress conditions, SG formation can be triggered by (i) phosphorylation of the α-subunit of eIF2 (eIF2α) at the Ser51 site (1, 6), (ii) inhibition of ternary complex independently of eIF2α phosphorylation by depleting eIF2 or preventing its association with Met·tRNAiMet (7), or (iii) interference with the activity of eIF4F complex such as reductions in the levels of eIF4A, eIF4B, eIF4E, or eIF4G (7–9). SGs are implicated in translation initiation regulation by sequestering the translational machinery and have been proposed as mediators of a selective translational silencing to integrate the cellular response to stress (10).
Brain ischemia produces severe metabolic stress, and cells respond with the inhibition of translation. When brain reperfusion is initiated after ischemia and energy metabolism is restored, translation arrest persists in the ischemia-affected areas, although translational rates are restored later in resilient regions of the brain (11, 12). However, translation inhibition persists in selective areas, mainly in the regions of penumbra in focal ischemia and in the hippocampal cornu ammonis 1 (CA1) region in global ischemia (13–15). In these vulnerable regions, neuronal degeneration known as delayed neuronal death occurs (16–18). Thus, persistent translation inhibition strictly correlates with delayed neuronal death in vulnerable neurons at later reperfusion following both focal and global ischemia (13–15, 19, 20).
It is well known that protein synthesis is blocked at the translation initiation stage during ischemia-reperfusion (IR) (19, 21). Given that IR induces the stress response, the expression of stress proteins will be selectively regulated, and formation of SGs, as pivotal RNA granules in the response to cell stress, should have an important role in this pathology. The sequestration of ribosomes in insoluble protein aggregates during reperfusion after global and focal brain IR in the course of translation arrest has been reported (22, 23). In addition, sequestration of polyadenylated mRNAs in granular structures (mRNA granules) in neurons following IR has been described (24). These granular structures, like protein aggregates, were formed reversibly in surviving neurons and irreversibly in dying neurons (24). It has been proposed that these aggregates may be a potential cause of the lack of recovery of normal protein synthesis in reperfused CA1 (19). However, to date, a specific induction of SGs in vulnerable neurons in addition to translation arrest and delayed neuronal death after IR stress has not been observed. Our aim was to study SG formation at later reperfusion following global brain ischemia, comparing the vulnerable hippocampal CA1 region with two ischemia-resistant brain regions, the cerebral cortex and hippocampal CA3 region. Additionally, we studied the mechanisms of SG formation under IR stress. Our results showed the induction of SGs specifically in the reperfused CA1 region in relationship with translational arrest; and indeed both results correlated with neuronal death (20). We propose that SG formation is triggered by remodeling eIF4F complex components after IR stress, specifically the decrease of the expression of eIF4B, the eIF4A-activating protein along with the decrease in the levels of the cap-binding protein eIF4E. Furthermore, pharmacologically induced protection of ischemic neurons decreased the number of SGs and restored the levels of eIF4E and eIF4B in the CA1 region, results that were in accordance with translation recovery and neuronal survival described previously (20).
Results
Specific Induction of SGs in the Hippocampal Cornu Ammonis 1 Region after Ischemia-Reperfusion
Given that SGs are closely related to translation inhibition, we decided to study whether there was a differential induction of SGs between the vulnerable CA1 region and the resilient brain regions, the cerebral cortex and hippocampal CA3 region. The study was performed at 3 days of reperfusion after ischemia (R3d) when we have previously described that delayed neuronal death occurs in correlation with translation inhibition in vulnerable regions (20). The study was performed by double immunofluorescence staining for classical SG markers: eIF3b, eIF4E, S6, and TIA-1 (2, 5). First, we examined the b-subunit of eIF3 (eIF3b) and TIA-1 by double labeling. TIA-1 is a nuclear protein that translocates to the cytoplasm and forms punctate aggregates distinctive for SGs, and eIF3 is a component of the preinitiation complex and a robust and specific marker for SGs (2, 4, 5). In the sham control (SHC3d), a diffuse signal for eIF3b was located in the cytoplasm and nucleus of the cortical and hippocampal regions; TIA-1 was mainly localized in the nucleus of the cortical and hippocampal regions (Fig. 1A, SHC3d control panels). The merged images showed colocalization of eIF3b/TIA-1 in punctate aggregates in the cytoplasm specific for SGs (Fig. 1A, arrows). R3d induced a significant increase in the number of cells with eIF3b/TIA-1 colocalizing into SGs in the CA1 region (Fig. 1), whereas no significant changes were found in the cortex and CA3 regions induced by IR stress. The number of cells harboring SGs in the CA1 R7d group was greater than in the CA1 R3d group (Fig. 1B).
FIGURE 1.

Identification of SGs by colocalization analysis of eIF3b and TIA-1 in the cerebral cortex and hippocampal CA1 and CA3 regions. A, brain sections of the cerebral cortex (C) or hippocampal CA1 or CA3 regions from control (SHC3d), R3d, and R7d animals were used for eIF3b and TIA-1 colocalization by confocal fluorescence microscopy for identification and quantification of the cells harboring SGs. eIF3b was labeled with Alexa Fluor 488 secondary antibody (in green), and TIA-1 was labeled with rhodamine Red-X secondary antibody (in red). Green and red channels were merged, and eIF3b/TIA-1 colocalization showed punctate aggregates in yellow as SGs (arrows). The nuclei stained with Hoechst are blue. This figure shows representative results from three to four different animals. The scale bar is in μm. B, the bar diagram represents the quantification of the number of cells harboring SGs per field (eIF3b/TIA-1 colocalization in ≥1 granule/cell). Bars represent the mean ± S.D. of three to four independent animals analyzed. Error bars represent S.D. ***, p < 0.001 and *, p < 0.05, CA1 R7d and R3d compared with CA1 SHC3d; $, p < 0.05, CA1 R7d compared with CA1 R3d.
Furthermore, we analyzed the colocalization of eIF4E and TIA-1 by double labeling. eIF4E is a initiation factor that is part of the SG core (2, 4, 5). In SHC3d, eIF4E was primarily located in the cytoplasm of both cortical and hippocampal regions (Fig. 2A, SHC3d panels). The merged images showed colocalization of eIF4E/TIA-1 in punctate aggregates in the cytoplasm specific for SGs (Fig. 2A, arrows). The analysis of eIF4E/TIA-1 colocalization into SGs confirmed a significant induction of SGs in R3d in the CA1 region compared with the control situation, whereas induction of SGs was not found in the cortex or in the CA3 region (Fig. 2). The number of cells with SGs in the CA1 of the R7d group was higher compared with the R3d group (Fig. 2B).
FIGURE 2.
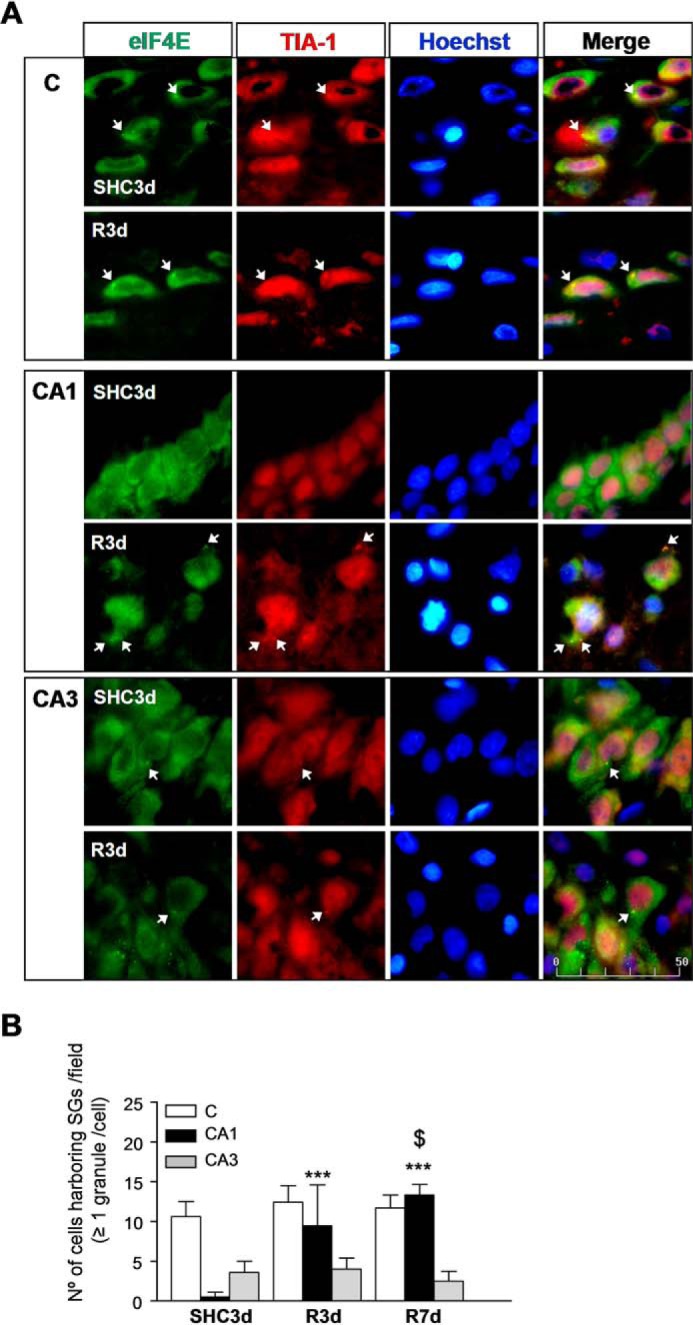
Identification of SGs by colocalization analysis of eIF4E and TIA-1 in the cerebral cortex and hippocampal CA1 and CA3 regions. A, brain sections as in Fig. 1 were used for eIF4E and TIA-1 colocalization by confocal fluorescence microscopy for identification and quantification of cells harboring SGs. eIF4E was labeled with FITC secondary antibody (in green), and TIA-1 was labeled (in red) as in Fig. 1. eIF4E/TIA-1 colocalization showed punctate aggregates in yellow as SGs (arrows). The nuclei stained with Hoechst are blue. This figure shows representative results from three to four different animals. The scale bar is in μm. B, the bar diagram represents the quantification of the number of cells harboring SGs per field (eIF4E/TIA-1 colocalization in ≥1 granule/cell). Bars represent the mean ± S.D. of three to four independent animals analyzed. Error bars represent S.D. ***, p < 0.001, CA1 R7d and R3d compared with CA1 SHC3d; $, p < 0.05, CA1 R7d compared with CA1 R3d. C, cerebral cortex.
Translation preinitiation complex components are the core constituents of SGs, which include small (40S) but not large (60S) ribosomal subunits (2, 4, 5). Subsequently, we studied the colocalization of TIA-1 and S6, as a ribosomal small subunit marker, to characterize SGs (2). In SHC3d, S6 was localized in the cytoplasm of the cortical and hippocampal regions (Fig. 3A, SHC3d panels). The merged images showed colocalization of S6/TIA-1 in punctate aggregates in the cytoplasm specific for SGs (Fig. 3A, arrows). The S6/TIA-1 double staining analysis of SGs showed a significant increase of SGs in R3d in the CA1 region compared with the control condition (Fig. 3B). Although there was an increase in the SGs assessed with S6 and TIA-1 in the cortex and in the CA3 regions at R3d (with similar numbers of cells with these SGs in both the CA1 and CA3), the increase with respect to the control was much lower than in the CA1, and it was not significant (Fig. 3B).
FIGURE 3.
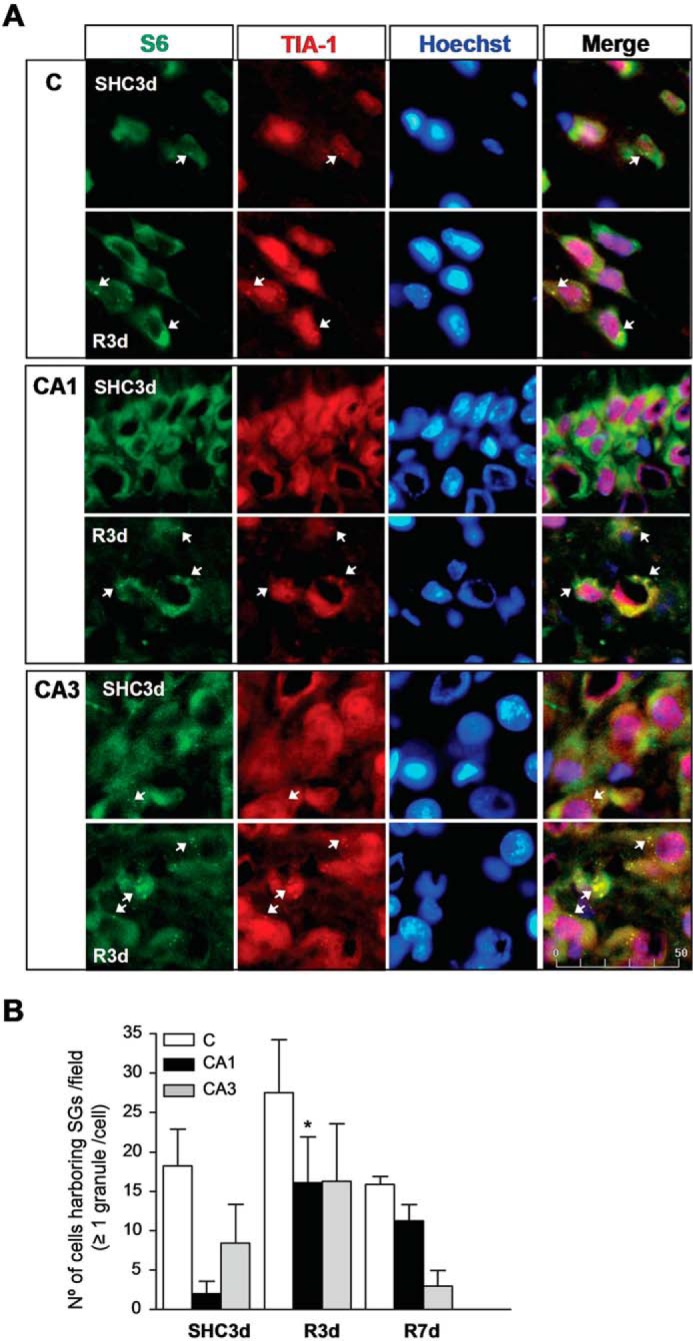
Identification of SGs by colocalization analysis of S6 and TIA-1 in the cerebral cortex and hippocampal CA1 and CA3 regions. A, brain sections as in Fig. 1 were used for S6 and TIA-1 colocalization by confocal fluorescence microscopy for identification and quantification of cells harboring SGs. S6 was visualized using FITC secondary antibody (in green), and TIA-1 was labeled (in red) as in Fig. 1. S6/TIA-1 colocalization showed punctate aggregates in yellow as SGs (arrows), and the nuclei stained with Hoechst are blue. Figures show representative results from three to nine different animals. The scale bar is in μm. B, the bar diagram represents the quantification of the number of cells harboring SGs per field (S6/TIA-1 colocalization in ≥1 granule/cell). Bars represent the mean ± S.D. of three to nine independent animals analyzed. Error bars represent S.D. *, p < 0.05 compared with SHC3d. C, cerebral cortex.
The relative SG values based on colocalization with translation initiation factors and TIA-1 were similar (Figs. 1 and 2). However, there were more SGs estimated with S6/TIA-1 colocalization in the cerebral cortex and hippocampal CA3 in R3d (Fig. 3). This may be due to different antigen recognition by the antibodies used or epitope overlap in the SG complex, although the fact that this result reveals a different stage of the SGs should not be discarded. In summary, IR stress induced SG formation specifically in the CA1 region after R3d, which was even more noticeable at 7 days after reperfusion.
Polysome Dissociation in the Hippocampal Cornu Ammonis 1 Region after Ischemia-Reperfusion
Ischemia-induced translation arrest persists after ischemic reperfusion in the vulnerable CA1 region in global ischemia (15, 19). Because ribosome sedimentation profiles showing polysome dissociation are specific indicators of translation initiation inhibition (8, 15, 20, 25), we analyzed polysome profiles in this CA1 region, and then the polysome/80S species ratio was also calculated (Fig. 4). In Fig. 4, we show a comparison between SHC3d and R3d with data of the latter condition from our previous study (20). Comparison between R3d and the control condition showed a polysome/80S ratio significantly lower in R3d (0.51 ± 0.04 for R3d (20) and 0.79 ± 0.01 for control; p = 0.0019). Therefore, significant polysome dissociation occurred in the CA1 region during R3d. Additionally, the peak for the 40S ribosomal subunit was lower in the R3d group than in the control group.
FIGURE 4.

Polysome dissociation upon reperfusion in the hippocampal CA1 region. Polysome profiles were obtained from samples of the hippocampal CA1 region from control (SHC3d) and R3d animals. The values are the ratio of polysome (P)/80S monosome species. Figures show representative results from three independent experiments. **, p < 0.01, CA1 R3d compared with CA1 SHC3d by t test. Abs, absorbance.
SG Induction in the Hippocampal Cornu Ammonis 1 Region Precedes Neuronal Death
Persistent translation inhibition, as we demonstrated here and in our previous study (20), correlates with neuronal death in CA1 neurons at later reperfusion following global ischemia (13–15, 19, 20). The SG induction in the CA1 region at R3d described above led us to study the timing between SG formation and neuronal death induction in CA1. Using a set of ischemic animals with 1, 2, 2.5, 3, and 7 days of reperfusion, we studied eIF4E/TIA-1 colocalization for SG evaluation (see above) and apoptotic neuronal death by terminal deoxynucleotidyltransferase-mediated dUTP nick end labeling (TUNEL) assay (20). The timing of SG and apoptotic neuronal death induction in CA1 is shown in Fig. 5. Interestingly, SG induction was found at R2d, whereas neuronal death was observed later, starting at R2.5d (Fig. 5A). Thus, the number of cells harboring SGs was significant at R2d compared with the presence of apoptotic neurons, which were scarce (Fig. 5C).
FIGURE 5.

SG induction in the CA1 region preceded neuronal death. A, brain sections of the hippocampal CA1 region from control (SHC3d), R1d, R2d, R2.5, R3d, and R7d animals were used for eIF4E (in green) and TIA-1 (in red) colocalization by confocal fluorescence microscopy for identification and quantification of the cells harboring SGs as in Fig. 2. eIF4E/TIA-1 colocalization showed punctate aggregates in yellow as SGs (arrows). Adjacent brain sections were used for apoptosis detection by TUNEL assay (in green). Cell nuclei were stained with Hoechst 33342 dye (insets, in blue). The pictures show representative results from four different animals (SHC3d and R7d not shown). The scale bar is in μm. B, brain sections of CA1 R3d as in A were co-labeled for eIF4E with Cy5 secondary antibody (in green), TIA-1 with rhodamine Red-X secondary antibody (in red), and TUNEL assay (in light blue). No co-labeling between SGs (in yellow; arrows) and TUNEL was detected. C and D, quantification of cells harboring SGs (black line) or TUNEL-positive apoptotic cell nuclei (blue line) in CA1 is represented in number of cells per field (C) or expressed as a percentage of the total cell number (D). In C (triangles), data were aggregated to each time interval. Data are indicated as mean ± S.D. of four independent animals analyzed per group. Error bars represent S.D. **, p < 0.01 and ***, p < 0.001, R2d, R2.5d, R3d, or R7d compared with the control or R1d. The inset graphs show the linear regression after logarithmic transformation.
SG formation was observed in intact and whole neuronal cells but not in apoptotic cells (Figs. 1–3A and 5A), a result demonstrated by co-labeling of eIF4E/TIA-1 in the cells and TUNEL assay. Co-labeling was not detected in Fig. 5B.
The number of cells harboring SGs between R2.5d and R7d was lower than that of the TUNEL-positive apoptotic cells, which were markedly increased from R2.5d to R7d in the CA1 region (Fig. 5C). Although TUNEL-positive apoptotic cells are an end stage, SG formation in viable cells could be a transitory stage (Fig. 5, A and B). Accordingly (and interestingly), when the number of cells harboring SGs was aggregated to each time interval, a very significant correlation with the number of apoptotic cells was found (Pearson coefficient r = 0.9844; p < 0.005) (Fig. 5C). Moreover, when the data of the number of cells with SGs or with TUNEL label were expressed as a percentage (in relation to total viable cells or total nuclei, respectively), both values were coincident (with the exception of R2d) and strictly correlated (Pearson coefficient r = 0.9920; p < 0.001) (Fig. 5D).
SG Formation Was Independent of eIF2 Activity
The formation of SGs by stress conditions, for example IR stress, can be triggered by ternary complex inhibition, which may in turn be induced by eIF2α phosphorylation or depletion of eIF2 (1, 6, 7). Given that R3d induced a significant SG formation in the CA1 region, we studied the levels and phosphorylation of eIF2α and the eIF2 regulators eIF2B and eIF5. We analyzed these initiation factors by Western blotting using phosphospecific and pan-antibodies.
eIF2α levels and eIF2α phosphorylation were detected and quantified in R1d, R2d, R3d, and SHC3d, and no significant differences were found when compared with the control or between the cerebral cortex and CA1 region (Fig. 6A). The increase of eIF2α phosphorylation at 30 min of reperfusion (R30) after ischemia is shown as a control for induced eIF2α phosphorylation (Fig. 6A, bottom, C R30 and CA1 R30).
FIGURE 6.

Levels of eIF2α, eIF2α phosphorylation, eIF2Bϵ, eIF2Bϵ phosphorylation, and eIF5 after IR. A, samples of the cerebral cortex (C) or hippocampal CA1 region from control (SHC3d), R30, R1d, R2d, and R3d animals were subjected to SDS-PAGE and Western blotting. The bottom panels show a representative Western blot developed for anti-eIF2α and anti-phospho-eIF2α Ser51 (eIF4E p-Ser51) antibodies. B, SHC3d and R3d samples of cerebral cortex or CA1 were subjected to SDS-PAGE and Western blotting using anti-eIF2Bϵ, anti-phospho-eIF2Bϵ Ser535 (eIF2Bϵ p-Ser535), and anti-eIF5 antibodies. In A and B, bar graphs show the data of the quantification of translational factor levels; phospho forms are quantified with respect to total levels of the protein (ratios). Data are from three to seven different animals run in duplicate; error bars indicate S.D. Comparisons were not significant (p > 0.05). The numbers to the right of the Western blots indicate the apparent molecular mass in kDa from protein markers.
Concerning eIF2B and eIF5, there were no significant differences in these factors when compared with the controls or between the cerebral cortex and CA1 region (Fig. 6B). Thus, interestingly, SG formation induced by R3d in the CA1 region was independent of eIF2α or eIF2Bϵ phosphorylation or changes in eIF2, eIF2B, or eIF5 levels.
Ischemia-Reperfusion Stress Decreases Levels of eIF4B and eIF4E in the Hippocampal Cornu Ammonis 1 Region
The eIF4F is a heterotrimer that contains the cap-binding protein eIF4E, the RNA helicase eIF4A, and the scaffolding protein eIF4G (26). In turn, eIF4A activity is directly dependent on the activity of eIF4B, which makes the helicase complex fully functional (27). A reduction in the levels of eIF4A, eIF4B, eIF4E, or eIF4G induced by stress can trigger SG formation (7–9). To study whether these initiation factors are implicated in the induction of SGs by IR stress, we analyzed their levels by Western blotting using specific antibodies. The results showed that there was a significant decrease in eIF4B levels in the CA1 region at R3d in comparison with the control level (Fig. 7A). In contrast, no significant changes in eIF4A or eIF4G levels were found in the R3d group when compared with the control group in the hippocampal CA1 region or cerebral cortex (Fig. 7A). In addition, we analyzed the eIF4B phosphorylation levels at the regulated Ser422 site (28) by Western blotting using a phosphospecific antibody. The phosphorylation levels were residual, and no significant changes were found in the R3d group when compared with the control or between the cerebral cortex and hippocampal CA1 region (data not shown).
FIGURE 7.

Levels of eIF4G, eIF4A, and eIF4B after IR. A, samples of the cerebral cortex (C) or hippocampal CA1 region from control (SHC3d) and R3d animals were subjected to SDS-PAGE and Western blotting with anti-eIF4G and anti-eIF4A antibodies and anti-eIF4B antibody 3592. Figures show representative results. Bar graphs show the quantification of translational factor levels from four to seven different animals run in duplicate. Error bars indicate S.D. *, p < 0.05, CA1 R3d compared with CA1 SHC3d. The numbers to the right of the Western blots indicate the apparent molecular mass in kDa from protein markers. B, brain sections of the cerebral cortex (C) or hippocampal CA1 or CA3 regions from SHC3d and R3d were used for identification and quantification of eIF4B in cells. eIF4B was detected with anti-eIF4B antibody D-4 and labeled with FITC secondary antibody. Squares show representative results of eIF4B-labeled cells in cerebral cortex, CA1, or CA3. The bar graph shows the quantification of the intensity of fluorescence per cell of eIF4B labeled in brain sections. Bars represent the mean ± S.D. of four independent animals analyzed. Error bars represent S.D. *, p < 0.05, CA1 R3d compared with CA1 SHC3d; $, p < 0.05, cerebral cortex or CA3 R3d compared with CA1 R3d. The scale bar is in μm. Lower magnification images (landscape images) show the decrease of eIF4B label in CA1 R3d compared with SHC3d or CA3 R3d. GD, gyrus dentatus.
We performed an immunohistochemical analysis to confirm the decreased levels of eIF4B found in the CA1 region at R3d by labeling eIF4B with a fluorescent secondary antibody (Fig. 7B, images). Quantification of fluorescence intensity of labeled eIF4B showed a decrease in protein levels of eIF4B in CA1 R3d (Fig. 7B). This decrease was significant in comparison with the control or with the cerebral cortex or hippocampal CA3 region, confirming the results of the immunoblotting studies.
R3d induced a significant decrease in eIF4E levels in the CA1 region. This decrease was also significant when compared with that in the cerebral cortex (Fig. 8A, eIF4E). Furthermore, we analyzed the eIF4E phosphorylation at the regulated Ser209 site (29) by Western blotting using a phosphospecific antibody. No significant changes in eIF4E phosphorylation were found in the R3d group compared with the control or between the cerebral cortex and CA1 region (Fig. 8A, eIF4E p-Ser209). To confirm the decreased levels of eIF4E found in the CA1 region at R3d, we quantified the intensity of eIF4E labeled with fluorescent secondary antibody in Fig. 2 (eIF4E images). A decrease in protein levels of eIF4E was demonstrated by quantification of its lower fluorescence intensity in CA1 R3d (Fig. 8B). This decrease was significant in comparison with the control and with the cerebral cortex and hippocampal CA3 region, mirroring the results of the immunoblotting studies. In conclusion, IR stress during R3d decreased eIF4B and eIF4E levels in the hippocampal CA1 region concurrently with the induction of SGs.
FIGURE 8.

Levels of eIF4E and eIF4E phosphorylation at Ser209 site after IR. A, samples as described in Fig. 7 were subjected to SDS-PAGE and Western blotting with anti-eIF4E and anti-phospho-eIF4E Ser209 (eIF4E p-Ser209) antibodies. Figures show representative results. Bar graphs show the quantification of eIF4E levels from six to eight different animals run in duplicate. Error bars indicate S.D. **, p < 0.01, CA1 R3d compared with CA1 SHC3d; $, p < 0.05, C R3d compared with CA1 R3d. The numbers to the right of the Western blots indicate the apparent molecular mass in kDa from protein markers. B, the bar graph shows the quantification of the intensity of fluorescence per cell of eIF4E labeled in Fig. 2 (eIF4E images). Error bars indicate S.D. **, p < 0.01, CA1 R3d compared with CA1 SHC3d; $, p < 0.05, cerebral cortex or CA3 R3d compared with CA1 R3d. The scale bar is in μm. Lower magnified images show the decreasing of eIF4E label in CA1 R3d compared with SHC3d or CA3 R3d. C, cerebral cortex; GD, gyrus dentatus.
Cycloheximide Treatment Inhibits SG Induction in the Hippocampal Cornu Ammonis 1 Region after Ischemia-Reperfusion
Cycloheximide has been previously described by our group and others as a neuroprotective agent in ischemia models (20, 30, 31). Moreover, cycloheximide (CHX) is known as an SG assembly inhibitor in cell lines (5). We treated animals with an adequate dose of CHX to induce neuroprotection (20) and studied its effect on SG formation after IR in the brain regions. The effect of CHX was detected by immunofluorescence analysis for SG markers. eIF4E/TIA-1 colocalization in brain sections from CHX-treated animals revealed a decreased colocalization in the cytoplasm (Fig. 9A, arrows). The decrease in SG formation was evident in the cerebral cortex and CA1 regions (Fig. 9A) as well as in the CA3 region (not shown). Quantification of the number of cells harboring SGs in the CHX-treated R3d group showed a significant decrease with respect to untreated R3d animals in all studied regions (Fig. 9B). Similar results were found using eIF3b/TIA-1 colocalization for SG identification and quantification (Fig. 9C). These results demonstrated that CHX treatment inhibited SG formation after R3d. We studied the levels of eIF4E and eIF4B in samples from the CA1 region in CHX-treated animals in the R3d group. CHX induced a significant increase in the levels of eIF4E and eIF4B when compared with CA1 R3d from untreated animals or with the SHC3d group (Fig. 9, D and E). Interestingly, when we quantified the fluorescence intensity of eIF4E labeled in Fig. 9A (eIF4E images), the results showed that eIF4E returns to control levels in the CHX-treated R3d group in the CA1 region (Fig. 10A). Similarly, we performed an immunohistochemical analysis labeling eIF4B with fluorescent secondary antibody (Fig. 10B, images) and quantified the fluorescence intensity of the eIF4B labeled. The results showed that eIF4B reached control levels in the CHX-treated R3d group in the CA1 region (Fig. 10B). Thus, these immunofluorescence studies confirmed the results from the immunoblotting analysis (Fig. 9, D and E). All of these results were opposite to those described above in R3d untreated animals, which had SG induction and lower levels of eIF4E and eIF4B in the CA1 region. This situation was reversed, reaching control conditions, by treatment with CHX. In addition, both SG formation inhibition and the increased levels of eIF4E and eIF4B induced by CHX (this study) correlated with neuronal apoptosis inhibition and increased translational rates in the CA1 of ischemic CHX-treated animals (20).
FIGURE 9.
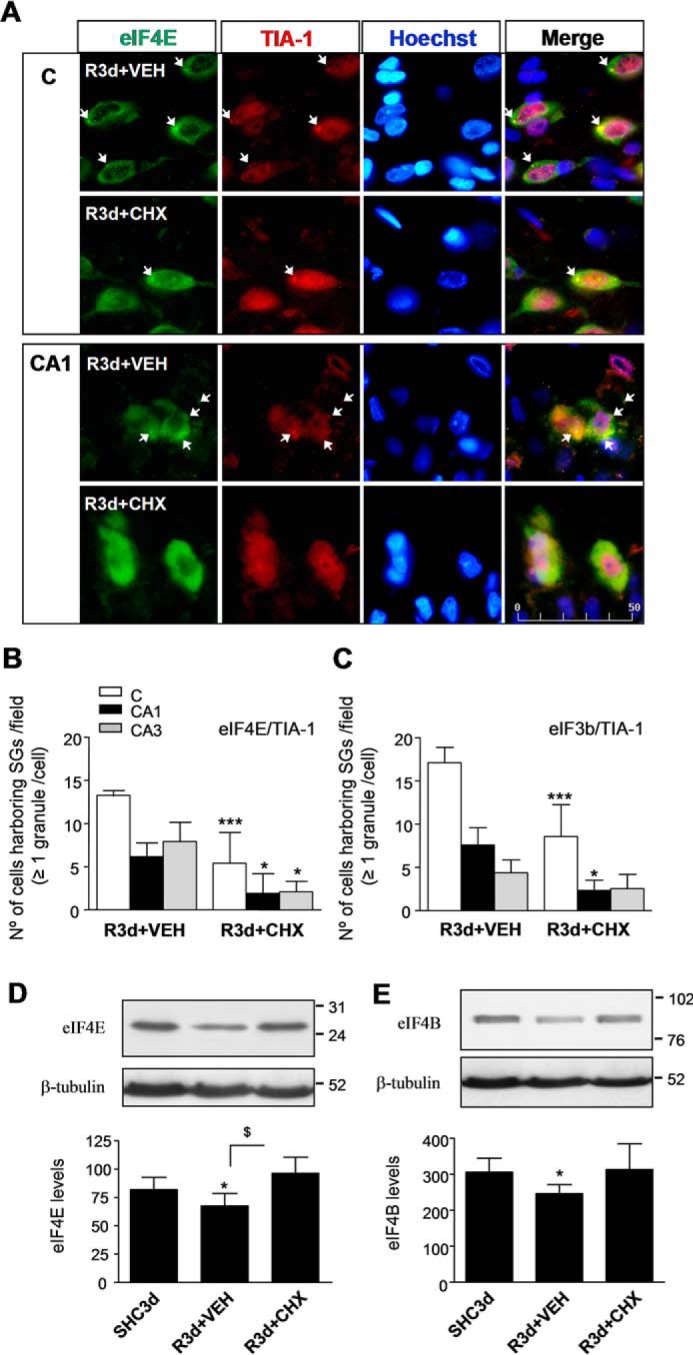
CHX treatment inhibits SG formation in the CA1 region after IR. A, brain sections of the cerebral cortex (C) or hippocampal CA1 region or CA3 region (images not shown) from untreated (vehicle (VEH)) or treated (1 mg/kg CHX in vehicle) R3d animals (R3d+VEH and R3d+CHX, respectively) were used for eIF4E and TIA-1 colocalization by confocal fluorescence microscopy for identification and quantification of the cells harboring SGs as described in Fig. 2. Figures show representative results from three to four different animals. Scale bar, 50 μm. B, the bar diagram represents quantification of cells harboring SGs per field (eIF4E/TIA-1 colocalization in ≥1 granule/cell). C, the bar diagram represents quantification of the number of cells harboring SGs using eIF3b/TIA-1 colocalization as in Fig. 1. In B and C, bars represent the mean ± S.D. of three to four independent animals analyzed. Error bars represent S.D. ***, p < 0.001 and *, p < 0.05, R3d+CHX compared with R3d+VEH. D and E, CA1 samples from control (SHC3d), untreated (R3d+VEH), and treated (R3d+CHX) animals as in A were subjected to Western blotting with anti-eIF4E (D) or anti-eIF4B (E) antibodies. Figures show representative results. Bar graphs show quantification of eIF4E or eIF4B levels from three to eight different animals run in duplicate. Error bars indicate S.D. *, p < 0.05, CA1 R3d+VEH compared with CA1 SHC3d; $, p < 0.05, CA1 R3d+CHX compared with CA1 R3d+VEH. The numbers to the right of the Western blots indicate the apparent molecular mass in kDa from protein markers.
FIGURE 10.

CHX prevents the IR-induced decrease of eIF4E and eIF4B in the CA1 region. A, the bar graph shows the quantification of the intensity of fluorescence per cell of eIF4E labeled in Fig. 9A (eIF4E images). Lower magnification images show the increase of eIF4E label in CA1 R3d+CHX compared with R3d+VEH. B, brain sections of cerebral cortex (C), CA1, or CA3 from R3d+VEH and R3d+CHX as in Fig. 9A were used for identification and quantification of eIF4B in cells. eIF4B was labeled with FITC secondary antibody. Squares show representative results of eIF4B-labeled cells in cerebral cortex, CA1, or CA3. The bar graph shows the quantification of the intensity of fluorescence per cell of eIF4B labeled in brain sections. Lower magnification images (landscape images) show the increase of eIF4B label in CA1 R3d+CHX compared with R3d+VEH. In A and B, bars represent the mean ± S.D. of three to four different animals analyzed; data of eIF4E and eIF4B SHC3d controls were from Figs. 8B and 7B, respectively. Comparisons were performed for each region. Error bars represent S.D. **, p < 0.01, CA1 R3d+VEH compared with SHC3d or R3d+CHX. The scale bars are in μm. GD, gyrus dentatus.
Discussion
We investigated the formation of SGs in three brain regions with differential vulnerabilities to IR stress. We found that (i) IR stress induced SG formation specifically in the CA1 region at later reperfusion (R3d) in an animal model of global brain ischemia, (ii) SG formation strictly correlated with the inhibition of translation initiation, (iii) the induction of SGs in this region occurred independently of eIF2 inhibition by eIF2α phosphorylation or changes in eIF2B, (iv) SG formation was in accordance with a decrease in the expression of the cap-binding protein eIF4E and the eIF4B factor, and (v) pharmacological protection of ischemic animals with CHX decreased the number of SGs in the CA1 upon long term reperfusion after ischemia and prevented the decrease in eIF4E and eIF4B levels.
The finding of SG induction in the CA1 region at later reperfusion following brain ischemia is the first to provide consistent data concerning the characterization of the presence and composition of SGs in terms of initiation factors of the translation after IR. The induction of SGs in CA1 neurons after IR was in agreement with our previous studies that described the selective neuronal death in the CA1 region (20). Moreover, CHX treatment at a concentration shown to be neuroprotective in this CA1 region (20) prevented SG formation.
SGs are induced in response to stress conditions known to inhibit translation initiation (6). During long term reperfusion after ischemia (R3d), protein synthesis initiation remains inhibited in the CA1 region as demonstrated here with polysome profiles and in our previous study (20). In the CA1 polysome profile, the peak for the 40S ribosomal subunit was lower in the R3d group than in the SHC3d group, suggesting the movement of small ribosomal subunits into induced SGs in the neuronal cells of this region as described in other experimental models (7, 32).
The sequestration of the translational machinery in SGs is considered a form of protection against stress in cells, reprogramming the mRNA metabolism to repair the stress-induced damage and facilitate and promote survival (2, 33). However, the presence of SGs in neurons has recently been linked to neurodegeneration because SG formation could promote persistent pathological protein aggregates that would interfere with the normal function of the cell, leading to cell death (34). Herein, the specific induction of SGs in the CA1 region at later reperfusion after ischemia, a stress situation that induces a persistent translation inhibition, is convergent with delayed neuronal death in this region (20). This supports the notion that SG formation might play an important role in IR stress and may be linked to neuronal death. Studies in other models of global and focal brain ischemia have shown persistent abnormal protein aggregates in the ischemia-vulnerable neurons destined to die after the ischemic insult (22, 23). Although the increase of S6/TIA-1-containing SGs in CA1 neurons at later reperfusion after ischemia has been reported, this result was found in dead neurons (35) and has not been confirmed in viable cells (24). Instead, the formation of mRNA granular structures orphaned from both ribosomal subunits (in contrast to SGs, which contain the 40S subunit) was identified (19, 36). The irreversible inhibition of protein synthesis is considered a hallmark of delayed cell death after ischemia (13, 15). Thus, these events, sequentially or cooperatively, may result in irreparable damage to the protein synthesis machinery and be related to delayed neuronal death after brain ischemia.
In regard to the mechanism of SG formation in the CA1 region under IR stress, we found that the induction of SGs occurred without an increase in eIF2α phosphorylation levels or eIF2 depletion. It is established that eIF2α phosphorylation occurs rapidly with reperfusion following ischemia, representing a “classical stress response,” but this induction is transient, and postischemic neurons have the phospho-eIF2α dephosphorylated before delayed neuronal death (19). We and others have previously described the induction of eIF2α phosphorylation in ischemic brains after 30 min (R30), 1 h, or 2 h of reperfusion, and this phosphorylation returns to control values after 4–8 h of reperfusion after global ischemia (24, 37). Here, the induction of eIF2α phosphorylation is shown at R30. There was no induction of eIF2α phosphorylation compared with control levels between 1 and 3 days of reperfusion after ischemia, and this effect is highlighted at R2d when SG formation was first observed. Therefore, SG formation must be induced by a mechanism independent of this phosphorylation. Recent studies in cell lines have described new pathways independent of eIF2α phosphorylation for SG induction. It has been reported that the decrease in the levels of eIF4B (7, 9) or the breaking of the eIF4F association with the mRNA cap structure through eIF4E inactivation by eIF4E-binding protein 1 (4E-BP1) (9, 38, 39) can lead to the formation of SGs. In our study, no changes were found in eIF4A or eIF4G levels, ruling out their involvement in the mechanism of SG induction after IR stress. Our results showed a decrease in the levels of eIF4B, particularly in the CA1 region, which correlates with the presence of SGs. This suggests that eIF4B may participate as an SG inducer after IR.
Furthermore, our results showed that IR stress induces a decrease in eIF4E levels in the CA1 region that correlated with the presence of SGs. The availability of eIF4E is critical for the proper control of cell function because it is a limiting step in translation initiation (26). A decreased availability of free eIF4E in the cytoplasm can trigger SG formation (9, 38, 39).
eIF4E is a primary factor in the control of gene expression and is regulated by the family of translational repressors named 4E-BPs (40). 4E-BPs compete with eIF4G and inhibit eIF4G binding to eIF4E, which in turn prevents eIF4F complex formation and inhibits cap-dependent translation (40, 41). Among them, 4E-BP1 has been directly implicated in promoting the formation of selenite- and H2O2-induced SGs through the enhancement of eIF4E/4E-BP1 interaction (38, 39). It has been shown that the decrease in eIF4E/eIF4G interaction induces SGs (9, 38, 39). 4E-BP2 is the predominant 4E-BP expressed in the brain. First, we reported an increase in 4E-BP2/eIF4E association in the vulnerable CA1 region at R3d that consequently reduces the availability of eIF4E (20). Additionally, we recently reported a decrease in the binding of 4E-BP2 to eIF4E and an increase in eIF4E/eIF4G interaction in the cerebral cortex compared with CA1 at R3d (42).
In summary, these results suggest that a decrease in the levels of eIF4B accompanied by a lower availability of eIF4E (this study) along with an increase in 4E-BP2/eIF4E association (20) may directly promote the formation of SGs in the CA1 region after long term reperfusion. Decreased levels of eIF4B and eIF4E are possibly due to the persistent translational arrest in this region. In a deleterious feedback loop, SG formation in addition to increased 4E-BP2·eIF4E complex could further reduce the availability of eIF4E, leading to translation arrest and cell collapse, inducing neuronal apoptosis and driving delayed neuronal death in the CA1 region after IR stress.
Our previous results have shown that CHX treatment of ischemic animals decreases neuronal apoptosis induced by IR and induces a decrease in the 4E-BP2 bound to eIF4E during reperfusion in the CA1 neurons in addition to the recovery of protein synthesis in this region (20). CHX has been described to disassemble SGs in cell lines after 1–2 h of treatment (5). However, there are no data on this effect in CHX-treated animals or its effect after 3 days. In the present study, CHX decreased SG formation after IR stress. The fact that CHX also interferes with 4E-BP2·eIF4E complex formation (20) suggests that the CHX-induced decrease in 4E-BP2/eIF4E association and the rise of active eIF4E in the cytoplasm can contribute to inhibit SG formation in the CA1 region. Both of these effects along with the increase in eIF4E and eIF4B levels (possibly due to the CHX-induced restored translation) should converge to form functional eIF4F complexes, leading to recovery of the cap-dependent translational levels, inhibition of SG formation, and a decrease in neuronal death in the CA1 region of ischemic animals.
The experimental evidence presented in this study reveals that SG induction starts at R2d and correlates with delayed neuronal death from R2.5d when apoptotic neuronal death begins in the vulnerable CA1 region. Therefore, it would be reasonable that SGs contribute to this neuronal death instead of being a secondary effect of the injury after IR. SG formation is directly connected with translation initiation arrest (1, 2), a situation that is prior to cell death in vulnerable regions after IR (13–15). Herein, the inhibition of SG formation induced by treatment with CHX, a molecule that interferes in the translation machinery, demonstrates that translation regulation has a causal role in SG formation. In accordance with this, after IR, SG induction was detected in viable neuronal cells, i.e. with the translation machinery complete, and not in the damaged or degenerated (apoptotic) neurons characteristic of the CA1 region. Additionally, the fact that there was a proportional increase of neurons with SGs in the CA1 region in a manner that corresponded to the increase in apoptotic neurons could indicate the connection between SG occurrence and neuronal death induction. In this way, the presence of SGs in CA1 neurons could be a transitory stage to apoptotic neuronal death. Thus, here with the protection of CA1 ischemic neurons induced by CHX, the number of cells with SGs was decreased. Furthermore, the presence of SGs in neurons has recently been linked to neurodegeneration because it has been reported that the formation of pathological TIA-1-containing SGs could lead to cell death in neurodegenerative diseases (34, 43). All of these findings support the hypothesis that prolonged periods of stress, e.g. a persistent translation inhibition in the CA1 region, could cause formation of stable and pathological SGs, leading to neurodegeneration (43). It has been proposed that prolonged exposure to proteins that nucleate SG assembly and containing an abundance of prion-like domains, i.e. TIA-1 (44), eventually leads to the formation of hyperstable SGs refractory to disassembly, trapping essential mRNP factors that respond after stress (45).
In conclusion, the present study, in combination with our previous work on the changes in 4E-BP2/eIF4E association following global brain ischemia (20), allow us to demonstrate that the formation of SGs induced by IR stress is correlated with inhibition of protein synthesis and delayed neuronal death following brain ischemia. To support this outcome, we show compelling experimental evidence that components of the translation initiation machinery, eIF4B and eIF4E, can mediate the mechanism of SG formation in vulnerable regions after ischemia. These findings provide a more complete understanding of the mechanisms underlying the inhibition of protein synthesis and delayed neuronal death under IR, offering the SGs as new targets for therapies aimed at the recovery of vulnerable cells in brain ischemia.
Experimental Procedures
Materials
Rabbit polyclonal anti-eIF3b subunit (H-300; catalogue number sc-28857) antibody; goat polyclonal anti-eIF4G1 (N-20; catalogue number sc-9601), anti-TIA-1 (C-20; catalogue number sc-1751), and anti-eIF4A1 (N-19; catalogue number sc-14211) antibodies; and mouse monoclonal anti-eIF5 (A-3; catalogue number sc-48419) and anti-eIF4B (D-4; catalogue number sc-376062) antibodies were from Santa Cruz Biotechnology (Santa Cruz, CA). Mouse monoclonal anti-eIF4E antibody (catalogue number 610269) was from BD Transduction Laboratories. Rabbit polyclonal anti-phospho-eIF2α (Ser51) antibody (catalogue number 44-728G) was from BIOSOURCE (Nivellees, Belgium). Mouse monoclonal anti-S6 ribosomal protein antibody (54D2; catalogue number 2317), rabbit polyclonal anti-phospho-eIF4E (Ser209) (catalogue number 9741), anti-eIF4B (catalogue number 3592), and anti-eIF2Bϵ (catalogue number 3595) antibodies were from Cell Signaling Technology (Beverly, MA). Rabbit polyclonal anti-phospho-eIF2Bϵ (Ser539) antibody (catalogue number ab4775) and mouse monoclonal anti-eIF2α antibody (catalogue number ab5369) were from Abcam (Cambridge, UK). Rabbit polyclonal anti-β-tubulin antibody (catalogue number T5201) was from Sigma. All general chemicals were purchased from Sigma unless stated otherwise.
Animal Model of Ischemia and Ischemia-Reperfusion
Transient global forebrain ischemia was induced in adult male Wistar rats (aged 10–12 weeks; Charles River, L'Arbresle, France) by the standard four-vessel occlusion model described previously (20, 46). Both vertebral arteries were irreversibly occluded by electrocoagulation under anesthesia with a mixture of atropine, ketamine, and diazepam (0.25, 62.5, and 5 mg/kg, respectively) delivered by intraperitoneal injection. After 24 h, both common carotid arteries were occluded for 15 min by small atraumatic clips to induce ischemia, and then the clips were removed from the carotid arteries. After 30 min or 1, 2, 2.5, 3, or 7 days of reperfusion (R30, R1d, R2d, R2.5d, R3d, or R7d, respectively), the animals were sacrificed. SHC3d animals were prepared in the same way as the R3d animals but without carotid occlusion. In some experiments, animals were treated with 1.0 mg/kg CHX diluted in saline vehicle and administered by intraperitoneal injection 45 min before ischemia induction. The Ethics Committee of the Hospital Ramón y Cajal, Madrid, Spain, approved all the experiments. All procedures associated with animal experiments were in accordance with Spanish legislation (RD 53/2013), Directives of the European Union (2010/63/UE), and the Animal Research: Reporting in Vivo Experiments (ARRIVE) guidelines.
Sample Preparation
Cerebral cortex and hippocampal CA1 region from control and ischemic animals were rapidly dissected out under a magnifying glass. The samples were homogenized 1:5 (w/v) with Buffer A (20 mm Tris-HCl, pH 7.5, 140 mm potassium chloride, 5 mm magnesium acetate, 1 mm dithiothreitol, 2 mm benzamidine, 1 mm EDTA, 2 mm EGTA, 10 μg/ml pepstatin A, 10 μg/ml leupeptin, 10 μg/ml antipain, 20 mm sodium β-glycerophosphate, 20 mm sodium molybdate, 0.2 mm sodium orthovanadate) and centrifuged at 12,000 × g for 15 min to obtain a postmitochondrial supernatant (PMS). All procedures were performed at 4 °C. The PMS fraction corresponding to each animal was separately kept at −80 °C until used, and protein concentrations were determined for each sample.
Western Blotting Analysis
Samples of PMS (35 μg) from each different experimental condition were analyzed by SDS-PAGE, transferred onto PVDF membranes (GE Healthcare), and incubated overnight at 4 °C with the primary antibody to the specific protein. The blots were incubated for 1 h with peroxidase-conjugated anti-mouse, anti-rabbit (both from GE Healthcare), or anti-goat (Santa Cruz Biotechnology) IgG and developed with ECL reagent (GE Healthcare). The Western blots were quantified using ImageQuant TL software (GE Healthcare). An internal standard (tubulin) was included to normalize the different immunoblots. Data were expressed in arbitrary units. Protein markers (range, 12–225 kDa) (GE Healthcare) were used to calculate the apparent molecular mass.
Immunohistochemistry and Confocal Fluorescence Microscopy
The animals were killed by transcardiac perfusion performed under deep anesthesia. Perfusion via the left ventricle was started with a washout of 200 ml of 0.9% NaCl, and the brains, following perfusion and fixation with 4% (w/v) paraformaldehyde solution in PBS, were removed and postfixed in the same solution overnight at 4 °C. Brains were washed sequentially with 10, 20, and 30% (w/v) saccharose in PBS; embedded in Tissue-Tek OCT (Sakura Finetek, Zoeterwoude, Netherlands); and frozen at −80 °C prior to cryostat sectioning. Brain coronal sections (10 μm thick) were prepared at the level of interaural +5.7 ± 0.2 mm on Real Capillary Gap microscope slides (Dako, Barcelona, Spain). Brain sections containing the hippocampus were postfixed with 4% paraformaldehyde in PBS for 5 min; washed in PBS; incubated in 10 mm sodium citrate, pH 6.0, at 95 °C for 3 min; cooled for 20 min; and washed in PBS three times. Sections were incubated in a blocking solution (5% heat-inactivated donkey serum, 0.1% Triton X-100 in PBS) for 1 h at room temperature and subsequently incubated with primary antibodies overnight at 4 °C followed by specific fluorochrome-conjugated secondary antibodies for 1 h at room temperature added sequentially. The secondary antibodies used were Alexa Fluor 488-conjugated donkey anti-rabbit IgG (Molecular Probes, Eugene, OR), rhodamine Red-X-conjugated donkey anti-goat IgG (heavy plus light), and fluorescein isothiocyanate (FITC)-conjugated or Cy5-conjugated donkey anti-mouse IgG (heavy plus light) (Jackson ImmunoResearch Laboratories, West Grove, PA). Preparations were mounted with coverslips in antifade solution containing Hoechst 33342 for nuclear staining and examined using an MRC-1024 confocal laser scanning microscope (Bio-Rad) equipped with an Olympus IX70 inverted microscope. Samples were sequentially scanned in the green, red, and blue channels controlled by LaserSharp software (Bio-Rad) with all acquisition settings kept constant for all images. Data acquisition was performed sequentially to avoid cross-talk between the emission spectra of the fluorochromes. Unrelated rabbit, goat, and mouse antibodies were used to test background staining. The fluorescence intensity for eIF4E- and eIF4B-labeled cells was quantified in intact cells using LaserSharp software.
SG induction was assessed by counting the number of cells harboring SGs per field. Six fields from the hippocampal CA1 and CA3 or cortex regions (0.07 mm2 each) from a given section were analyzed with confocal microscopy (100× objective). SGs were identified by three criteria: (i) eIF3b/TIA-1, eIF4E/TIA-1, and S6/TIA-1 colocalization in the green/red channels, respectively; (ii) colocalization in dense cytoplasmic punctate aggregates; and (iii) lack of nuclear localization. The images were digitized with LaserSharp software, and cells harboring ≥1 granule were counted in each field by two independent observers. The number of cells harboring SGs per field for a brain sample (animal) represented the average from three to four sections (18–24 fields).
Polysome Profile Analysis
PMS fractions from fresh cerebral cortex and hippocampal CA1 regions were homogenized 1:2 (w/v) with Buffer A containing 100 units/ml RNasin (RNase inhibitor; Promega, Madison, WI) and 0.2 mg/ml heparin in diethyl pyrocarbonate-treated water and layered (45 μl; ∼50 mg of RNA) onto a 4-ml 15–55% linear sucrose gradient containing 20 mm Tris-HCl, pH 7.6, 3 mm magnesium acetate, and 100 mm KCl as described previously (20). Ultracentrifugation was performed in an SW60 rotor (Beckman) at 164,000 × g for 3 h. Gradient profiles were eluted from the top of the gradient using a density gradient fractionator and monitored at 254 nm with an online UV detector. The profiles were registered; peaks were quantified by the valley-to-valley integration method shaping the baseline, and the ratio of polysomes/80S species was calculated. The entire procedure was performed at 4 °C.
TUNEL Assay
Apoptotic neurons within brain sections were detected using the TUNEL assay (Promega) as described (20). After the labeling of nuclei with fluorescein-12-dUTP by terminal deoxynucleotidyltransferase reaction, brain sections were washed and then mounted in antifade solution with glycerol buffer containing p-phenylenediamine and 30 μm bisbenzimide (Hoechst 33342) for nuclear staining. The hippocampal CA1 fields from a given section were analyzed with confocal microscopy (40× objective) to count the number of apoptotic nuclei (green); the total number of nuclei was observed by Hoechst staining (blue). The number of TUNEL-positive apoptotic neurons was blindly counted by two independent observers as described for SG counting (see above).
Statistical Analysis
Different animals from each experimental condition or group were independently analyzed in duplicate, and their average values were used for statistical analysis. Data from three to nine different animals were represented in arbitrary units and expressed as mean ± S.D. Statistical analysis was performed either using analysis of variance following the Newman-Keuls or Bonferroni post test, when analysis of variance was significant, to compare the data between experimental groups or between selected pairs groups, respectively. Statistical significance was set at p < 0.05 using Prism statistical software (GraphPad Software, San Diego, CA).
Author Contributions
A. A. conceived and designed the study. M. I. A. and E. M.-A. did experiments. M. I. A, E. M.-A., I. R., and A. A. analyzed the data. M. I. A. and A. A. wrote the manuscript. All authors approved the final version of the manuscript.
Acknowledgment
We are indebted to M. Gómez-Calcerrada for assistance.
This work was supported by Instituto de Salud Carlos III Grant PI14/00705 from the Spanish Ministry of Economy and Competitiveness and Fondo Europeo de Desarrollo Regional (FEDER) (to A. A.). The authors declare that they have no conflicts of interest with the contents of this article.
- SG
- stress granule
- CA1
- cornu ammonis 1
- CA3
- cornu ammonis 3
- 4E-BP
- eIF4E-binding protein
- IR
- ischemia-reperfusion
- SHC
- sham control
- R3d
- 3 days of reperfusion after ischemia
- R7d
- 7 days of reperfusion after ischemia
- TIA-1
- T-cell internal antigen-1
- CHX
- cycloheximide
- mRNP
- messenger ribonucleoprotein
- R30
- 30 min of reperfusion
- PMS
- postmitochondrial supernatant
- VEH
- vehicle.
References
- 1. Anderson P., and Kedersha N. (2002) Stressful initiations. J. Cell Sci. 115, 3227–3234 [DOI] [PubMed] [Google Scholar]
- 2. Anderson P., and Kedersha N. (2006) RNA granules. J. Cell Biol. 172, 803–808 [DOI] [PMC free article] [PubMed] [Google Scholar]
- 3. Mazroui R., Di Marco S., Kaufman R. J., and Gallouzi I.-E. (2007) Inhibition of the ubiquitin-proteasome system induces stress granule formation. Mol. Biol. Cell 18, 2603–2618 [DOI] [PMC free article] [PubMed] [Google Scholar]
- 4. Gonzalez C. I., Wilusz C. J., and Wilusz J. (2007) The interface between mRNA turnover and translational control, in Translational Control in Biology and Medicine (Mathews M. B., Sonenberg N., and Hershey J. W. B., eds) pp. 719–745, Cold Spring Harbor Laboratory Press, Cold Spring Harbor, NY [Google Scholar]
- 5. Kedersha N., and Anderson P. (2007) Mammalian stress granules and processing bodies. Methods Enzymol. 431, 61–81 [DOI] [PubMed] [Google Scholar]
- 6. Kedersha N. L., Gupta M., Li W., Miller I., and Anderson P. (1999) RNA-binding proteins TIA-1 and TIAR link the phosphorylation of eIF-2 alpha to the assembly of mammalian stress granules. J. Cell Biol. 147, 1431–1442 [DOI] [PMC free article] [PubMed] [Google Scholar]
- 7. Mokas S., Mills J. R., Garreau C., Fournier M. J., Robert F., Arya P., Kaufman R. J., Pelletier J., and Mazroui R. (2009) Uncoupling stress granule assembly and translation initiation inhibition. Mol. Biol. Cell 20, 2673–2683 [DOI] [PMC free article] [PubMed] [Google Scholar]
- 8. Dang Y., Kedersha N., Low W. K., Romo D., Gorospe M., Kaufman R., Anderson P., and Liu J. O. (2006) Eukaryotic initiation factor 2α-independent pathway of stress granule induction by the natural product pateamine A. J. Biol. Chem. 281, 32870–32878 [DOI] [PubMed] [Google Scholar]
- 9. Mazroui R., Sukarieh R., Bordeleau M. E., Kaufman R. J., Northcote P., Tanaka J., Gallouzi I., and Pelletier J. (2006) Inhibition of ribosome recruitment induces stress granule formation independently of eukaryotic initiation factor 2α phosphorylation. Mol. Biol. Cell 17, 4212–4219 [DOI] [PMC free article] [PubMed] [Google Scholar]
- 10. Anderson P., and Kedersha N. (2009) RNA granules: post-transcriptional and epigenetic modulators of gene expression. Nat. Rev. Mol. Cell Biol. 10, 430–436 [DOI] [PubMed] [Google Scholar]
- 11. Hata R., Maeda K., Hermann D., Mies G., and Hossmann K. A. (2000) Dynamics of regional brain metabolism and gene expression after middle cerebral artery occlusion in mice. J. Cereb. Blood Flow Metab. 20, 306–315 [DOI] [PubMed] [Google Scholar]
- 12. Lipton P. (1999) Ischemic cell death in brain neurons. Physiol. Rev. 79, 1431–1568 [DOI] [PubMed] [Google Scholar]
- 13. Thilmann R., Xie Y., Kleihues P., and Kiessling M. (1986) Persistent inhibition of protein synthesis precedes delayed neuronal death in postischemic gerbil hippocampus. Acta Neuropathol. 71, 88–93 [DOI] [PubMed] [Google Scholar]
- 14. Hermann D. M., Kilic E., Hata R., Hossmann K. A., and Mies G. (2001) Relationship between metabolic dysfunctions, gene responses and delayed cell death after mild focal cerebral ischemia in mice. Neuroscience 104, 947–955 [DOI] [PubMed] [Google Scholar]
- 15. Hossmann K. A. (2006) Pathophysiology and therapy of experimental stroke. Cell. Mol. Neurobiol. 26, 1057–1083 [DOI] [PMC free article] [PubMed] [Google Scholar]
- 16. Kirino T. (2000) Delayed neuronal death. Neuropathology 20, S95–S97 [DOI] [PubMed] [Google Scholar]
- 17. Harukuni I., and Bhardwaj A. (2006) Mechanisms of brain injury after global cerebral ischemia. Neurol. Clin. 24, 1–21 [DOI] [PubMed] [Google Scholar]
- 18. Pulsinelli W. A., Brierley J. B., and Plum F. (1982) Temporal profile of neuronal damage in a model of transient forebrain ischemia. Ann. Neurol. 11, 491–498 [DOI] [PubMed] [Google Scholar]
- 19. DeGracia D. J., Jamison J. T., Szymanski J. J., and Lewis M. K. (2008) Translation arrest and ribonomics in post-ischemic brain: layers and layers of players. J. Neurochem. 106, 2288–2301 [DOI] [PMC free article] [PubMed] [Google Scholar]
- 20. Ayuso M. I., Martínez-Alonso E., Cid C., Alonso de Leciñana M., and Alcázar A. (2013) The translational repressor eIF4E-binding protein 2 (4E-BP2) correlates with selective delayed neuronal death after ischemia. J. Cereb. Blood Flow Metab. 33, 1173–1181 [DOI] [PMC free article] [PubMed] [Google Scholar]
- 21. White B. C., Sullivan J. M., DeGracia D. J., O'Neil B. J., Neumar R. W., Grossman L. I., Rafols J. A., and Krause G. S. (2000) Brain ischemia and reperfusion: molecular mechanisms of neuronal injury. J. Neurol. Sci. 179, 1–33 [DOI] [PubMed] [Google Scholar]
- 22. Liu C. L., Ge P., Zhang F., and Hu B. R. (2005) Co-translational protein aggregation after transient cerebral ischemia. Neuroscience 134, 1273–1284 [DOI] [PMC free article] [PubMed] [Google Scholar]
- 23. Zhang F., Liu C. L., and Hu B. R. (2006) Irreversible aggregation of protein synthesis machinery after focal brain ischemia. J. Neurochem. 98, 102–112 [DOI] [PMC free article] [PubMed] [Google Scholar]
- 24. Jamison J. T., Kayali F., Rudolph J., Marshall M., Kimball S. R., and DeGracia D. J. (2008) Persistent redistribution of poly-adenylated mRNAs correlates with translation arrest and cell death following global brain ischemia and reperfusion. Neuroscience 154, 504–520 [DOI] [PMC free article] [PubMed] [Google Scholar]
- 25. Cooper H. K., Zalewska T., Kawakami S., Hossmann K. A., and Kleihues P. (1977) The effect-of ischaemia and recirculation on protein synthesis in the rat brain. J. Neurochem. 28, 929–934 [DOI] [PubMed] [Google Scholar]
- 26. Pestova T., Lorsch J. R., and Hellen C. U. T. (2007) The mechanism of translation initiation in eukaryotes, in Translational Control in Biology and Medicine (Mathews M. B., Sonenberg N., and Hershey J. W. B., eds) pp. 87–128, Cold Spring Harbor Laboratory Press, Cold Spring Harbor, NY [Google Scholar]
- 27. Rogers G. W. Jr., Richter N. J., Lima W. F., and Merrick W. C. (2001) Modulation of the helicase activity of eIF4A by eIF4B, eIF4H, and eIF4F. J. Biol. Chem. 276, 30914–30922 [DOI] [PubMed] [Google Scholar]
- 28. Shahbazian D., Roux P. P., Mieulet V., Cohen M. S., Raught B., Taunton J., Hershey J. W., Blenis J., Pende M., and Sonenberg N. (2006) The mTOR/PI3K and MAPK pathways converge on eIF4B to control its phosphorylation and activity. EMBO J. 25, 2781–2791 [DOI] [PMC free article] [PubMed] [Google Scholar]
- 29. Raught B., and Gingras A. C. (2007) Signaling to translation initiation, in Translational Control in Biology and Medicine (Mathews M. B., Sonenberg N., and Hershey J. W. B., eds) pp. 369–400, Cold Spring Harbor Laboratory Press, Cold Spring Harbor, NY [Google Scholar]
- 30. Goto K., Ishige A., Sekiguchi K., Iizuka S., Sugimoto A., Yuzurihara M., Aburada M., Hosoya E., and Kogure K. (1990) Effects of cycloheximide on delayed neuronal death in rat hippocampus. Brain Res. 534, 299–302 [DOI] [PubMed] [Google Scholar]
- 31. Papas S., Crépel V., Hasboun D., Jorquera I., Chinestra P., and Ben-Ari Y. (1992) Cycloheximide reduces the effects of anoxic insult in vivo and in vitro. Eur. J. Neurosci. 4, 758–765 [DOI] [PubMed] [Google Scholar]
- 32. Higashi S., Kabuta T., Nagai Y., Tsuchiya Y., Akiyama H., and Wada K. (2013) TDP-43 associates with stalled ribosomes and contributes to cell survival during cellular stress. J. Neurochem. 126, 288–300 [DOI] [PubMed] [Google Scholar]
- 33. Anderson P., and Kedersha N. (2002) Visibly stressed: the role of eIF2, TIA-1, and stress granules in protein translation. Cell Stress Chaperones 7, 213–221 [DOI] [PMC free article] [PubMed] [Google Scholar]
- 34. Wolozin B. (2012) Regulated protein aggregation: stress granules and neurodegeneration. Mol. Neurodegener. 7, 56. [DOI] [PMC free article] [PubMed] [Google Scholar]
- 35. DeGracia D. J., Rudolph J., Roberts G. G., Rafols J. A., and Wang J. (2007) Convergence of stress granules and protein aggregates in hippocampal cornu ammonis 1 at later reperfusion following global brain ischemia. Neuroscience 146, 562–572 [DOI] [PMC free article] [PubMed] [Google Scholar]
- 36. Jamison J. T., Szymanski J. J., and Degracia D. J. (2011) Organelles do not colocalize with mRNA granules in post-ischemic neurons. Neuroscience 199, 394–400 [DOI] [PMC free article] [PubMed] [Google Scholar]
- 37. Martín de la Vega C., Burda J., and Salinas M. (2001) Ischemia-induced inhibition of the initiation factor 2α phosphatase activity in the rat brain. NeuroReport 12, 1021–1025 [DOI] [PubMed] [Google Scholar]
- 38. Fujimura K., Sasaki A. T., and Anderson P. (2012) Selenite targets eIF4E-binding protein-1 to inhibit translation initiation and induce the assembly of non-canonical stress granules. Nucleic Acids Res. 40, 8099–8110 [DOI] [PMC free article] [PubMed] [Google Scholar]
- 39. Emara M. M., Fujimura K., Sciaranghella D., Ivanova V., Ivanov P., and Anderson P. (2012) Hydrogen peroxide induces stress granule formation independent of eIF2α phosphorylation. Biochem. Biophys. Res. Commun. 423, 763–769 [DOI] [PMC free article] [PubMed] [Google Scholar]
- 40. Rhoads R. E. (2009) eIF4E: new family members, new binding partners, new roles. J. Biol. Chem. 284, 16711–16715 [DOI] [PMC free article] [PubMed] [Google Scholar]
- 41. Proud C. G. (2007) Signalling to translation: how signal transduction pathways control the protein synthetic machinery. Biochem. J. 403, 217–234 [DOI] [PubMed] [Google Scholar]
- 42. Ayuso M. I., Martinez-Alonso E., Salvador N., Bonova P., Regidor I., and Alcázar A. (2015) Dissociation of eIF4E-binding protein 2 (4E-BP2) from eIF4E independent of Thr37/Thr46 phosphorylation in the ischemic stress response. PLoS One 10, e0121958. [DOI] [PMC free article] [PubMed] [Google Scholar]
- 43. Wolozin B., and Apicco D. (2015) RNA binding proteins and the genesis of neurodegenerative diseases. Adv. Exp. Med. Biol. 822, 11–15 [DOI] [PMC free article] [PubMed] [Google Scholar]
- 44. Gilks N., Kedersha N., Ayodele M., Shen L., Stoecklin G., Dember L. M., and Anderson P. (2004) Stress granule assembly is mediated by prion-like aggregation of TIA-1. Mol. Biol. Cell 15, 5383–5398 [DOI] [PMC free article] [PubMed] [Google Scholar]
- 45. Buchan J. R. (2014) mRNP granules. Assembly, function, and connections with disease. RNA Biol. 11, 1019–1030 [DOI] [PMC free article] [PubMed] [Google Scholar]
- 46. García-Bonilla L., Cid C., Alcázar A., Burda J., Ayuso I., and Salinas M. (2007) Regulation proteins of eukaryotic initiation factor 2-α subunit (eIF2a) phosphatase, under ischemic reperfusion and tolerance. J. Neurochem. 103, 1368–1380 [DOI] [PubMed] [Google Scholar]